What Is Data Drift and How Do You Stop It?
|
5
min read

You've got a dashboard that looked fine on Monday, a model that passed validation last month, and a stakeholder asking why the numbers feel “off” today. That's usually how data drift announces itself, through a broken forecast, a weird recommendation, or a report that no longer matches what teams on the ground are seeing.
The annoying part is that nothing has to “break” in the obvious sense. The pipeline can keep running, the tables can keep filling, and the model can still return confident answers. The core problem is that the world moved while your data stack stayed anchored to an older version of it.
When Good Models Go Bad The Silent Threat of Data Drift
A model that behaved perfectly in test can start making bizarre calls in production, and the first sign is often not a red error message. It's a sales team questioning a dashboard, a finance team reconciling mismatched figures, or an operations lead asking why the same input now produces a different decision. That gap between “worked yesterday” and “doesn't make sense today” is where data drift lives.
In practice, data drift means the statistical properties of input data change over time, so the training distribution no longer matches live conditions. That mismatch can creep into BI layers, reporting flows, and automated decisions, not just machine learning outputs. In Spain, this has become harder to ignore because the European Commission's DESI 2022 report found that 75% of enterprises already had at least a basic level of digital intensity, above the EU average of 69% (DESI 2022 context for Spain).
That's why the issue isn't just model quality. It's continuity. When most of a business is already running on data, a small shift in transactions, customer behaviour, or schema patterns can spread quickly through the rest of the stack. The risk shows up first as confusion, then as bad decisions, then as people losing trust in the numbers.
Keep the model honest with data quality checks
Practical rule: if stakeholders are asking “why does this look wrong?” before they're asking “how accurate is the model?”, you're already dealing with an observability problem, not a modelling problem.
The Ship of Theseus Problem for Your Data
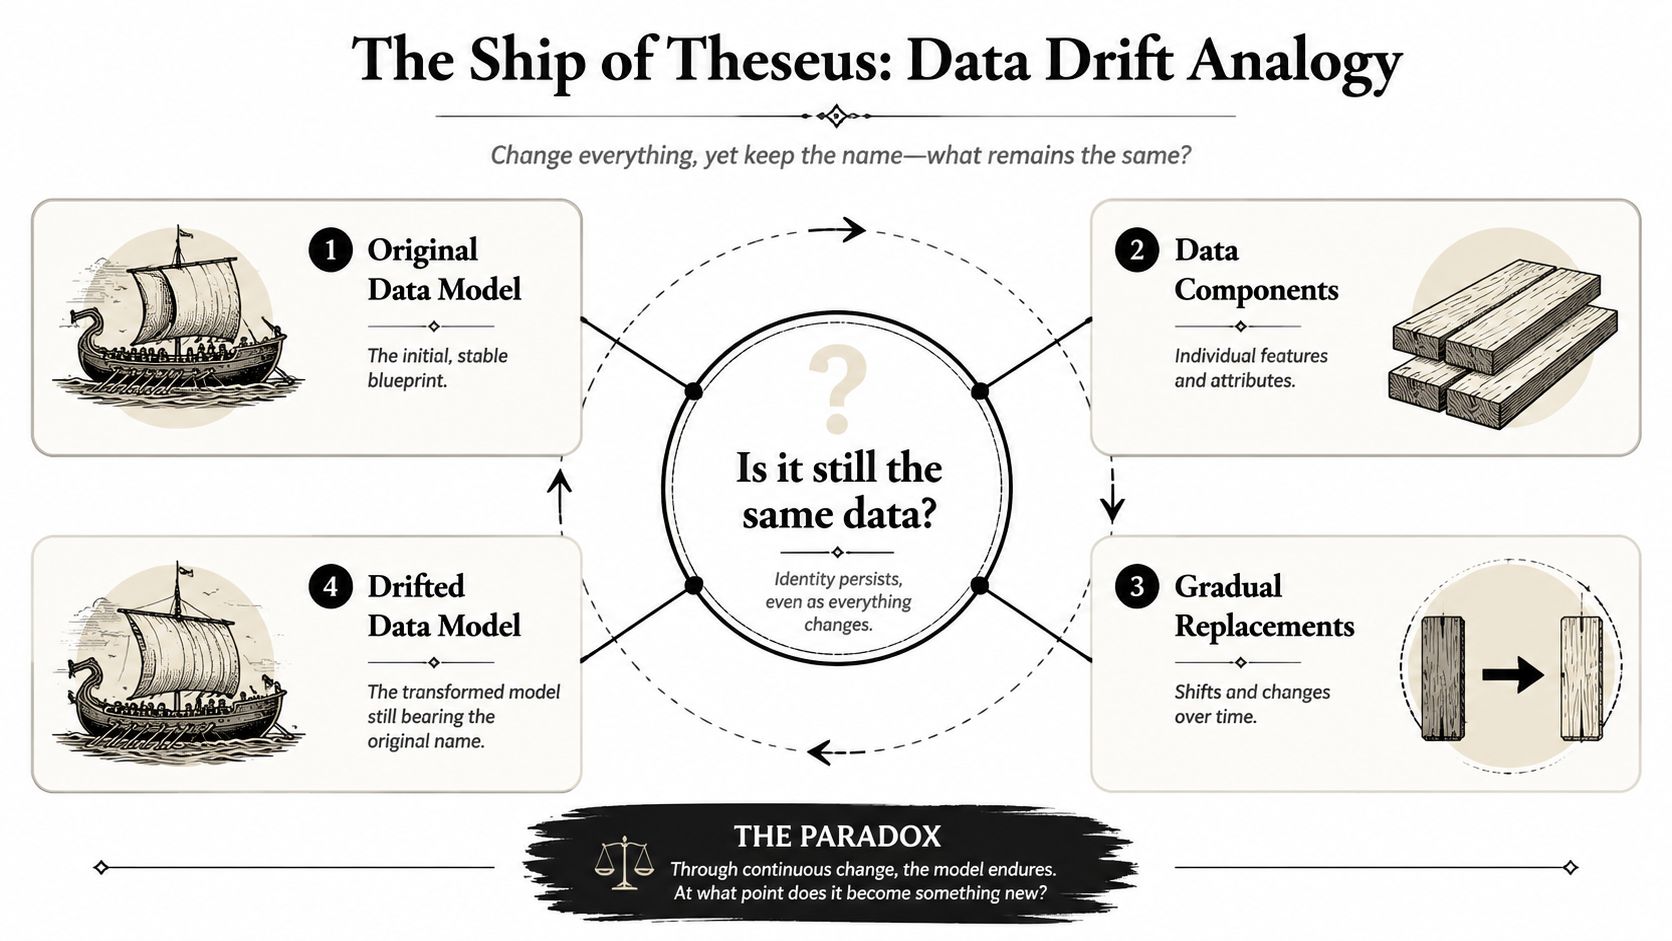
Data drift fits the Ship of Theseus paradox well. A pipeline can keep the same name, the same tables, and even the same dashboard title while its contents slowly stop matching the data it was built on. One feature starts arriving with different values, another comes in late, a source reuses a category label for something slightly different, and the live dataset becomes a different object even though nobody has renamed it.
That is what makes drift hard to spot in production. It usually does not arrive as a single obvious failure. It creeps in as small substitutions that look harmless on their own, then shift the overall distribution enough to change how reports, alerts, and models behave. In practice, teams need drift monitoring and distribution comparison because waiting for a visible business failure means the mismatch has already spread through the stack.
Slow drift and sudden shift are not the same
Slow drift feels like watching a shoreline move after repeated tides. The change is there, but you only notice it when you compare today's data with last month's reference set. A sudden shift feels more like a road closure after a storm. Yesterday's route still exists in memory, but it no longer works in live operations.
Slow drift usually appears in customer mix, transaction patterns, and seasonal behaviour. Sudden shifts usually come from a release, a regulatory change, or a source system update. The mistake is treating both cases as a single accuracy problem and hoping retraining will repair everything at once.
In a European reporting setup, that difference matters outside the model itself. A slow change in a revenue feed can distort finance dashboards for weeks before anyone notices. A sudden schema change can break compliance reports, frustrate auditors, and send teams chasing a false error in the BI layer while the source system keeps moving. The same pipeline can look healthy on paper and still be wrong in the places where business decisions get made.
Structural changes can break your pipeline
A stable label on top of unstable data is one of the easiest ways to lose trust.
The Usual Suspects Behind a Data Drift Disaster
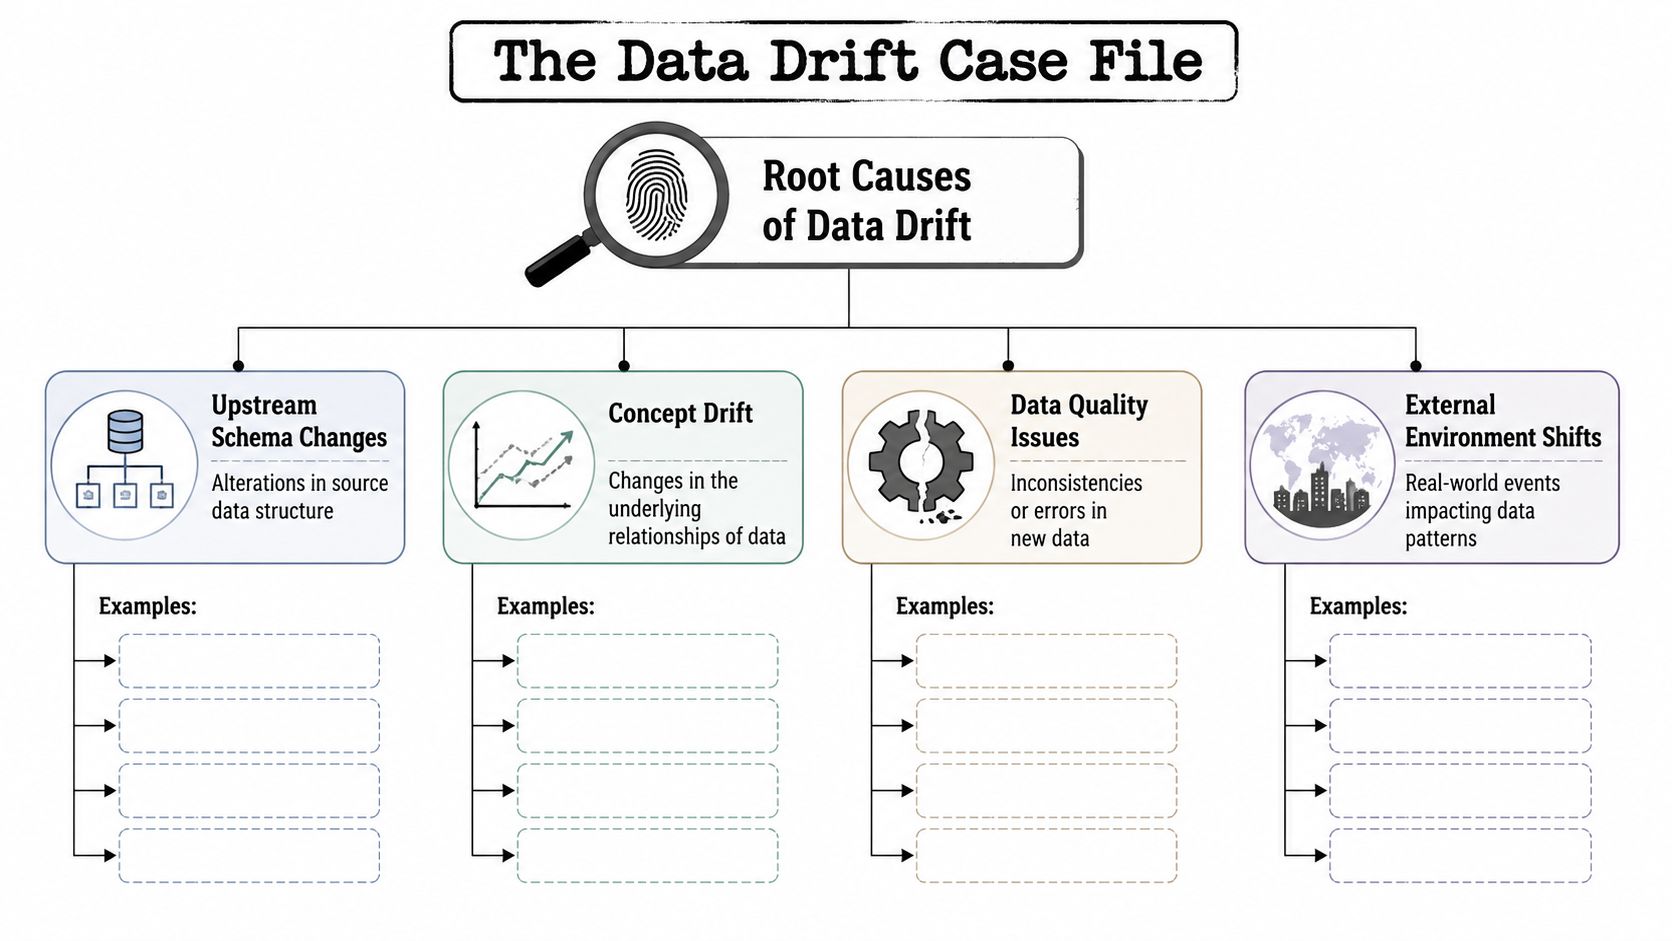
The quickest way to diagnose drift is to look at where change usually enters the system. In Spanish enterprises, that matters more than in a neat demo environment because the State Statistical Office reported in 2024 that 78.7% of large enterprises use cloud computing services, which means more moving parts, more dependencies, and more places for behaviour to change (cloud use and drift risk in Spain). A complex stack doesn't create drift by itself, but it gives drift more routes in.
Four places drift usually starts
Upstream schema changes: a column is renamed, a type changes, or a field disappears. Dashboards stop lining up, feature pipelines misread values, and reports drift away from source truth.
Concept drift: the relationship between inputs and outcomes changes. A pattern that used to signal one thing no longer means the same thing.
Data quality issues: missing values, duplicated records, delayed loads, and malformed entries subtly distort both analytics and model inputs.
External environment shifts: market behaviour, policy changes, and operational disruptions alter the rhythm of the data without warning.
The reason these causes hurt so much is that they don't only affect model accuracy. They can break statutory reporting, distort BI freshness, and make customer-facing analytics look authoritative when they are stale. In cloud-heavy environments, the fragility is spread across more services, schedules, and data feeds, so teams need to think in terms of dependency chains, not just tables.
One useful habit is to trace every broken metric back to the first system that changed, not the last one that failed. That's where the root cause usually sits.
Your Data Drift Detective Toolkit
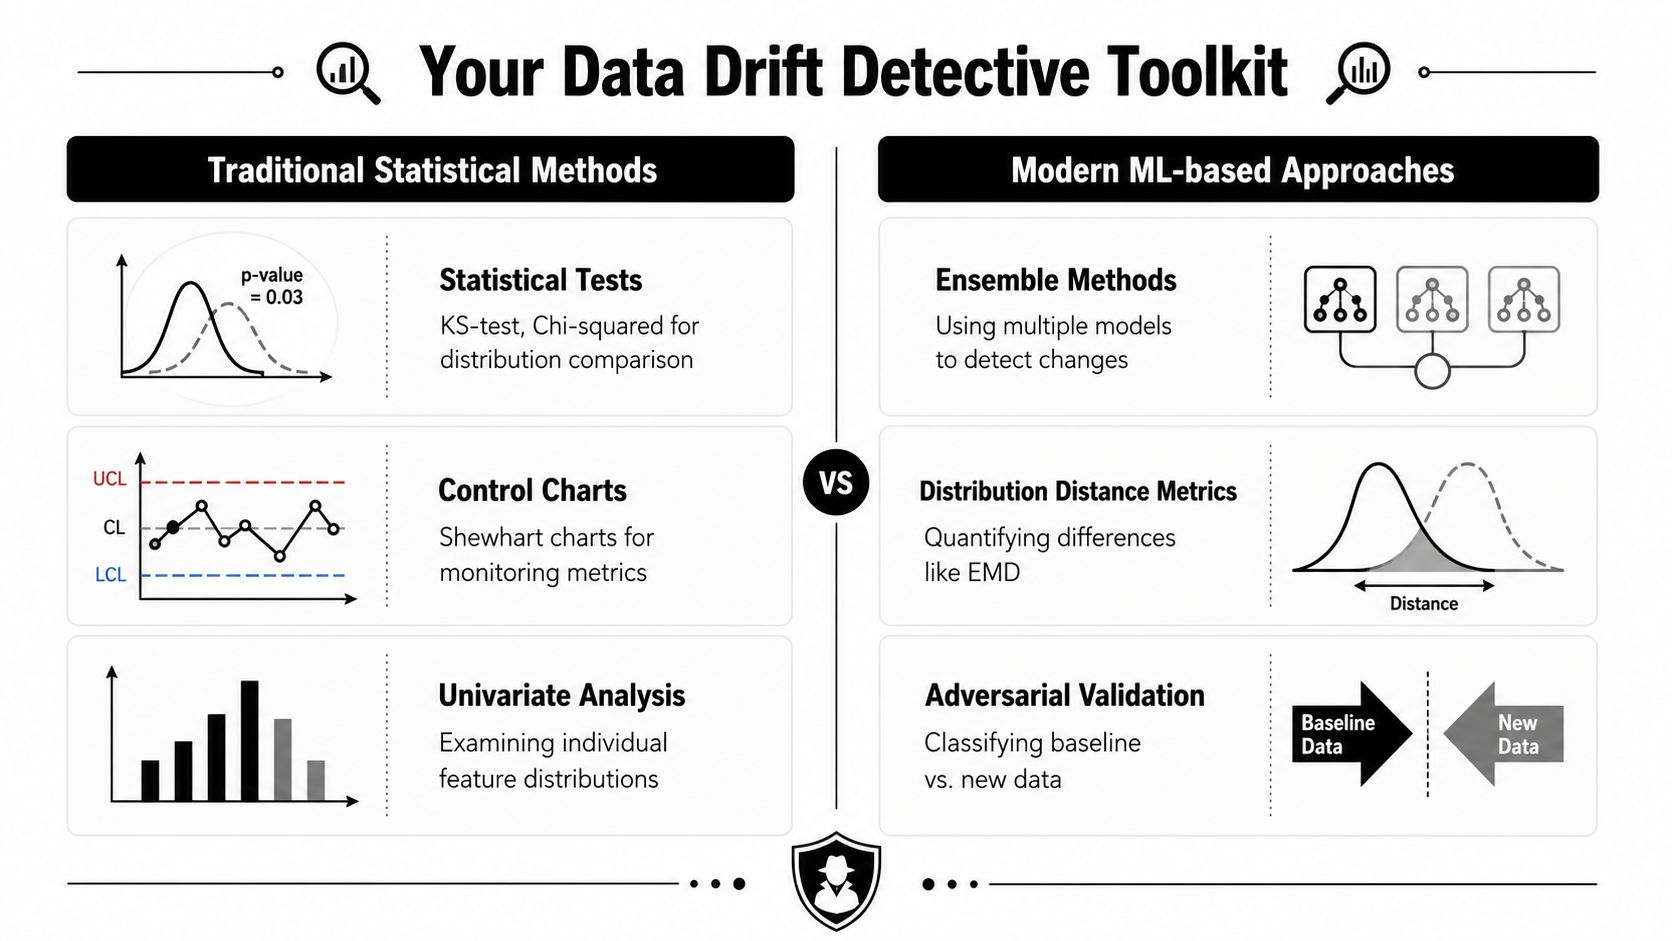
A drift detector does one job well. It answers whether live data still matches the baseline, and it does so before a stale feed turns into a broken dashboard, a misleading report, or a compliance headache. In a European reporting stack, that matters as much for BI freshness as it does for model accuracy.
Traditional statistical methods still earn their keep because they are clear and defensible. Modern observability tools add continuous monitoring, so teams do not have to wait until someone notices a chart looks odd or a downstream consumer complains.
The statistical side
The old-school tools are direct, and that is why they stay in the toolbox. The Kolmogorov–Smirnov test compares two distributions and shows whether they differ. The chi-square test is suited to categorical shifts. Distance metrics such as Jensen–Shannon divergence and Population Stability Index, PSI, help measure how far the current batch has moved from the reference set (common drift comparison methods).
These methods work best when the team knows which fields matter and wants a clear threshold for action. They are less helpful when the issue sits inside a subgroup, a delayed file, or a small combination of changes spread across several columns. A single summary score can miss that kind of drift, and in practice that is how a clean-looking report can still be wrong.
The observability side
A platform such as digna fits the operational side of the problem. It can learn normal behaviour, track anomalies in the pipeline, and surface structural changes without asking an analyst to hand-maintain every rule. That matters when the stack has too many tables, schedules, and downstream consumers to inspect one by one.
Practical rule: use statistical tests for precision, use observability for coverage. If you only have one, something will slip past.
The strongest teams combine both approaches. They compare batches against a baseline, watch feature-level distribution changes, and keep an eye on timeliness and schema changes too. That way, a late file, a bad join, and a real distribution shift do not end up in the same vague alert. For a quick example of how anomaly monitoring can surface issues before they spread, see Spot issues early before they spread.
Building Your Data Drift Defence System
The strongest defence against drift is boring, disciplined, and continuous. You want clear data contracts, versioned inputs, monitored baselines, and alerts that fire for real change rather than every harmless wobble. If a team only checks for problems after a model starts failing, it's already too late to preserve trust in the output.
Build for the whole data path, not just the model
Start with contracts that define what good input looks like. Then version the data and the model together so you can tell whether a change came from the source or from the algorithm. After that, add monitoring that watches both content and timing, because a late file can hurt a dashboard just as much as a malformed one.
Segment-awareness matters here. A shift might exist in one product line or one customer cohort while aggregate metrics still look fine, and that's exactly how false confidence sneaks in. Monitoring at the right slice of the data reduces false negatives and helps you route remediation where it belongs (segment-aware drift detection).
Keep alerts useful
Alert fatigue kills observability faster than drift does. If every minor fluctuation triggers the same severity, people stop paying attention. A good setup distinguishes between schema changes, timing issues, and genuine distribution change, then routes each one to the right owner.
Data contracts turn quality into a shared expectation
Use monitoring to narrow the blast radius. A noisy alert is cheaper to ignore than a silent failure is to discover late.
Becoming a Vigilant Data Team
For organisations in Spain and across the EU, drift isn't just an engineering nuisance. It touches compliance, reporting, and operational resilience, because the GDPR, enforced by authorities like the AEPD, requires data to be accurate and integral (GDPR accuracy and integrity expectations). If records, schemas, or delivery patterns drift without being noticed, inaccurate data can spread into profiling, reporting, and automated decisions before anyone has a chance to catch it.
That's why the right mindset is not “monitor the model.” It's “protect the data environment.” The model is only one consumer of that environment. Finance, BI, compliance, and operations all depend on the same signals, and a quiet change in those signals can become a business problem long before it becomes a modelling bug.
Use the reliability checklist to tighten your controls
A vigilant data team treats data drift as a continuity issue, not a side quest for MLOps. It watches for distribution change, tracks revisions, checks freshness, and keeps ownership clear when something moves. That's the difference between systems that merely run and systems people can still trust on a bad day.
Explore how digna can power your open-source data quality stack with enterprise-grade observability and compliance.
Frequently asked questions
What is data drift?
Data drift is a change in the statistical properties of input data over time, so the training distribution no longer matches live conditions. The article stresses that it reaches beyond machine learning: the mismatch can creep into BI layers, reporting flows, and automated decisions while pipelines keep running normally.
What causes data drift?
Four sources account for most drift: upstream schema changes such as a renamed column or changed type, concept drift where inputs relate differently to outcomes, data quality issues like missing values or delayed loads, and external shifts in markets, policy, or operations. Trace a broken metric back to the first system that changed.
How do you detect data drift with statistical tests?
The Kolmogorov-Smirnov test compares two distributions, the chi-square test suits categorical shifts, and distance metrics such as Jensen-Shannon divergence and the Population Stability Index (PSI) measure how far a batch has moved from its reference set. These work best when you know which fields matter and want clear thresholds.
What is the difference between slow data drift and a sudden shift?
Slow drift builds gradually, often in customer mix, transaction patterns, or seasonal behaviour, and only shows when you compare today's data with last month's reference set. A sudden shift usually follows a release, regulatory change, or source system update. Treating both as one accuracy problem to fix by retraining is the common mistake.
Is retraining the model enough to stop data drift?
No. The article recommends a defence built on data contracts, versioning data and model together, monitoring both content and timing, and segment-aware checks, since a shift can hide in one product line while aggregates look fine. Pair statistical tests for precision with observability for coverage, and route each alert to the right owner.



