Anomaly Detection Streaming Data: A Practical Guide
|
8
min read

You usually don't get paged for anomaly detection streaming data because a model was elegant. You get paged because a dashboard went stale, a warehouse load arrived late, or an executive noticed a metric jump before anyone else did. In that moment, the question isn't whether the algorithm is clever enough, it's whether the system can keep watching while the stream keeps moving.
That's the operational gap many groups encounter. Batch anomaly detection assumes you can pause, retrain, and inspect history, but a live pipeline has latency budgets, bounded memory, and data that hasn't finished arriving yet. In production, the job is to detect useful deviations quickly without turning every normal weekly cycle into noise.
Table of Contents
Why Streaming Pipelines Need a Different Kind of Anomaly Detection
The first failure usually looks small. A metric line bends in the wrong direction, someone refreshes the dashboard, and the number still looks “off” even though the job technically succeeded. Then the investigation starts, and the problem turns out to be drift, delayed events, or a detector that was trained on a world that no longer exists.

Streaming systems force a different operating model because the data is unbounded, stateful, and often nonstationary. A recent survey of streaming anomaly detection groups the field into statistical, distance, density, frequency-estimation, quantile-estimation, and change-detection methods, and it highlights sketch techniques like count-min sketch and space-saving for sublinear complexity on high-volume streams (PMC survey). That matters because a detector that needs full history, repeated passes, or heavy state can't keep pace when operational metrics, sensor feeds, and logs need attention within seconds.
Why batch instincts break down
Batch anomaly detection is good at retrospective cleanup. Streaming anomaly detection is about continuous decision-making while the stream is still in motion. You're not just asking, “Is this odd?” You're also asking, “Odd compared with what baseline, over what window, and with what tolerance for delay?”
The practical pressure shows up in storage, compute, and alert quality. If you keep everything forever, you pay for it. If you recompute everything from scratch, you miss the latency target. If you set thresholds too tightly, your on-call team stops trusting the system.
Practical rule: if the detector can't explain its current baseline and update cadence, it's not ready for production.
The operational answer is usually a running baseline, a bounded window, and a decision that accepts some uncertainty in exchange for timeliness. That is why streaming anomaly detection is a discipline of its own. It isn't batch detection with a faster clock, it's a different contract with the data.
What Counts as an Anomaly in a Stream
The fastest way to waste time is to call every weird number an anomaly. In a live system, the label depends on what changed, where it changed, and whether the change is a single event or a pattern that only becomes visible over time. The detector choice follows that definition, not the other way around.
Point, contextual, collective, and shift-based anomalies
A point anomaly is a single event that looks impossible or out of range. In payments, that might be one transaction that lands far outside the usual envelope. In telemetry, it might be a sensor reading that violates a physical constraint.
A contextual anomaly is normal in general but wrong for this context. A value can be fine at noon and suspicious at 2 a.m., or normal for one customer segment and strange for another. If you don't encode context, you end up chasing legitimate seasonality.
A collective anomaly is a sequence that only makes sense as a group. One record may look harmless, but a run of small deviations can signal a slow leak, a bad deploy, or an ETL job that is gradually degrading output. That is where windowing starts to matter more than any single score.
A distribution shift is broader. The whole shape of the stream moves, and the old baseline stops representing current reality. The survey on streaming methods explicitly calls out real-time quantile estimation and change detection with chi-square tests or KL divergence for monitoring global shifts without storing the full stream (PMC survey).
Match the anomaly to the response
The type you hunt determines how fast you need to act. A point anomaly can be flagged immediately. A contextual anomaly usually needs segment-aware baselines. A collective anomaly demands a window or sequence view. A distribution shift requires model refresh and governance, not just an alert.
A detector that treats weekly seasonality as a surprise will bury real incidents under self-inflicted noise.
That's why anomaly detection streaming data work starts with vocabulary, not algorithms. If you don't know whether you're watching a spike, a context mismatch, a slow burn, or a regime change, you'll pick the wrong window, the wrong threshold, and the wrong escalation path.
Algorithm Families That Actually Work in Production
The key production question is which method keeps working after the first month, when traffic gets messy, labels stay thin, and someone still has to explain every alert. The algorithms that survive are usually the ones with small state, incremental updates, and enough transparency to justify a page at 2 a.m.
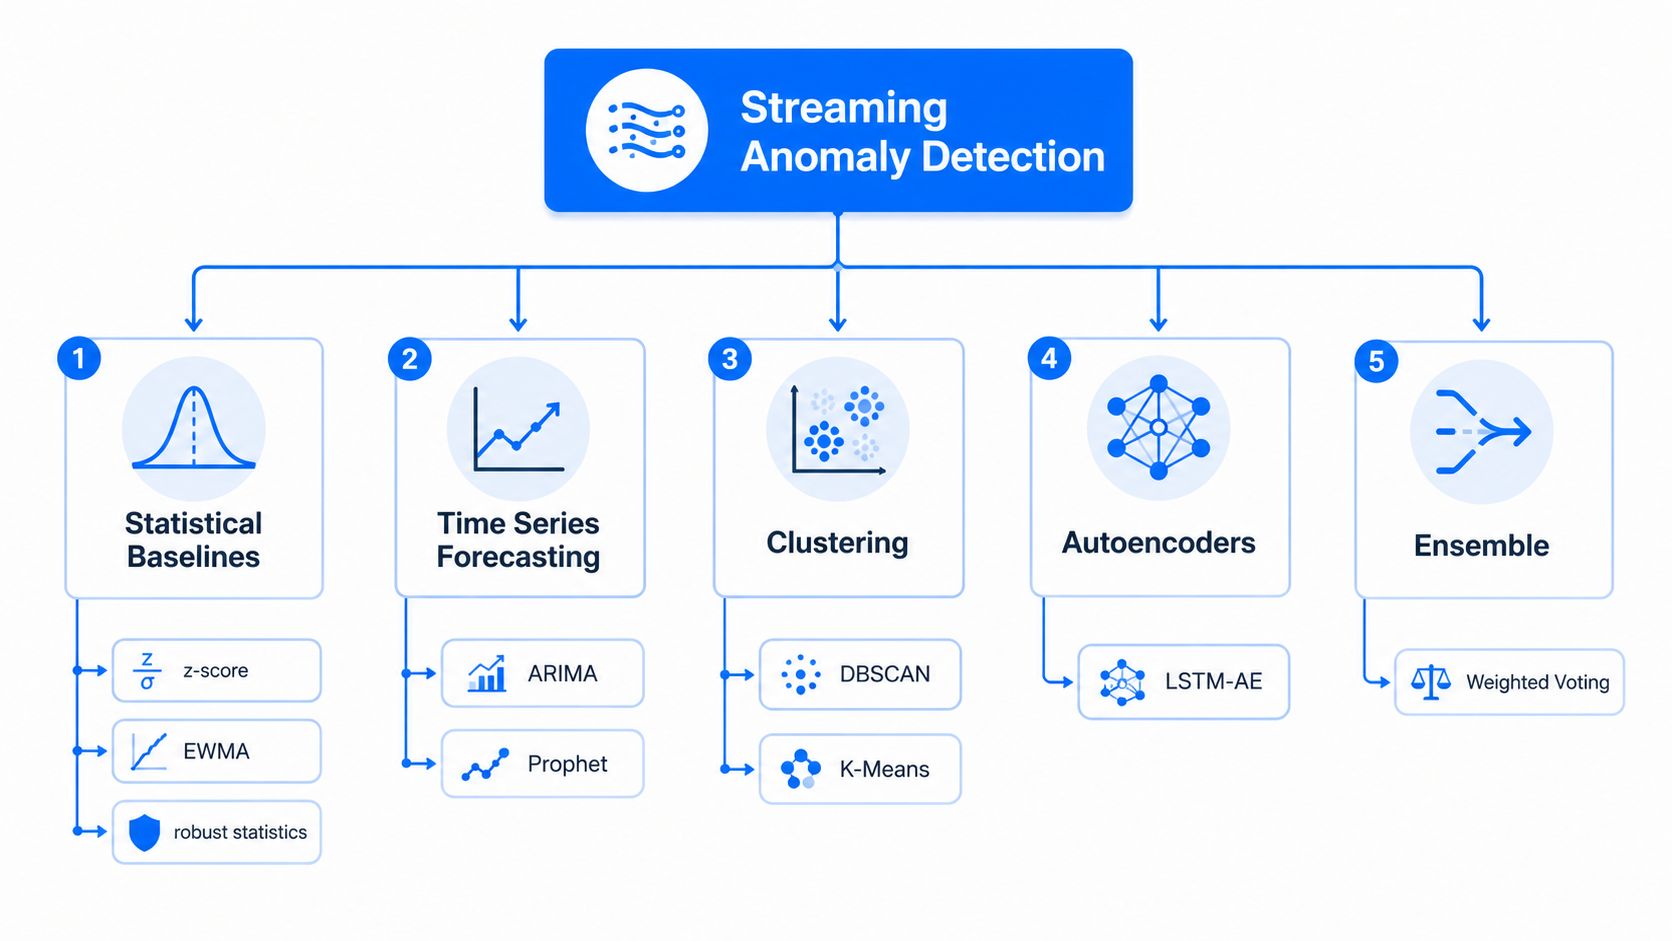
What tends to survive first contact with production
Statistical baselines like z-scores, EWMA, and resistant estimators usually form the first layer in a streaming stack. They are cheap, easy to tune, and straightforward to explain, which makes them useful for freshness checks, volume changes, and simple metric spikes. Their weakness shows up fast when the baseline itself starts moving, because a fixed threshold can turn into a noise generator.
Windowed and sketch-based methods fit streaming systems better because they compress state instead of holding the full event history. Methods such as count-min sketch and space-saving are useful when frequency estimation needs to stay small in memory and still handle high throughput, especially in systems that cannot retain every event. Their trade-off is clear, they scale well, but they usually give less context than a richer model.
Unsupervised ML such as Isolation Forest, one-class SVM, and matrix profile methods helps when a simple threshold misses structure and labels are scarce. These methods can catch patterns that look ordinary to a rule-based detector, but they are harder to explain and often need more careful feature handling than teams expect. In production, that explanation gap matters as much as raw score quality.
Deep learning approaches like autoencoders, LSTM forecasters, and transformer-based detectors can model richer sequence behavior, especially when anomalies depend on longer context. The cost shows up in retraining work, feature drift, and the distance between a score and a useful reason code. A model that is accurate but opaque is hard to trust during an incident.
Hybrid ensembles usually make the most sense once the stream has enough variety to expose the weak spots of any single method. A score from one detector, followed by a change-point check or a rule that confirms the distribution really moved, gives operators a better signal than a lone model output. That pattern is common because production failures rarely stay inside one neat category.
For teams that want a practical view of how automation and monitoring patterns show up in live pipelines, the DataLunix AI automation examples are a useful reference point.
For teams working inside governed data stacks, this guide on detecting anomalies in time series fits the operational choices described here.
Operational truth: the best algorithm is often the one your on-call team can interpret before the incident is over.
Streaming-Specific Design Decisions You Cannot Avoid
A streaming detector lives or dies on design details that never show up in toy demos. Windowing, late data, state growth, and drift handling decide whether the system stays useful after the first production month. Ignore them, and the detector slowly turns into a memory leak with an alerting interface.
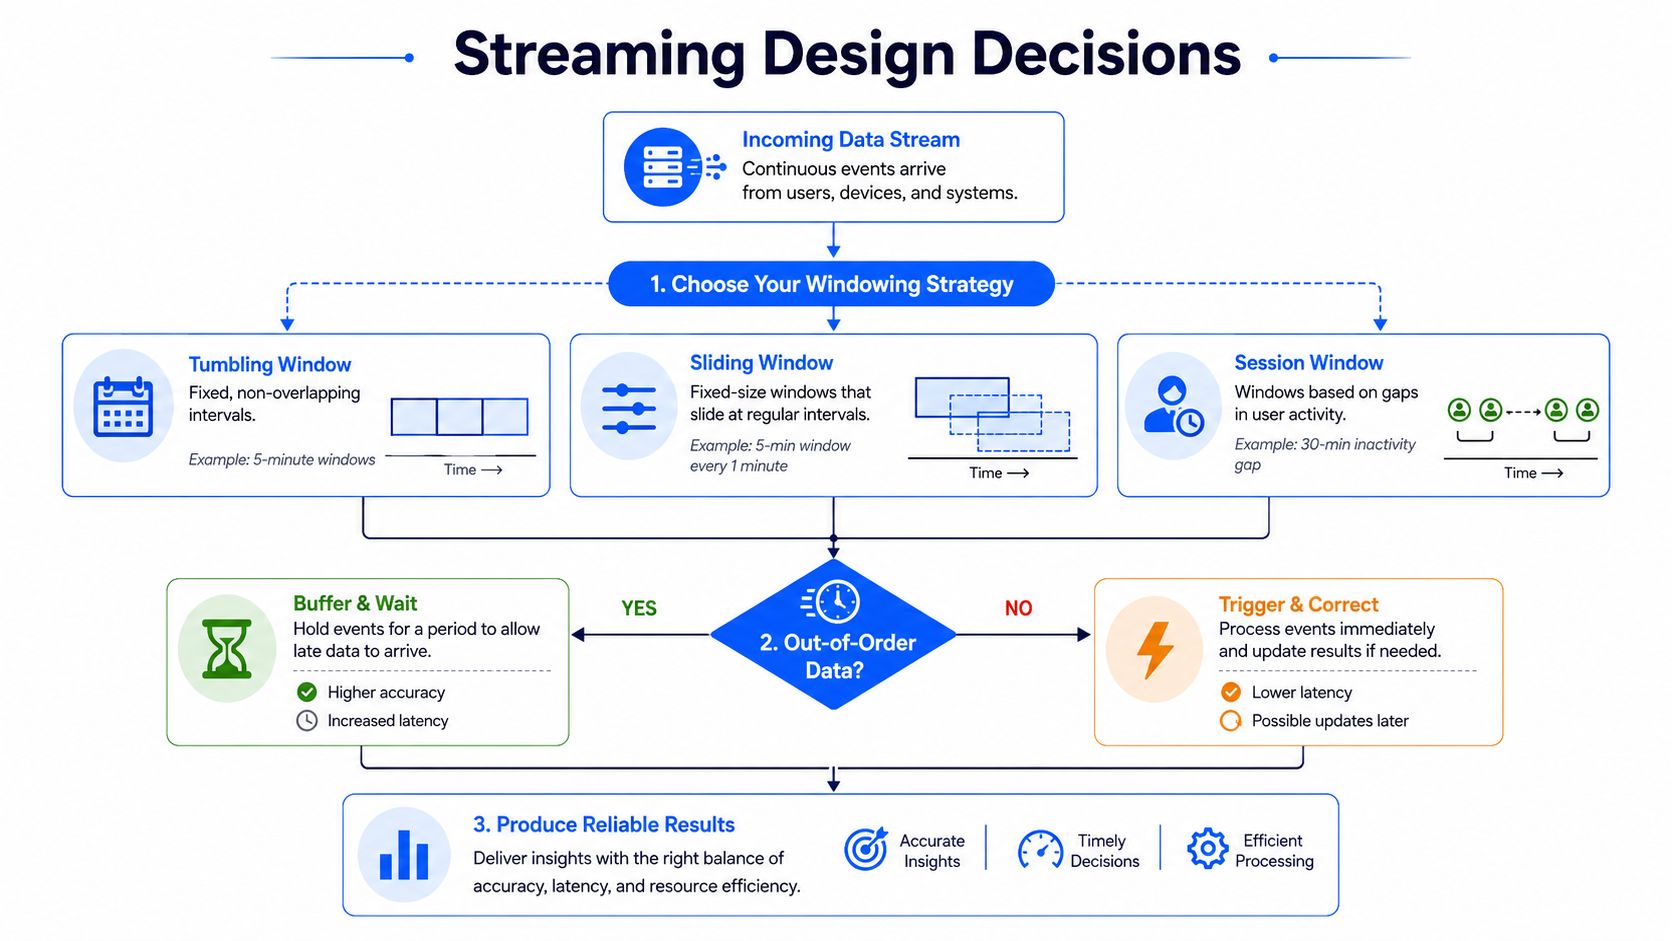
Windowing and late events
Tumbling windows are clean and easy to reason about, which is why they show up in a lot of first implementations. Sliding windows catch smoother changes because they overlap, but they can also amplify repeated alerts if you do not deduplicate. Session windows work better when activity is bursty and gaps matter more than fixed time slices.
Late and out-of-order events force another decision. You can buffer and wait, or you can trigger and correct later. The right choice depends on whether downstream consumers care more about correctness or speed, and in production that choice often changes by use case.
State and drift are the real traps
Streaming anomaly detection papers and implementations usually lean on incremental baselines instead of full retraining, because the stream does not stop long enough for static updates to keep up (TU Wien overview). In Flink-oriented operational guidance, one practical pattern is to wait for enough history before computing z-scores, start with a higher threshold than a classroom example would suggest, and split weekday and weekend baselines when weekly seasonality would otherwise blur the signal.
Those are guardrails, not universal laws. The primary issue is concept drift, and it must be treated as a design problem from day one. You need to decide when the model updates, what triggers the update, and how to avoid chasing transient noise.
If a baseline changes every time you get an alert, the model is learning your alerting policy instead of the business.
Incremental or one-class detectors become attractive for exactly that reason. For evolving streams with rare labels, methods like Streaming Half-Space Trees are built to train on normal data and adapt without rebuilding the whole model (IJCAI paper). Change-point methods such as chi-square, KL-divergence, CUSUM, and Page-Hinkley still matter when the stream shifts abruptly.
Calibrating Thresholds When Normal Keeps Moving
Thresholding is not a tuning footnote. It is the part of the system that decides whether the detector becomes trusted or ignored. When normal behavior changes, a single global cutoff usually fails because a stream can contain several shapes of normal, and the cost of missed anomalies is rarely the same as the cost of alert fatigue.
The metrics that matter in practice
For streaming detectors, I care about precision-recall more than accuracy because anomalies are usually rare. I also track alert volume per day, time-to-detect, and false-positive rate per detector because those are the numbers that show up on the pager, not just in the notebook. If the model scores well but overwhelms the team, it does not matter.
The recent review on streaming anomaly detection frames the field as two connected tasks, detect anomalies from incoming data and continuously update the model as the stream evolves, while dealing with concept drift, limited storage, and windowing tradeoffs. It also points out a gap that matters in real operations, thresholding is a design choice, not a universal setting, because the reference group and the score aggregation method change the meaning of the alert (arXiv review).
Compare the threshold posture by use case
Operational priority | Primary metric | Secondary metric | Typical threshold posture |
|---|---|---|---|
Stop missed incidents | Time-to-detect | False-negative review | Tighter, reviewed often |
Reduce alert fatigue | False-positive rate | Alert volume per detector | Conservative at first |
Protect business-critical pipelines | Precision-recall | Segment-level stability | Segment-aware, not global |
Catch slow drift | Recall over windows | Baseline movement | Adaptive, with drift checks |
A practical platform approach often relies on learned baselines and score aggregation rather than fixed cutoffs. That is the posture digna uses in customer-controlled environments, where Data Anomalies learns normal behavior and scores changes without asking teams to hand-maintain rules for every table. The value is not magic. It is that the threshold can be governed alongside the baseline, not bolted on after the fact.
Calibration rule: if normal changes by weekday, cohort, or schedule, the threshold has to respect that structure or it will generate noise.
That is why threshold review should be a recurring operational task. A detector that never gets revisited is either under-observing or over-alerting, and both problems eventually become governance problems.
Where Detection Runs and How It Integrates With Your Stack
Architecture is not a style choice here, it's a latency and ownership decision. Where the detector runs determines how much data moves, who controls the logic, and how hard it is to keep the system auditable. In practice, there are three places the work happens, and each one changes the trade-offs.
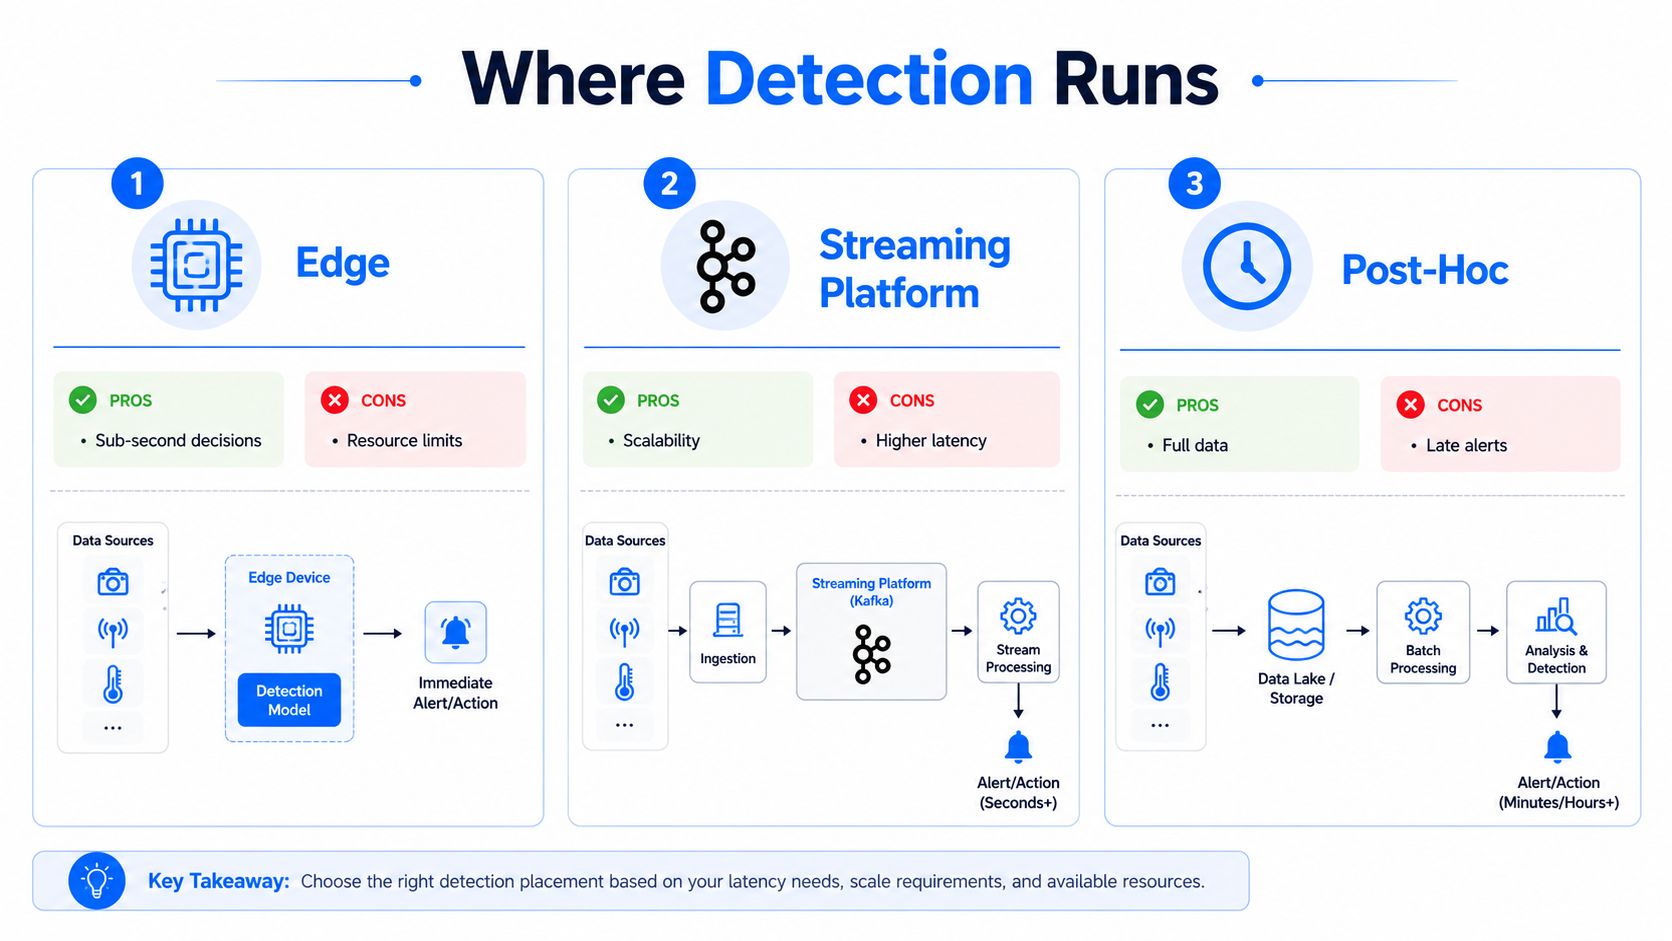
Edge, streaming platform, and in-database
At the edge, the detector sits close to producers. That helps when you need very fast decisions on sensors or logs, but resource limits show up immediately. Edge logic is hard to govern at scale if every device starts carrying its own version of the truth.
In-cluster, on a stream processor like Flink or Kafka Streams, is the usual middle ground. It handles high throughput, supports stateful processing, and works well when multiple topics feed the same detection logic. The downside is complexity, because the operational surface grows with the number of jobs, checkpoints, and state stores.
In-database changes the conversation. The model runs where the data already lives, so metric computation and baseline learning don't require moving sensitive data into another service. That's the pattern digna uses inside customer-controlled environments, and it matters for governance because the detection logic stays closer to the warehouse or lakehouse.
For teams that want a broader monitoring lens, real-time data monitoring is where anomaly scoring starts to overlap with timeliness checks, schema tracking, and validation.
Integration is part of the architecture
Detection is only useful if it reaches the incident flow cleanly. Alerts need to land in observability tools, ticketing systems, or incident channels with enough context to answer the first three questions quickly, is it real, what changed, and who owns it. Without that handoff, the model becomes another dashboard no one trusts.
A useful reference for the reliability side of the stack is Ryware on data platform reliability, especially if you're thinking about how pipeline reliability and anomaly detection reinforce each other in ETL-heavy environments.
The architectural takeaway is simple. Edge favors speed, stream processors favor scale, and in-database execution favors governance and reduced data movement. Pick the place that matches your actual bottleneck, not the one that sounds most modern.
A Worked Pipeline and an Alert That Actually Helps
The difference between a detector and a system people trust is the alert payload. A raw score by itself is not enough. On-call engineers need to know what moved, which baseline it was compared with, which segment is affected, and what action comes next.
A minimal production flow
A workable pipeline usually follows this shape.
Ingest events from the source.
Build a sliding or tumbling aggregate.
Score the aggregate against the current baseline.
Compare the score with the threshold.
Route the alert with context.
Pseudocode makes the control flow obvious:
The code is not the hard part. The alert content is. Every alert should include the baseline value, the deviation, the affected segment, and a runbook link. If the detector also knows the cohort or schedule, include that too. Otherwise the person on call spends time reconstructing context the model already had.
What triage should look like
Good triage is short and disciplined.
Confirm the signal: check whether the anomaly is real or a known seasonal pattern.
Check scope: decide whether the issue is isolated to one table, topic, or customer segment.
Assign ownership: route to the team that owns the upstream system, not the dashboard.
Close the loop: record the cause so the next baseline or threshold review starts from better context.
The strongest habit here is boring, and that is a compliment. Teams that review alerts against root cause end up with detectors that improve because the incident path feeds back into the operating process, not just the score path.
For a related reliability perspective on operational data systems, the Ryware on data platform reliability piece is a useful complement if you are shaping alerting around ETL failure modes.
A useful alert shortens investigation time. A noisy alert just advertises that the detector is alive.
Operating Anomaly Detection at Enterprise Scale
At enterprise scale, anomaly detection becomes a governance surface, not just a model. The questions shift from “Does it work?” to “Who can run it, where does the data live, how is it audited, and how often do we revisit the logic?” That's where privacy, scale, and operational discipline intersect.
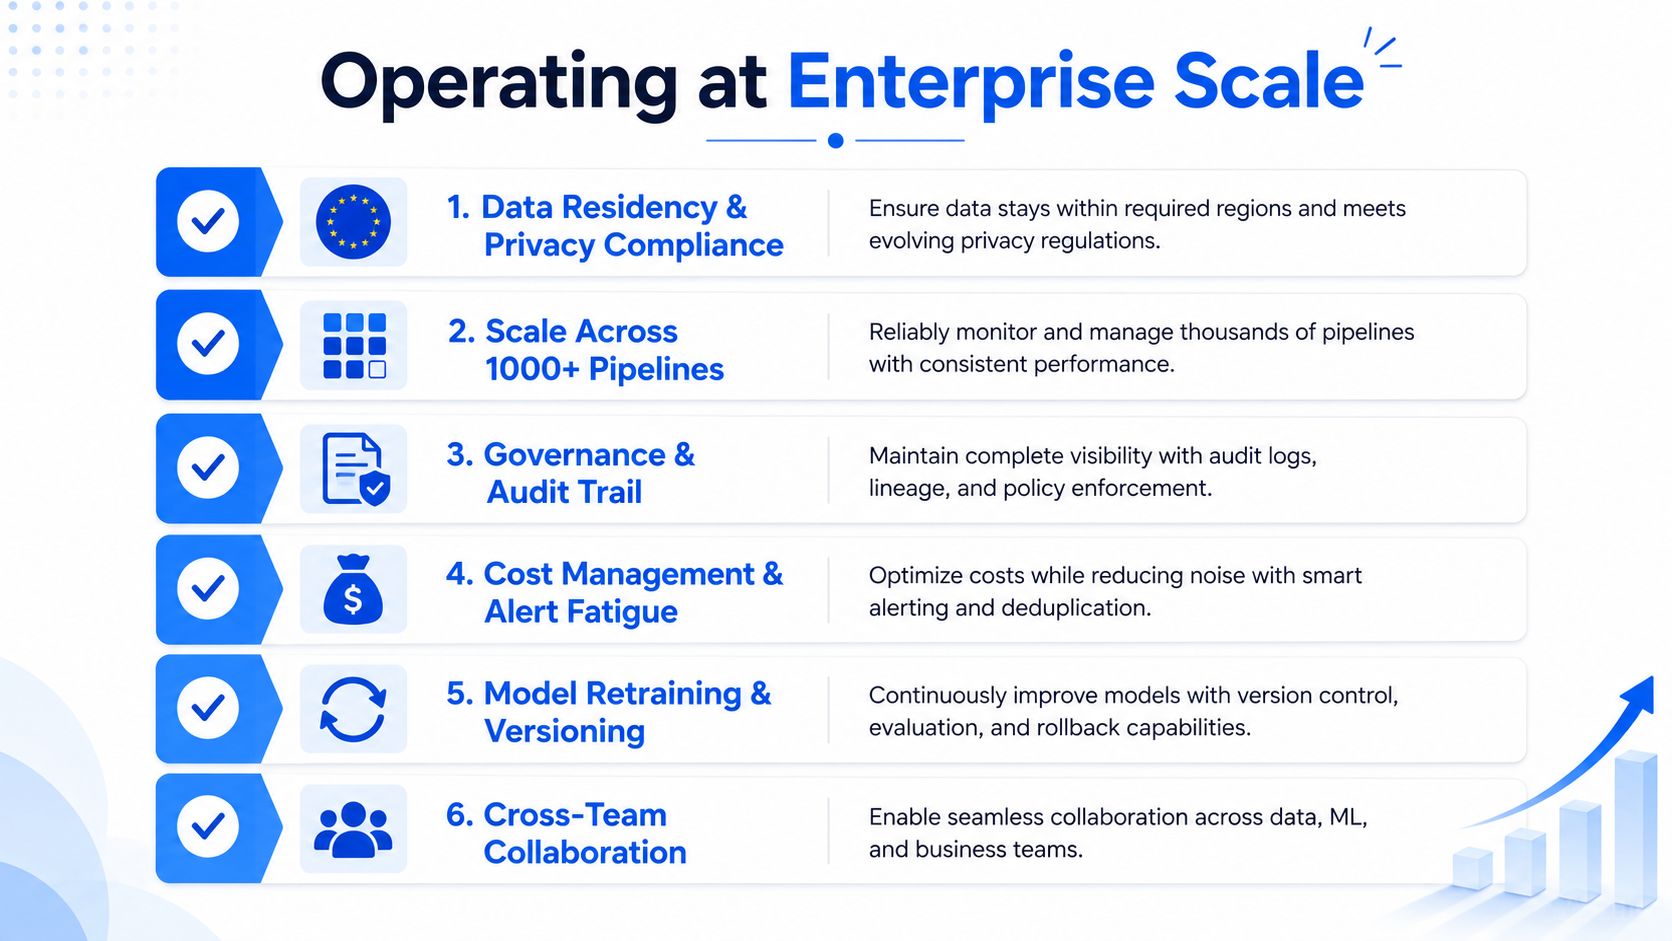
What the operating checklist really includes
The core checklist is straightforward.
Data residency and privacy compliance. Keep sensitive data in the environment that already governs it.
Scale across many pipelines. Don't build one-off logic for each table if the same baseline pattern can be reused.
Governance and audit trail. Keep the reasoning behind alerts inspectable.
Cost management and alert fatigue. Treat noisy detection as a cost problem, not just a model problem.
Retraining and versioning. Record when baselines change and why.
Cross-team collaboration. Engineers, analysts, and governance owners all need the same signal.
digna fits into this operating model as a platform that runs anomaly analysis, timeliness checks, validation, and schema tracking inside customer-controlled environments. Its value is practical, it keeps metric computation and baseline learning near the data, which reduces movement and keeps the audit surface simpler. That matters when a company needs to monitor freshness, silent drift, and structural changes without spraying data across extra systems.
The mindset shift that lasts
The biggest mistake is treating anomaly detection as a project with an end date. In production, it behaves more like a living control loop. Baselines age, pipelines change, and ownership shifts, so the detector has to be reviewed with the same seriousness as the data it watches.
What works is a narrow, explicit loop, detect, triage, learn, and revise. What fails is a one-time launch with no threshold review and no incident feedback. Teams that accept that reality usually end up with fewer surprises and more trust in the alerts they do keep.
If you're building anomaly detection streaming data workflows and want a system that keeps the analysis inside your own environment, start by seeing how digna handles anomalies, timeliness, validation, and schema changes together. It's a practical way to reduce silent data risk without handing your pipeline history to another service.
To see learned baselines and score aggregation working without hand-maintained rules for every table, look at how digna Data Anomalies learns normal behavior inside your own database.
Frequently asked questions
Why is anomaly detection on streaming data different from batch detection?
Streaming detection has to decide while data is still arriving, under latency budgets and bounded memory. Batch detection assumes you can pause, retrain and inspect full history. In a live stream the practical answer is a running baseline, a bounded window, and accepting some uncertainty in exchange for timeliness.
What types of anomalies occur in streaming data?
The article names four types: point anomalies, such as one transaction far outside the usual envelope; contextual anomalies, normal in general but wrong at 2 a.m. or for one segment; collective anomalies, a run of small deviations; and distribution shifts, where the whole stream moves and the old baseline stops fitting.
Which algorithms work best for real-time anomaly detection in production?
Methods with small state, incremental updates and explainable output usually survive. Statistical baselines like z-scores and EWMA form the first layer, sketches such as count-min and space-saving keep memory small, and hybrid ensembles pair a detector score with a change-point check like CUSUM or Page-Hinkley to confirm a real shift.
How should thresholds be set for streaming anomaly detection?
Thresholds should follow the structure of normal behavior rather than one global cutoff. If normal changes by weekday, cohort or schedule, the threshold must respect that. Track precision-recall, alert volume per day, time-to-detect and false-positive rate per detector, and treat threshold review as a recurring operational task.
What should a streaming anomaly alert include?
Every alert should carry the baseline value, the deviation, the affected segment and a runbook link, plus cohort or schedule when the detector knows them. Triage then follows four steps: confirm the signal, check scope, assign ownership to the upstream team, and record the cause for the next baseline review.



