What Is Data Platform
|
8
min read

A data platform is the integrated set of tools and infrastructure an organization uses to ingest, store, process, govern, and serve data for analytics and AI. The global data platform market was estimated at USD 82.4 billion in 2024 and is projected to exceed USD 210 billion by 2031, with a 14.5% compound annual growth rate over that forecast period, according to 6Wresearch's data platform market overview.
Your product team may already be living with the problem. A CRM export arrives as a spreadsheet, a Postgres replica contains application data, advertising platforms deliver CSV files, and a Looker dashboard suddenly breaks because someone renamed a field. Each source works on its own, but nobody can easily explain which version is current, who may use it, whether it arrived on time, or why a metric changed.
The issue usually isn't the data itself. It's the absence of one connected operating system for data.
Table of Contents
A Plain English Definition of a Data Platform
The Core Layers Every Data Platform Provides
Ingest is the loading dock
Storage is the pantry and walk-in cooler
Compute is the kitchen
Governance is the inspector and recipe book
Observability is the kitchen control panel
How Data Platforms Evolved Into What They Are Today
Warehouses Lakes and Lakehouses Compared
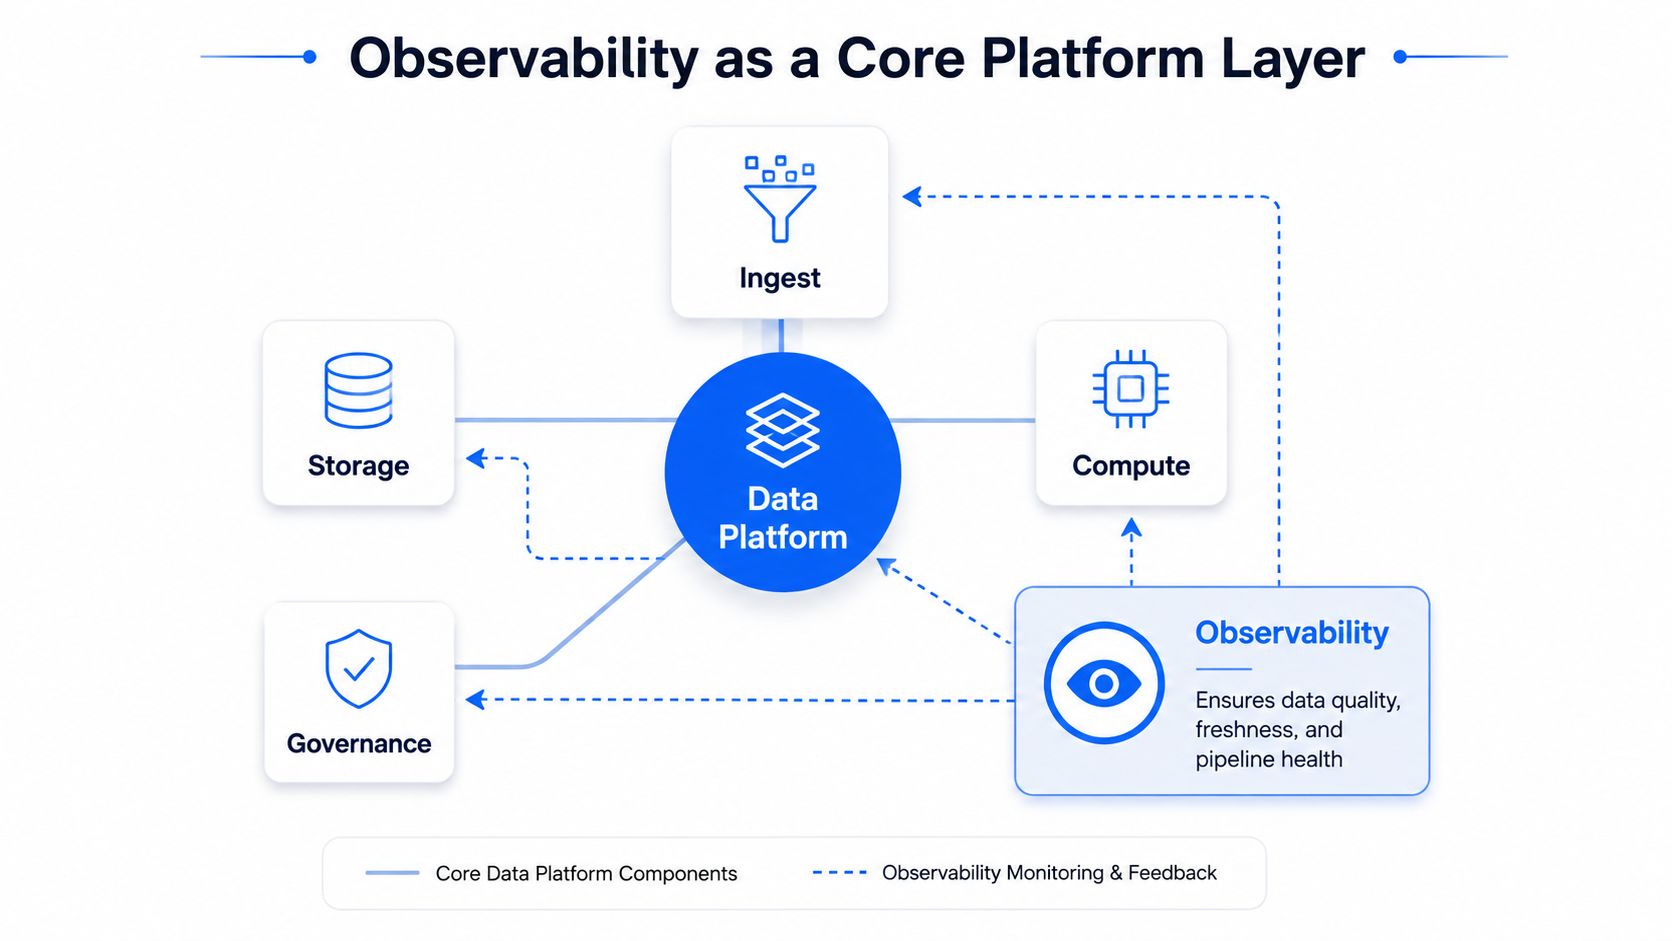
Why Observability Belongs Inside the Platform
The failures teams don't see in time
Quality and observability answer different questions
Data Platforms in Practice Across Industries
A Practical Checklist for Evaluating Your Platform
Ingestion and storage
Compute and modeling
Governance and access
Observability and reliability
A Plain English Definition of a Data Platform
Think of a data platform as the organization's shared data supply chain. It receives information from operational systems, stores it in suitable forms, prepares it for use, applies rules for access and meaning, and exposes trusted outputs to analysts, applications, and AI systems.
That definition has an important implication: a data platform isn't necessarily one product. It's an integrated collection of infrastructure, services, policies, and interfaces. A warehouse might provide storage and SQL processing, while separate services handle ingestion, transformation, cataloging, access control, and monitoring. Those pieces become a platform when they work together as a dependable system rather than as disconnected tools.
At a practical level, ask five questions:
Can data arrive reliably? This is the ingestion layer, covering files, APIs, application events, and change data capture.
Where does it live? Storage may include warehouse tables, object storage, lakehouse tables, or specialized real-time stores.
How is it prepared? Compute runs queries, transformations, aggregations, and machine learning workloads.
What does the data mean, and who may use it? Governance handles definitions, lineage, cataloging, permissions, and audit records.
How do teams know the system is healthy? Observability tracks freshness, schema changes, anomalies, pipeline behavior, and downstream impact.
Enterprise architecture guidance commonly describes this kind of platform as software that helps users store, access, manage, and govern enterprise data across both the data plane and the data control plane, as described in IDC's data platform market analysis.
A data platform is therefore not just a database, because a database may store data without managing its complete lifecycle. It isn't just a BI tool, because dashboards consume prepared data rather than managing ingestion and governance. It also isn't automatically a single-vendor suite. The defining feature is integration.
For a broader enterprise framing, this overview of enterprise data platforms is useful. The central question remains simple: can your organization move from source system to trusted decision without manually stitching together every stage?
The Core Layers Every Data Platform Provides
A restaurant makes the architecture easier to understand. Suppliers deliver ingredients, staff store them, cooks prepare dishes, inspectors enforce standards, and managers watch the operation for signs of trouble. A data platform follows the same pattern.
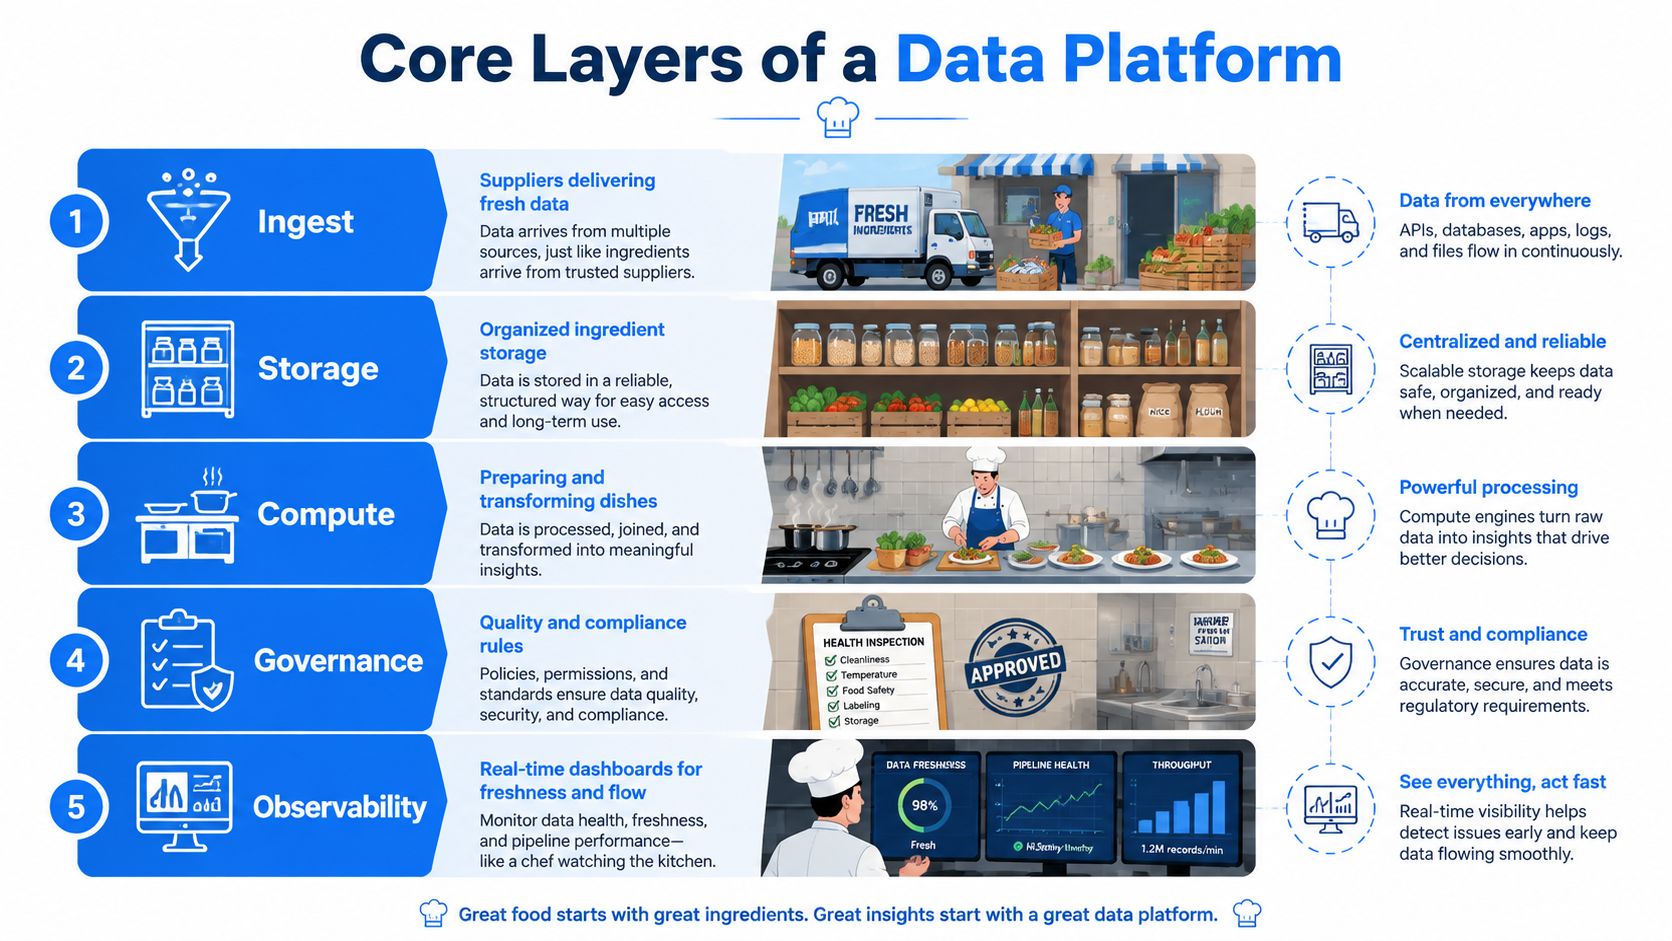
Ingest is the loading dock
Ingestion brings raw material into the platform. The sources might include application events, APIs, files, database replicas, or change data capture streams. Kafka can carry event streams, while connectors and scheduled jobs can load files and operational records.
The loading dock needs more than a door. It needs receiving times, source identification, failure handling, and a record of what arrived. Without those controls, a platform may accept data but still leave the team unable to tell whether a delivery was complete.
Organizations that need to connect external systems often evaluate Data API services alongside native connectors and event tools. The right choice depends on source variety, latency needs, and how much pipeline logic the internal team wants to own.
Storage is the pantry and walk-in cooler
Storage preserves the ingredients in forms that fit different jobs. Amazon S3 can hold structured and unstructured objects, while Snowflake can organize curated analytical tables. A lakehouse can place transactional table formats over object storage so teams can work with large, diverse datasets while retaining stronger table management.
Storage decisions affect cost, access speed, retention, and governance. Raw data may need to remain close to its original form for exploration, while curated data should be organized for repeatable business use.
Compute is the kitchen
Compute turns stored data into something useful. SQL engines answer questions, transformation frameworks such as dbt build modeled datasets, and distributed processing engines prepare data for complex workloads or machine learning.
The important distinction is that storage holds the ingredients, while compute does the work. Separating them can let teams scale processing and storage independently, but it also creates operational boundaries that need clear ownership.
Governance is the inspector and recipe book
Governance defines who can access data, what a metric means, where a dataset came from, and which controls apply to it. Unity Catalog, role-based access control, attribute-based access control, audit logging, catalogs, and lineage tools can support these responsibilities.
Governance also protects consistency. If one team defines “active customer” differently from another, both dashboards may be technically correct while producing conflicting decisions.
Observability is the kitchen control panel
Observability shows whether deliveries arrived, storage is available, transformations completed correctly, and outputs remain trustworthy. Tools such as Monte Carlo can monitor data behavior, while platform-native metrics and alerts provide operational context.
IBM-oriented architecture guidance treats observability as a foundational data platform layer because teams need visibility into trust, freshness, and pipeline behavior, not merely job success. A pipeline can finish successfully and still publish stale, incomplete, or structurally changed data.
A useful architectural view is presented in this data system architecture guide. The lesson is straightforward: moving data is only one part of the job. A functioning platform must also explain, protect, and continuously inspect what it moves.
How Data Platforms Evolved Into What They Are Today
Data platforms evolved through recurring trade-offs rather than a clean sequence of technologies replacing one another. Teams have repeatedly balanced schema discipline, flexibility, analytical speed, infrastructure cost, and governance.
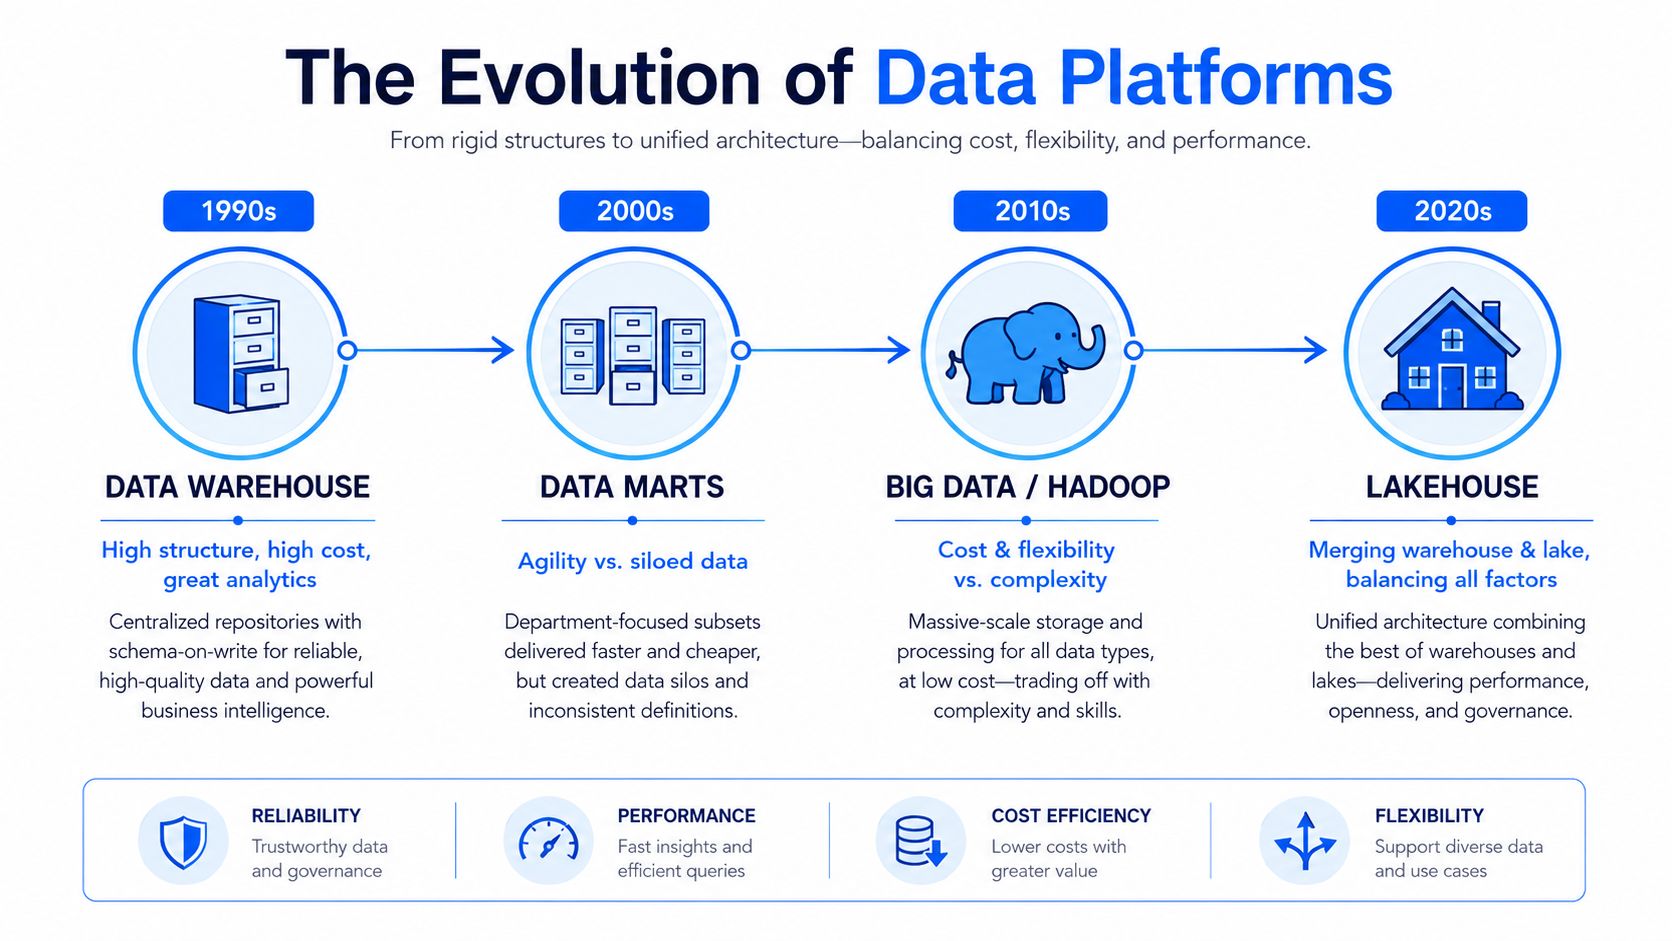
The data warehouse established a centralized model for reporting. Organizations consolidated information from multiple systems into structured schemas, giving analysts a unified view of the business. This approach supported reliable SQL analysis, but rigid schemas and expensive on-premises appliances made changes difficult and slow.
Data marts introduced more local flexibility. Individual departments could shape data for their own reporting needs, but the same flexibility could create duplicated logic and competing definitions. A finance mart and a marketing mart might each calculate a business measure differently, even when both drew from similar sources.
The data lake responded to the need for cheaper, broader storage. Object storage and Hadoop made it practical to retain raw files, logs, events, and other formats without modeling everything before arrival. The trade-off was complexity. Without ownership, cataloging, quality controls, and lifecycle rules, a lake could become a collection of files that nobody trusted.
The lakehouse emerged as a pragmatic response. Table formats such as Delta Lake, Apache Iceberg, and Apache Hudi add schema management and transactional behavior over open storage, helping one environment support both analytical and machine learning workloads.
The architecture is still converging. Managed warehouses increasingly support semi-structured data and open file formats, while modern lakes adopt warehouse-style transactions, governance, and table management. This history is summarized in an overview of the historical development of data platforms.
The useful conclusion isn't that one architecture won. It's that every platform inherits trade-offs. A team choosing an architecture should ask which constraints matter most: fast governed SQL, inexpensive raw retention, flexible machine learning access, open formats, or operational simplicity.
Warehouses Lakes and Lakehouses Compared
A warehouse, lake, and lakehouse can all support analytics, but they organize the work differently. The best choice depends on your data formats, workloads, governance expectations, and the skills your teams already have.
Dimension | Data Warehouse | Data Lake | Lakehouse |
|---|---|---|---|
Typical formats | Curated structured tables, with growing support for semi-structured data | Raw files, logs, events, structured and unstructured objects | Structured and semi-structured tables on open object storage |
Primary workloads | BI, SQL reporting, governed business analysis | Raw data retention, exploration, data science, diverse processing | BI, analytics, machine learning, and shared data engineering |
Schema approach | Schema is usually defined before or during loading | Schema can be applied later, which increases flexibility | Schema and table controls are added over flexible storage |
Governance model | Often centralized and mature for curated datasets | Can vary widely and requires deliberate cataloging and policy design | Aims to combine open storage with stronger table governance |
Cost profile | Optimized for managed analytical performance, with costs shaped by compute and storage use | Often attractive for broad storage, with additional engineering required for usability | Balances shared storage economics with processing and management needs |
Teams that rely on it | Analysts, BI developers, analytics engineers, finance, and operations | Data engineers, data scientists, researchers, and exploratory users | Cross-functional platform, analytics, engineering, and AI teams |
A warehouse is often the clearest fit when most workloads involve curated tables and fast SQL. It gives analysts a controlled environment, but teams may need additional systems for raw files, specialized processing, or machine learning experimentation.
A lake is useful when the organization needs to retain varied data before knowing every future use. That flexibility comes with responsibility. Cataloging, ownership, schema tracking, and access policies must prevent the environment from becoming an unmanaged archive.
A lakehouse tries to combine the two models. It can provide open storage and broad data access while adding stronger table semantics, transaction handling, and governance. That doesn't remove complexity, though. Teams still need to understand file layouts, compute choices, table maintenance, permissions, and workload isolation.
The distinction between a lake and a more focused data mart is explored in this comparison of data lakes and data marts. The decision should follow workload reality rather than fashion. A hybrid platform may be sensible when finance needs governed warehouse reporting, data science needs raw event access, and operations needs low-latency data from a specialized store.
Why Observability Belongs Inside the Platform
Observability belongs beside ingestion, storage, compute, and governance because every layer can introduce a failure that looks correct from the outside. A green pipeline status doesn't prove that the data is fresh, complete, structurally compatible, or meaningful to its consumers.
Data observability is the continuous monitoring of pipelines, tables, jobs, and consumption patterns. It looks for freshness changes, schema drift, volume anomalies, failed transformations, and runtime shifts rather than relying only on whether a scheduled task succeeded. Enterprise guidance on data observability describes this broader operational scope.
The failures teams don't see in time
Schema drift is a common silent failure. A source system may add a column, remove a field, or change a data type without warning. A downstream model might fail immediately, or it might continue while producing incomplete or misleading results. Schema monitoring research identifies these structural changes as signals observability systems should track over time.
Freshness creates another risk. A dataset can be valid in structure and still be unusable because its latest delivery arrived late. Teams compare actual arrival with expected schedules or service-level expectations to detect delays before stale data reaches dashboards and operational reports, a distinction outlined by digna's timeliness guidance.
Duplicates, unexpected volume shifts, and changing distributions can create a different class of incident. A revenue table may load successfully while containing repeated records, and an ML feature may technically exist while reflecting an outdated population.
Quality and observability answer different questions
Quality checks validate known rules. For example, a record-level test may require an identifier to exist or a value to fall within an accepted range. Observability detects unexpected behavior, traces impact across lineage, and helps diagnose changes that predefined rules didn't anticipate.
Practical rule: Use deterministic validation for rules you already understand, and observability for changes you didn't know to expect.
The two approaches work together. A unified data quality and observability strategy explains why enterprises combine validation with anomaly detection, lineage, and schema tracking.
Making observability part of the platform changes ownership. Data engineers receive alerts with source and downstream context, analytics engineers can see whether a model is affected, and governance teams gain evidence about data behavior. Instead of discovering a problem through a broken dashboard, teams can investigate the ingestion or schema boundary where the change began. Data observability practices provide a useful framework for evaluating that capability.
Data Platforms in Practice Across Industries
The architecture becomes clearer when the same layers solve different operational problems.
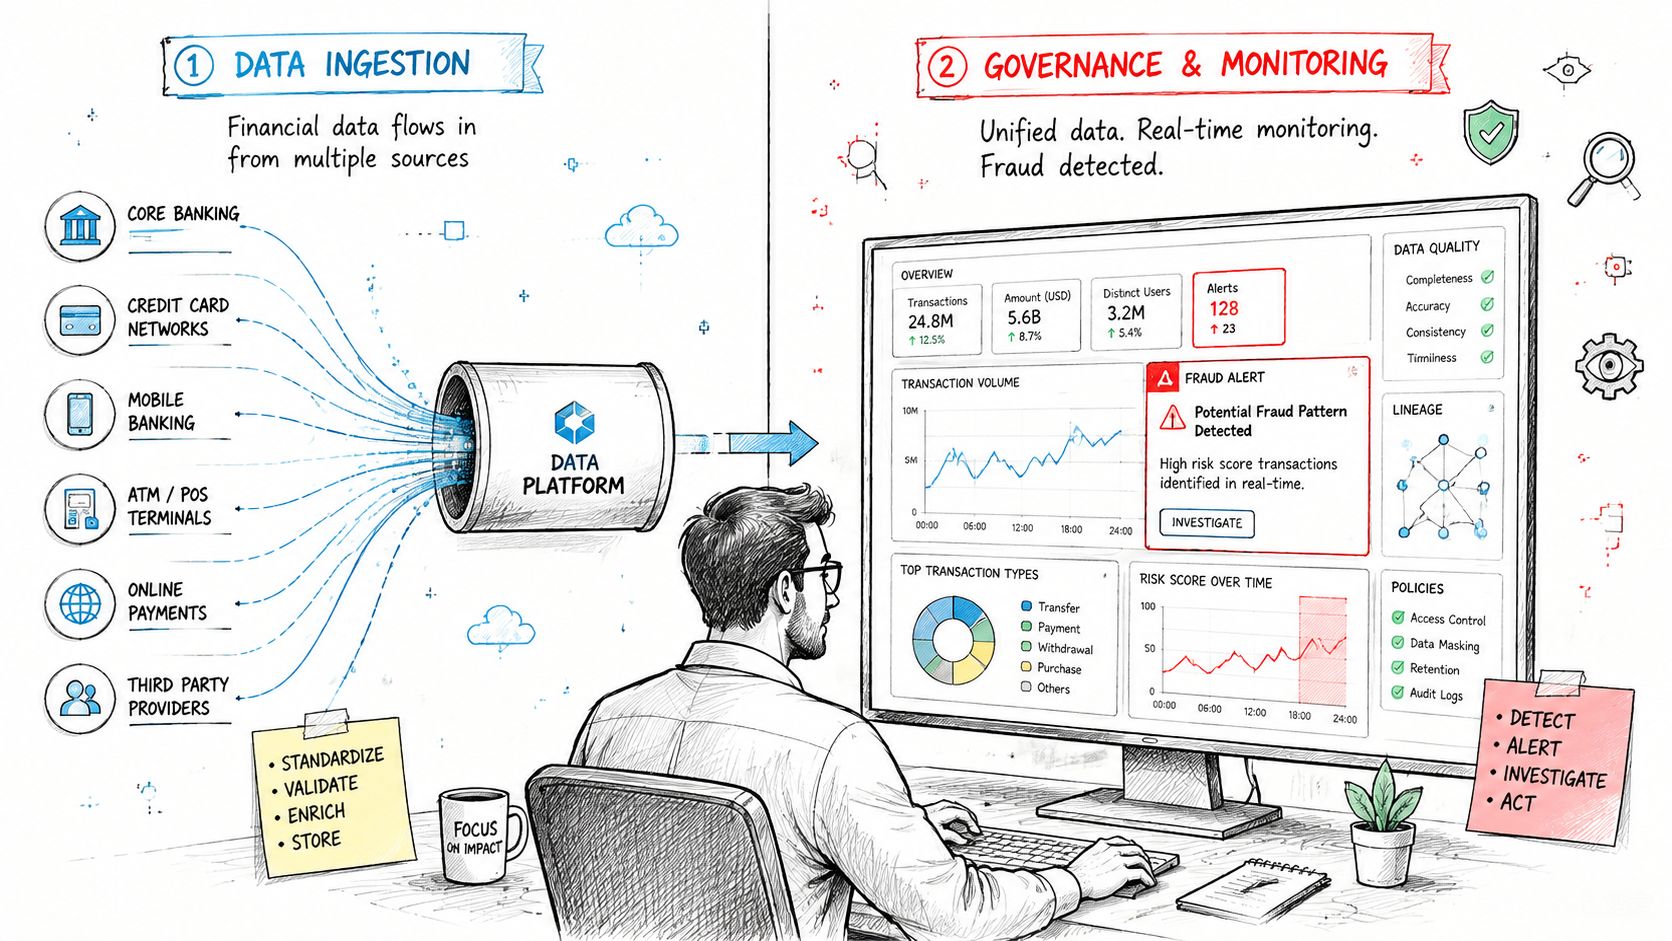
A retail bank may ingest transaction events, customer records, and device signals into a platform that supports near-real-time fraud analysis. The ingestion layer must handle timely events, compute must compare current behavior with relevant patterns, governance must restrict sensitive financial data, and observability must identify missing deliveries or structural changes before fraud workflows consume defective inputs. The trade-off is operational complexity in exchange for faster detection and more controlled use of sensitive information.
A hospital network faces a different combination of constraints. Clinical records, claims data, operational systems, and device data may need to be brought together, but access cannot be uniform. Governance determines which roles may see which datasets, lineage helps users understand how a report was produced, and validation helps enforce rules on critical records. The organization accepts more control overhead because traceability and restricted access matter as much as analytical convenience.
Telecommunications teams often need both customer and network perspectives. A lakehouse can provide a common foundation for churn dashboards and network anomaly models, while separate compute patterns serve SQL users and machine learning teams. Observability helps platform engineers distinguish a genuine change in customer behavior from a broken pipeline or incomplete feed.
Public-sector organizations may share data across agencies while retaining residency, access, and audit requirements. A modular platform can centralize cataloging and policy definitions while allowing different departments to maintain ownership of their datasets. The accepted trade-off is that cross-agency access requires more formal controls than an informal file exchange, but the result is more reproducible analysis and clearer accountability.
These examples don't point to one universal architecture. They show why platform design must start with the consequences of failure. A delayed telecom feed, an exposed clinical field, an unexplained banking metric, and an incomplete public-sector dataset all require different controls, even when the underlying layers look similar.
A Practical Checklist for Evaluating Your Platform
Use the following questions to evaluate your current stack. A “no” doesn't automatically mean the architecture is wrong. It identifies a boundary where integration, ownership, or visibility may be weak.
Ingestion and storage
Source coverage: Can the platform accept both batch and streaming inputs without creating a bespoke operating model for every source?
Data placement: Do you know which datasets belong in curated warehouse tables, flexible lake storage, or lakehouse tables?
Lifecycle control: Can owners identify retention, access, and freshness expectations for important datasets?
Compute and modeling
Shared foundation: Can SQL analytics, transformation workflows, and machine learning workloads use governed data without unnecessary copies?
Reproducibility: Can analysts trace a metric from its semantic definition through transformations to the source data?
Workload fit: Does the compute layer support the latency, scale, and processing patterns your teams need?
Governance and access
Permission clarity: Can the platform enforce role-based or attribute-based access rather than relying on informal agreements?
Lineage and cataloging: Can a user discover what a dataset means, who owns it, and which downstream products depend on it?
Auditability: Can your team reconstruct who accessed sensitive data and how a reported number was produced?
Observability and reliability
Freshness visibility: Will the team know when a delivery is late or missing before a dashboard user reports the problem?
Structural protection: Can the platform detect added columns, removed fields, and data type changes?
Behavioral signals: Can it surface anomalies in volume, values, business metrics, pipeline execution, and platform consumption?
A mature platform doesn't need to come from one vendor. It does need enough integration that one team can answer “where did this number come from?” without conducting a six-tool investigation. The data reliability checklist for data teams can help turn these questions into a more formal assessment.
digna provides an enterprise data quality and observability platform that runs inside the customer's own environment, with in-database checks for anomalies, timeliness, validation, and schema changes across warehouses, lakes, and pipelines. Visit digna to see how its modular monitoring approach can fit into a governed data platform.
Frequently asked questions
What is a data platform?
The integrated set of tools and infrastructure an organization uses to ingest, store, process, govern and serve data for analytics and AI. The important implication is that a data platform is not necessarily one product, and it is not just a database.
What are the core layers?
Ingest, storage, compute, governance and observability, which map onto a restaurant: ingest is the loading dock, storage is the pantry and walk-in cooler, and compute is the kitchen. Each layer carries its own cost, access speed, retention and governance consequences.
Which five questions reveal whether you have one?
Can data arrive reliably? Where does it live? How is it prepared? What does the data mean, and who may use it? How do teams know the system is healthy? A stack that cannot answer the last two is a collection of tools rather than a platform.
How is a data platform different from a database?
A database may store data without managing its complete lifecycle. Enterprise architecture guidance describes a platform as software that helps users store, access, manage and govern enterprise data across both the data plane and the data control plane, which is the part a database alone does not provide.
How big is the data platform market?
It was estimated at USD 82.4 billion in 2024 and is projected to exceed USD 210 billion by 2031, a 14.5% compound annual growth rate over that forecast period. The growth reflects consolidation of separate tools into governed platforms rather than simply more storage.


