What Is Data Reasonableness? a Practical Guide
|
7
minute de lecture
Data reasonableness assesses whether data makes sense within its expected business, logical, statistical, or contextual conditions. Valid data follows a defined rule. Reasonable data behaves in a way that makes sense in context.
A record can pass a type check, fit a permitted range, and still look wrong to anyone who understands the business. An accepted patient age of 187, a transaction of €500,000 when typical transactions are below €500, or a sudden 400% increase in daily customer registrations may not prove an error, but each deserves investigation. That gap between passing validation and making sense is where reasonableness data quality becomes essential.
Table of Contents
What Is Data Reasonableness and Why Does It Matter
Why deterministic rules aren't enough
How Reasonableness Differs From Validity Accuracy and Consistency
Reasonableness versus validity
Reasonableness versus accuracy
Reasonableness versus consistency
Real-World Examples of Unreasonable Data
How Organizations Measure Data Reasonableness
Start with known expectations
Add baselines and peer comparisons
Use statistical and cross-system analysis
Why Reasonableness Is Critical for Analytics and AI
How digna Supports Continuous Reasonableness Monitoring
Frequently Asked Questions About Data Reasonableness
What is Data Reasonableness?
What is Reasonableness in Data Quality?
What is an example of unreasonable data?
How do you measure Reasonableness?
What is the difference between Reasonableness and Validity?
Can data be valid but unreasonable?
Can unreasonable data still be accurate?
How can Reasonableness be monitored continuously?
Which digna module supports Data Reasonableness?
What Is Data Reasonableness and Why Does It Matter
A hospital billing system may accept a patient age of 150 because the field is numeric and the configured range allows it. The record is structurally valid, but a clinician, billing specialist, or data steward would immediately question whether the value represents a typing mistake, a shifted column, or an unusual but genuine record.
Data reasonableness evaluates whether a value behaves plausibly within its expected conditions. Those conditions may be business rules, logical relationships, statistical patterns, historical behaviour, peer-group norms, or domain knowledge. The question isn't, “Can this value exist in the field?” It's, “Does this value make sense here?”
Practical rule: A reasonableness flag is a request for investigation, not automatic proof that the record is wrong.
This distinction has a long foundation in official statistics. Statistics Canada describes quality through six dimensions, relevance, accuracy, timeliness, accessibility, interpretability, and coherence, and connects quality with “fitness for use” rather than correctness alone. The Statistics Canada quality guidelines show why a dataset can be present and technically correct yet still fail its intended purpose if it arrives late, loses comparability, or violates expected relationships.
Why deterministic rules aren't enough
A deterministic rule can test whether a field contains a number, whether a date uses the right format, or whether an amount stays below a configured ceiling. It can't automatically understand every legitimate business context.
Reasonableness adds that contextual layer through:
Historical baselines, which reveal whether today's values resemble prior behaviour.
Peer comparisons, which compare a branch, product, customer, or region with similar groups.
Cross-field relationships, such as whether delivery follows dispatch.
Statistical profiling, which highlights distribution shifts and unusual concentrations.
Domain review, which helps distinguish rare events from corrupted data.
The historical development of statistical quality control also supports this approach. A National Academies review of data quality and survey error traces modern quality practice through measurement control, collection-process control, sampling, and error analysis. Reasonableness is the enterprise continuation of that discipline, applied to warehouses, lakes, pipelines, dashboards, and models.
The practical consequence is clear. Reasonableness provides a late but important safeguard before suspicious data influences analytics, financial reporting, operational decisions, or automated systems. Teams looking to connect these checks with broader pipeline monitoring can place them within a data observability approach.
How Reasonableness Differs From Validity Accuracy and Consistency
Reasonableness is related to other data quality dimensions, but it doesn't replace them. Validity checks explicit rules, accuracy checks correspondence with reality, and consistency checks agreement between representations. Reasonableness asks whether the result is plausible in context.
A shipping weight of 9,999 kg for a laptop might fit a numeric field and a generous technical maximum. A real retail transaction timestamped at 3:00 AM may accurately reflect what the source system recorded, even if the store closes at 9:00 PM. If every employee logs exactly 8.00 hours every day for a year, the records may agree perfectly across systems while still suggesting a process or entry pattern worth examining.
A useful comparison looks like this:
Dimension | What It Checks | Example Rule | Passes? | Reasonableness Verdict |
|---|---|---|---|---|
Validity | Whether a value follows an explicit rule | Amount is numeric and below the permitted maximum | Yes | May still be implausible |
Accuracy | Whether a value reflects reality | Recorded address matches the customer's verified address | Yes | Accurate data can still be unusual |
Consistency | Whether representations agree | Customer status matches across two systems | Yes | Agreement doesn't prove contextual sense |
Reasonableness | Whether behaviour fits expected context | Purchase aligns with customer, product, time, and history | Requires context | Flags values for investigation |
Reasonableness versus validity
Validity asks, “Does the value satisfy a defined rule?” A transaction amount of €900,000 may be valid if the technical maximum is higher, but it may be unreasonable when normal transactions are below €5,000.
This is why a data quality guide is useful for establishing the broader vocabulary, while teams still need a separate contextual assessment. You can also distinguish reasonableness from data validity and how to measure it when designing controls.
Reasonableness versus accuracy
Accuracy asks whether the value reflects reality. Reasonableness asks whether the value appears plausible given the available context. An unusual value may be completely accurate, such as a genuine high-value purchase, an emergency admission, or an employee working an exceptional shift.
Rejecting every outlier would remove valid rare events. A better design flags the observation, preserves the source value, records the reason for concern, and sends it to an appropriate workflow.
Reasonableness versus consistency
Consistency focuses on agreement between data representations or systems. Reasonableness focuses on expected behaviour. A value can be consistent across every downstream table and still be unreasonable because the original value violates a business pattern that no system-to-system comparison tests.
Real-World Examples of Unreasonable Data
Unreasonable data appears in every domain because systems usually know the permitted structure better than the surrounding business context. A financial system can accept a correctly formatted amount without understanding the merchant category, while a healthcare system can store a dosage without assessing whether it fits the patient's profile.
In finance, a credit card transaction for $0.01 at a luxury car dealership might pass formatting, currency, and minimum-value checks. It could be a test charge, a deposit, a settlement artefact, or a suspicious transaction. The flag should prompt review, not prove fraud.
In healthcare, a pediatric dosage assigned to a patient recorded as 72 years old creates a serious contextual conflict. The age, dosage, and medication may each be valid fields, but their relationship requires immediate clinical or data-quality investigation.
In supply chain, a warehouse reporting zero inventory shrinkage for twelve consecutive months may be possible, but the uninterrupted pattern is unusual enough to examine. In HR, an employee start date occurring three years before the recorded date of birth indicates a cross-field anomaly that a simple date-format check won't catch.
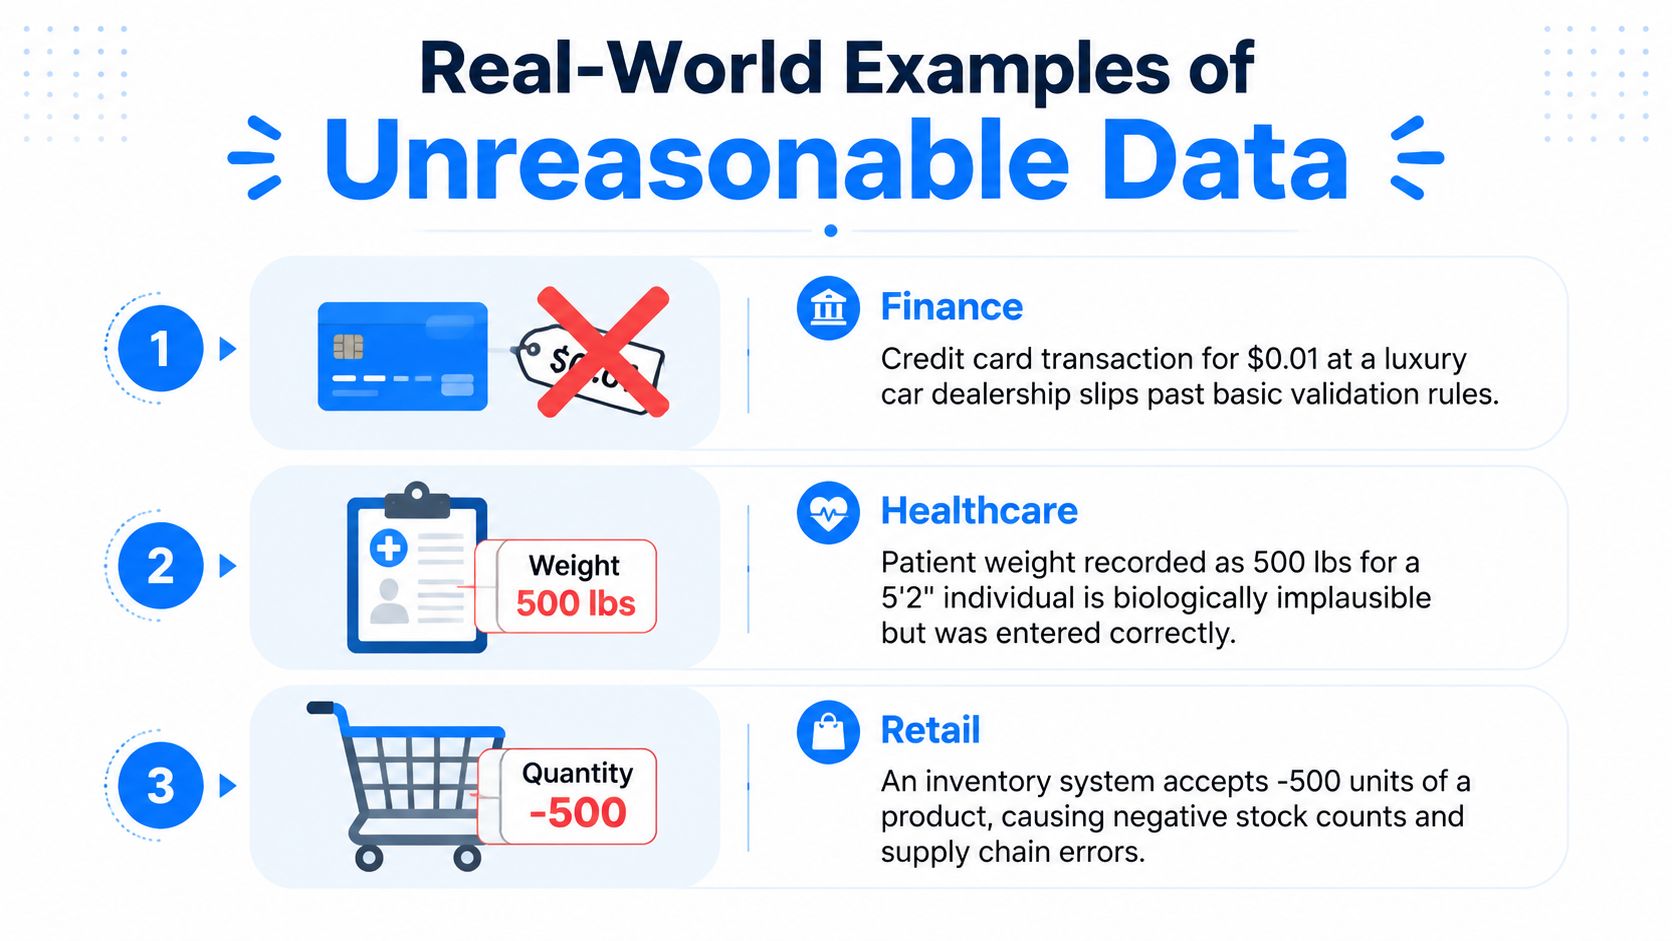
The supplied examples also illustrate an important operating principle: an unusual record isn't automatically incorrect. A patient weight that seems biologically implausible could reflect a unit conversion issue, a genuine measurement, or an entry attached to the wrong patient. A negative inventory quantity could represent an adjustment rather than a failed transaction.
Reasonableness supports data quality issue investigation by separating detection from disposition. The system identifies behaviour that deserves attention, while a human or domain workflow determines whether to correct, approve, quarantine, or document it.
How Organizations Measure Data Reasonableness
Organizations measure reasonableness by combining explicit business knowledge with observed data behaviour. There is no single universal reasonableness metric. The right method depends on the field, the population, the decision, and the cost of missing an anomaly.
Start with known expectations
Business rules and thresholds are the clearest starting point. A team might flag an age of 187, a product price outside its category boundaries, or a transaction amount above an approved ceiling. Ratios add context, such as claims per policy, returns per order, or revenue per active customer.
These controls work well when the expected condition is known. They become weaker when behaviour changes by season, customer segment, location, or product type.
Add baselines and peer comparisons
Historical baselines compare current behaviour with prior observations. Teams can examine changes in volume, average, median, percentile, distribution, or the proportion of values outside an expected range. A sudden increase in registrations, a new concentration of unusually large orders, or a shift in customer activity can indicate a pipeline defect or a genuine business event.
Peer-group comparisons reduce false alarms. A large transaction may be ordinary for an enterprise customer and unusual for an individual customer. A regional sales change should be interpreted alongside comparable regions, not against one universal threshold.
Use statistical and cross-system analysis
Distribution analysis can reveal changes that individual record rules miss. Teams may monitor outliers, compare distributions over time, and investigate changes in spread or central tendency. Anomaly detection extends this process by learning expected patterns and highlighting deviations.
Cross-field checks add logical context. Shipping dates should follow order dates, patient dosage should align with patient attributes, and a product price should make sense for its category. Cross-system checks can compare operational records with trusted reference data or related internal systems.
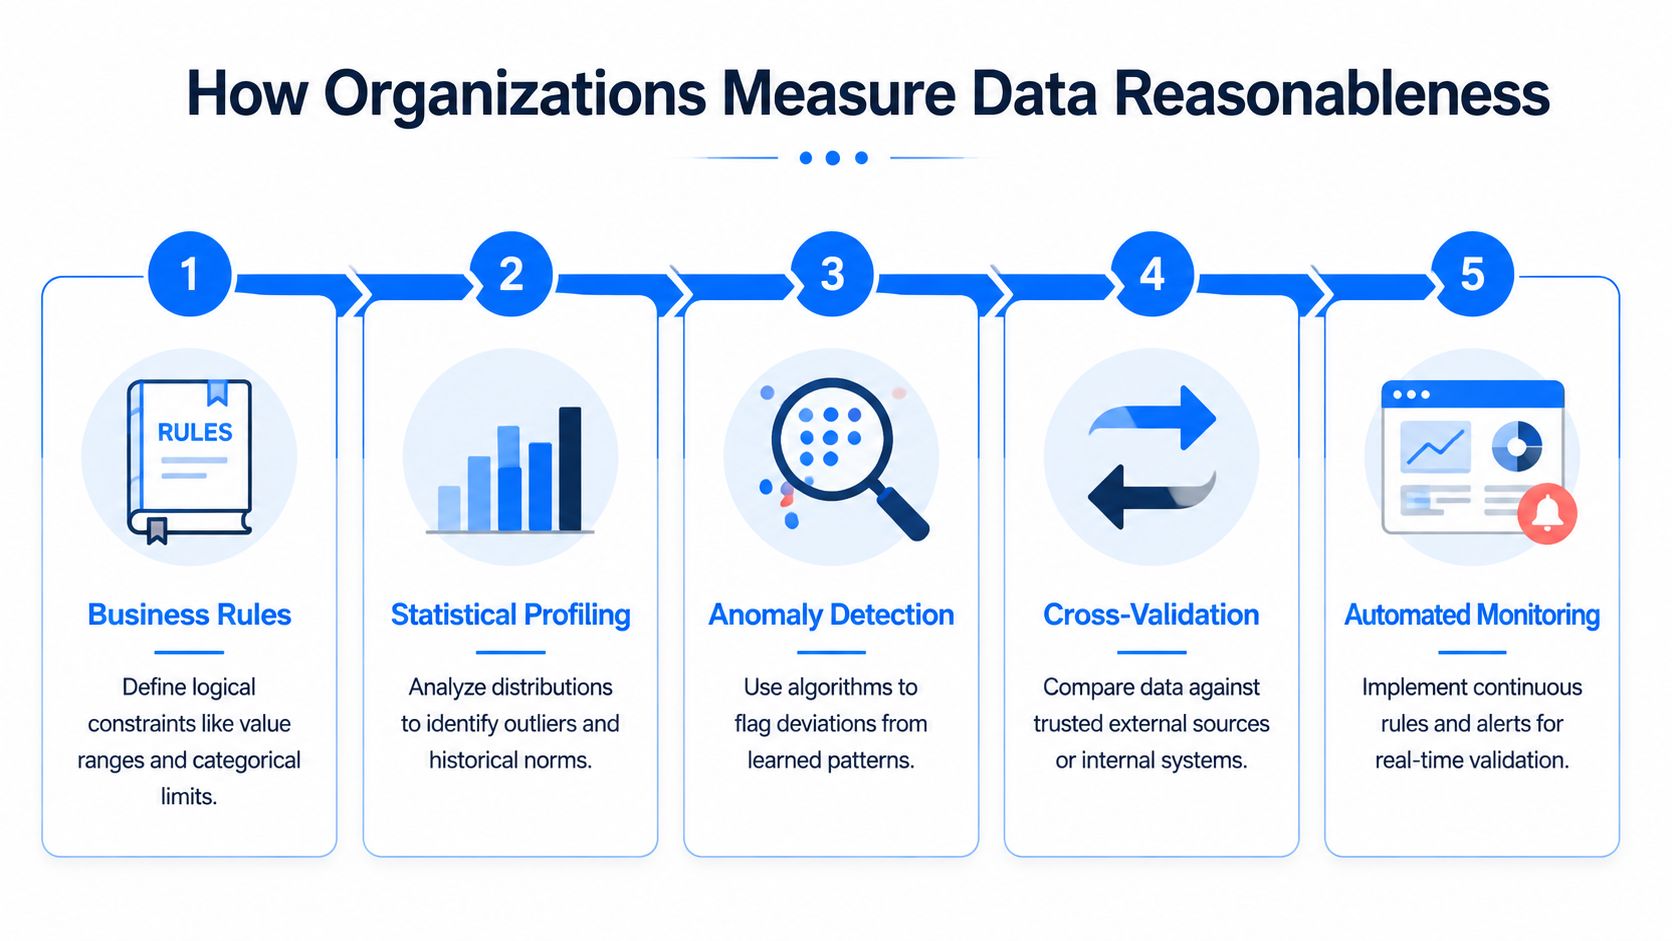
A practical measurement program can track the percentage of values outside expected ranges, the percentage of records flagged for investigation, deviation from a historical baseline, distribution changes, and volume shifts. These measures describe signals, not verdicts. A data quality framework for CDOs can help connect those signals with ownership, governance, and decision risk, while data quality metrics provide a place to formalize the monitoring model.
The revised DAMA-DMBOK® 2.0 Revised Edition treats Reasonableness as a standard data quality dimension. DAMA explains that its revised framework contains 9 dimensions, adds Currency, and uses Reasonableness in place of the earlier term Reasonability. That positioning reinforces the need to monitor reasonableness separately from accuracy, validity, and consistency.
Why Reasonableness Is Critical for Analytics and AI
Unreasonable data can distort analytics without triggering a conventional validation failure. A large transaction can inflate revenue dashboards, a duplicated registration spike can change a growth KPI, and an incorrect unit can shift operational averages. Executives may then act on a report that is technically populated but contextually misleading.
AI and machine learning systems face the same problem at scale. A record can look statistically ordinary in isolation while contradicting the business situation it represents. A high-value grocery order labelled as routine purchasing behaviour may influence segmentation, forecasting, fraud detection, or recommendation logic without producing an obvious schema or type error.
Reasonableness is the layer that asks whether the data remains defensible for the decision it will influence.
Risk and fraud teams rely on contextual signals because suspicious behaviour often hides inside permitted values. A claim can fall below a formal limit but differ sharply from a claimant's history. A location can use a valid coordinate format while implying an implausible movement pattern. A synthetic identity can contain complete, consistent fields while combining relationships that don't fit normal customer behaviour.
Organizations also need to explain why automated decisions relied on particular data. A dataset used for a model, regulatory report, or risk assessment needs more than structural validity. Teams should be able to show what they monitored, which patterns triggered review, who assessed the exception, and whether the value was retained as a legitimate outlier or corrected as a defect. The AI data quality perspective is therefore practical, not merely technical.
Research on AI readiness highlights the scale of the challenge. A global survey found that only 12% of respondents considered their data sufficiently high-quality and accessible for AI, while 64% identified data quality as their top data-integrity challenge and 77% rated quality as average or worse, as reported by Precisely's 2025 planning insights. Reasonableness contributes to AI fitness, but it can't solve inaccessible, poorly governed, or inconsistently defined data by itself.
How digna Supports Continuous Reasonableness Monitoring
Continuous monitoring treats reasonableness as an operating signal rather than a periodic audit. digna Data Anomalies is the primary capability for identifying unexpected changes in distributions, sudden spikes or drops, unusual values, changes in historical behaviour, and deviations from established patterns.
Consider a financial transaction workflow. The business defines a valid transaction amount as between €0 and €1 million. A transaction of €800,000 passes that rule, but the same customer's historical transactions normally fall between €50 and €500.
The modules serve different purposes:
Data Validation confirms that the amount satisfies the explicit technical and business rule.
Data Anomalies flags the amount because it differs from the customer's established behaviour.
Data Analytics supplies historical trends and context for the investigator.
A user or workflow determines whether the transaction is legitimate, requires escalation, or reflects a data problem.
Validation checks what you've explicitly defined. Anomaly detection can identify behaviour you didn't explicitly anticipate.
digna Data Analytics supports historical analysis, baseline review, trend analysis, volatility assessment, and investigation. digna Data Validation handles explicit reasonableness conditions, including ranges, domains, cross-field relationships, and known business constraints. Together, these capabilities support both deterministic and behavioural controls without treating every unusual value as an error.
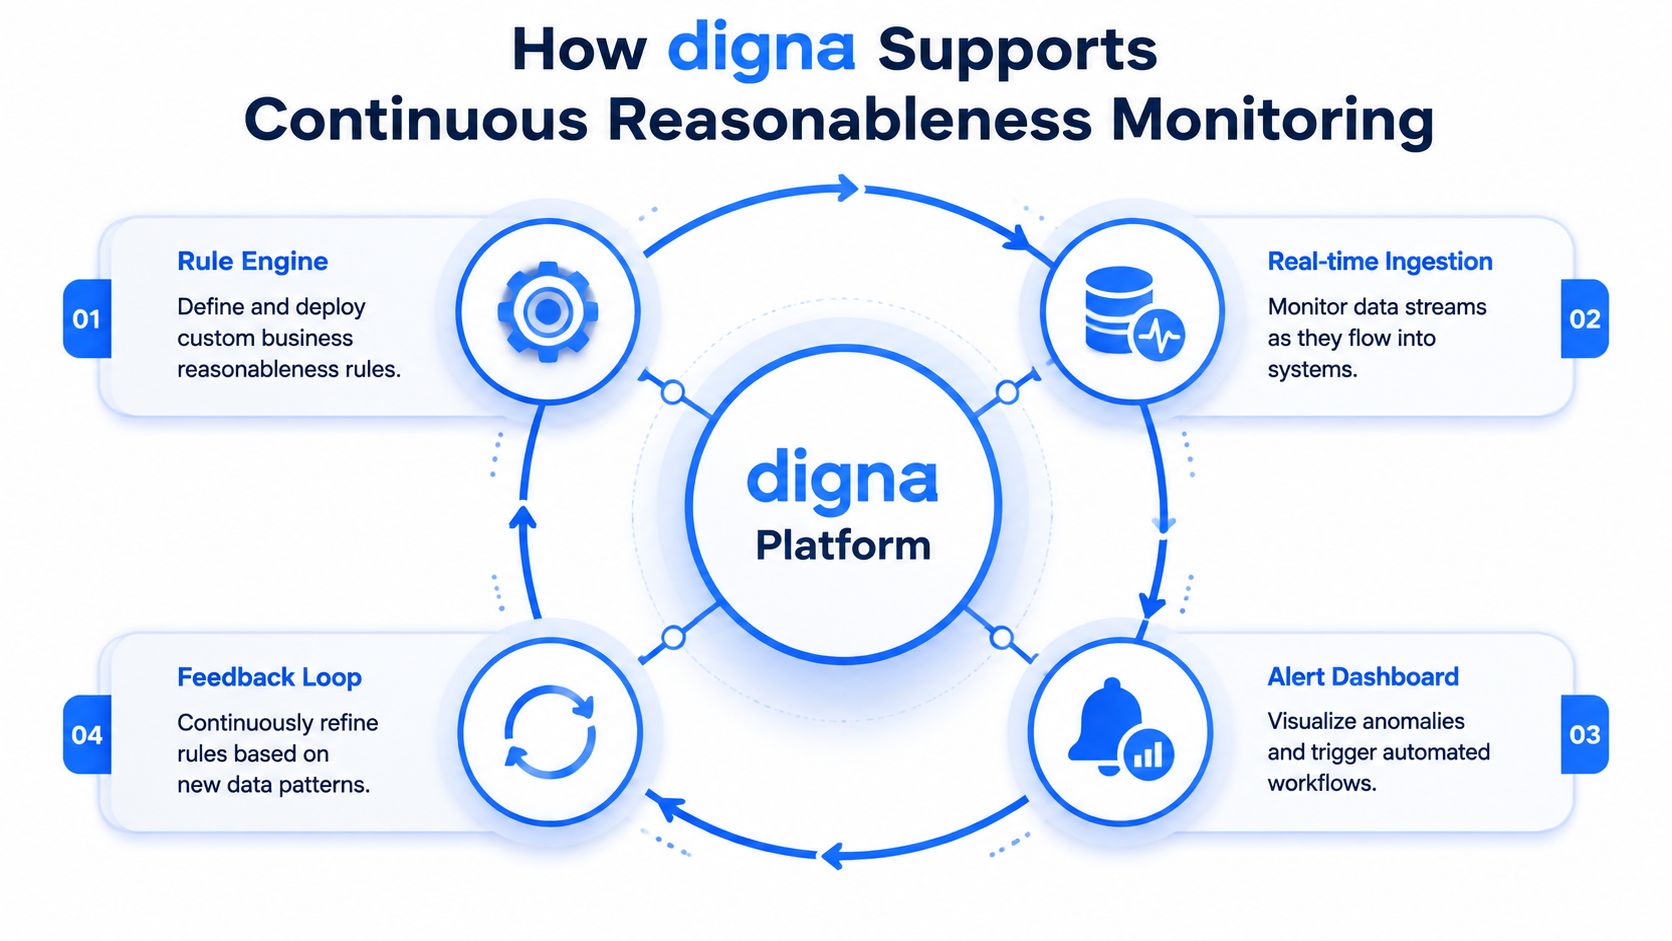
The platform performs metric computation and analysis within the customer's databases, so organizations can keep data in place. Deployment can use a private cloud or an on-premises installation inside the customer's cloud, VPC, or data center. That architecture matters when financial, healthcare, public-sector, or other sensitive records must remain within controlled infrastructure.
A continuous workflow should also learn from decisions. When investigators confirm that an unusual pattern is legitimate, teams can refine thresholds, peer groups, or review logic. When they confirm a defect, the organization can trace the issue upstream and add a targeted rule. This feedback prevents reasonableness monitoring from becoming a noisy alert stream.
Frequently Asked Questions About Data Reasonableness
What is Data Reasonableness?
Data reasonableness assesses whether data makes sense within its expected business, logical, statistical, or contextual conditions.
What is Reasonableness in Data Quality?
It is a distinct data quality dimension that evaluates plausibility and expected behaviour, not just format or correctness.
What is an example of unreasonable data?
An amount that passes a technical range but is dramatically different from a customer's normal transaction pattern is an example.
How do you measure Reasonableness?
Use business rules, thresholds, ratios, expected ranges, historical baselines, peer comparisons, distribution analysis, trend analysis, and anomaly detection.
What is the difference between Reasonableness and Validity?
Validity checks an explicit rule. Reasonableness checks whether the value makes sense in context.
Can data be valid but unreasonable?
Yes. A value can satisfy its format and range rules while contradicting normal business behaviour.
Can unreasonable data still be accurate?
Yes. A rare or unusual value may accurately represent reality, so it should often be investigated rather than rejected automatically.
How can Reasonableness be monitored continuously?
Combine deterministic validation with automated anomaly detection, baseline monitoring, alerts, and human review workflows.
Which digna module supports Data Reasonableness?
digna Data Anomalies is the primary capability, supported by Data Analytics for context and Data Validation for explicit rules.
digna provides modular anomaly detection, historical analytics, and record-level validation for monitoring whether enterprise data behaves as expected. Visit digna to explore how continuous reasonableness monitoring can support more reliable analytics and AI.