Data Reasonableness: How to Detect Data That Looks Wrong but Passes Your Rules
|
8
minute de lecture

Data can pass every validation rule and still be unreasonable.
That's the operational gap behind many failed dashboards, misleading reports, and unreliable AI inputs. Traditional data validation checks explicitly defined conditions, such as data types, required fields, permitted values, and maximum thresholds. Data reasonableness asks a different question: does the data behave as expected in its business context?
A transaction can contain a valid currency, a valid timestamp, and an amount below the configured limit, yet still represent a serious data problem. A delayed file can be complete when it finally arrives, but unusable for a decision that depended on it earlier. A schema can remain technically readable while a subtle structural change alters the meaning of downstream metrics.
The financial exposure is substantial. The widely cited benchmark is that poor data quality costs organizations about $12.9 million per year on average, while IBM reported in 2026 that more than a quarter of organizations lose over $5 million annually, and 7% lose $25 million or more because of poor data quality. IBM also reported that 43% of chief operations officers identified data quality as their most significant data priority, showing that this is an operational risk, not merely an analytics inconvenience. See IBM's analysis of the cost of poor data quality for the broader business context.
Table of Contents
When Valid Data Looks Wrong
Rules are useful because they turn known expectations into repeatable checks. They catch nulls, malformed identifiers, invalid dates, duplicate keys, and values outside an approved domain. But they only catch what someone has already described.
Reasonableness monitoring covers the gap between technical validity and contextual fitness. A value may satisfy a rule while contradicting the historical behavior, distribution, timing, or relationships that make the dataset useful. That's why a clean validation report doesn't necessarily mean the data is safe for finance, operations, regulatory reporting, or machine learning.
A practical distinction helps:
Validity: The record conforms to an explicit structural or business rule.
Quality: The record is accurate, complete, consistent, timely, unique, and fit for its intended use.
Reasonableness: The value or behavior makes sense in context.
Anomaly detection: The current observation differs materially from learned or expected behavior.
The difference between data validity and broader data quality matters because teams often treat a passed rule as evidence that no further investigation is needed. In production, that assumption fails when the issue is gradual drift, a delayed arrival, a distribution change, or a multivariate pattern that no single field-level rule can express.
Practical rule: A passed validation rule means “this known condition wasn't violated.” It doesn't mean “nothing unusual happened.”
Reasonableness therefore isn't a replacement for validation. It's a second layer that tests behavior, context, and change. Traditional validation checks what you already know to look for. Reasonableness monitoring can reveal behavior you didn't know to expect.
What Makes Data Unreasonable
Unreasonable data is data that appears technically acceptable but conflicts with the patterns, relationships, timing, or business context expected for its use. The word “unreasonable” doesn't mean “false.” It means the observation deserves attention because its behavior is difficult to explain using the available context.
Consider a transaction amount inside a permitted range but dramatically higher than the customer's normal activity. A rule may accept every value from €0 to €1 million, while the customer's established pattern makes one unusually large transaction worth investigating. The same issue appears in volume monitoring. A 500% increase in daily orders might reflect a successful campaign, a genuine seasonal event, duplicated ingestion, or a broken join. The number is a signal, not a verdict.
Other examples include:
A customer age that falls within a technically valid human range but is highly unusual for the segment.
A sudden shift in a product-price distribution, even though every individual price remains within its allowed bounds.
A regional sales value that differs completely from historical patterns while still passing type, null, and range checks.
A recurring late delivery that leaves the table complete but causes downstream users to make decisions with stale data.
A relationship between fields that changes, such as quantities and totals no longer moving together as they historically did.

Reasonableness is multidimensional
Data quality teams commonly work across dimensions including accuracy, completeness, consistency, timeliness, validity, and uniqueness. A record can be valid but untimely, complete but inconsistent, or structurally correct but inaccurate. Reasonableness monitoring helps expose those combinations by examining how the dataset behaves instead of inspecting fields in isolation.
Anomaly detection is especially useful for outlier identification, but an outlier shouldn't be automatically deleted or rejected. A promotion, acquisition, outage, or market event can create a legitimate anomaly. The correct response is to attach context, assess impact, and decide whether the observation represents a real change or a data defect. Practical guidance on outlier identification methods reinforces that distinction.
Why Rule-Based Validation Falls Short
Take a common rule:
Transaction amount must be between €0 and €1 million.
Under that rule, €500, €50,000, and €900,000 all pass. The rule does exactly what it was designed to do, and that's valuable. It prevents values outside the accepted domain from entering downstream processes.
But suppose a customer's historical transactions normally fall between €50 and €500. A €900,000 transaction may be legitimate, yet it's sufficiently different from that customer's established behavior to require review. The static rule can't make that judgment because it has no representation of customer-specific history.
Where explicit rules work
Rule-based validation remains the right tool when the expectation is known and stable:
A required identifier must not be null.
A date must use an accepted format.
A status must belong to an approved set.
A transaction amount must not exceed a contractual limit.
A record must satisfy a documented relationship between fields.
These checks are transparent, easy to audit, and useful for enforcing deterministic controls. They also produce actionable failures when the business condition is explicit.
Where rules become expensive
Problems start when teams try to encode every possible business expectation manually. They add rules for each region, product, customer type, seasonal pattern, exception, and operating state. The result is a growing maintenance burden, frequent threshold changes, and a monitoring system that still misses patterns nobody thought to define.
Statistical approaches solve a different problem. BigQuery's ML.TFDV_VALIDATE, for example, compares training and serving statistics to identify anomalous differences between datasets, illustrating that validation and anomaly detection are distinct control layers. The data validation rules and continuous data quality perspective is useful here: deterministic checks enforce known conditions, while statistical monitoring searches for unexpected changes.
A strong production design doesn't choose one approach. It uses explicit validation for known constraints and anomaly detection for behavior that must be learned from evidence.
How Organizations Detect Unreasonable Data
Organizations usually assess reasonableness by combining several forms of expected behavior. No single threshold works across every dataset, so the monitoring design should reflect the grain, seasonality, latency, and business importance of each metric.
Expected ranges
Start with ranges where the business expectation is clear. A price, age, quantity, or balance may have a defensible lower and upper bound. These checks are simple and explainable, but they won't detect an unusual value that remains inside the range.
Historical baselines
A baseline describes normal behavior using historical observations. A practical workflow collects representative baseline data, derives a statistical description, and continuously tests new data against it. A changepoint detected by the test statistics can then be treated as an anomaly, as described in this baseline-driven anomaly detection guide.
Baselines should be segmented when context changes the expected pattern. Daily order volume may need separate behavior for weekdays and weekends. Customer spending may need comparison within customer segments rather than across the entire population.
Statistical distributions
Averages alone can hide important changes. Monitor the distribution of prices, quantities, balances, or categorical values. A stable mean can coexist with a sharp shift in spread, a new concentration around one value, or the sudden disappearance of a category.
Practical detectors define an acceptable range from normal behavior. A common starting point for z-score anomaly detection is 3, representing roughly three standard deviations from the mean under a normal-distribution assumption, as documented in Nokia's baseline detection guidance. That threshold is a starting point, not a universal production setting.
Trends and peer comparisons
Trend checks identify sudden increases, decreases, reversals, or sustained drift. Peer comparisons add context by comparing similar regions, products, entities, or business units. A region may look unusual globally but normal compared with its own seasonal peers.
Finally, add rule-based reasonableness where the business expectation is known but more contextual than a basic validity check. Strong data quality programs combine expected ranges, historical baselines, distributions, trends, peer comparisons, and deterministic rules.
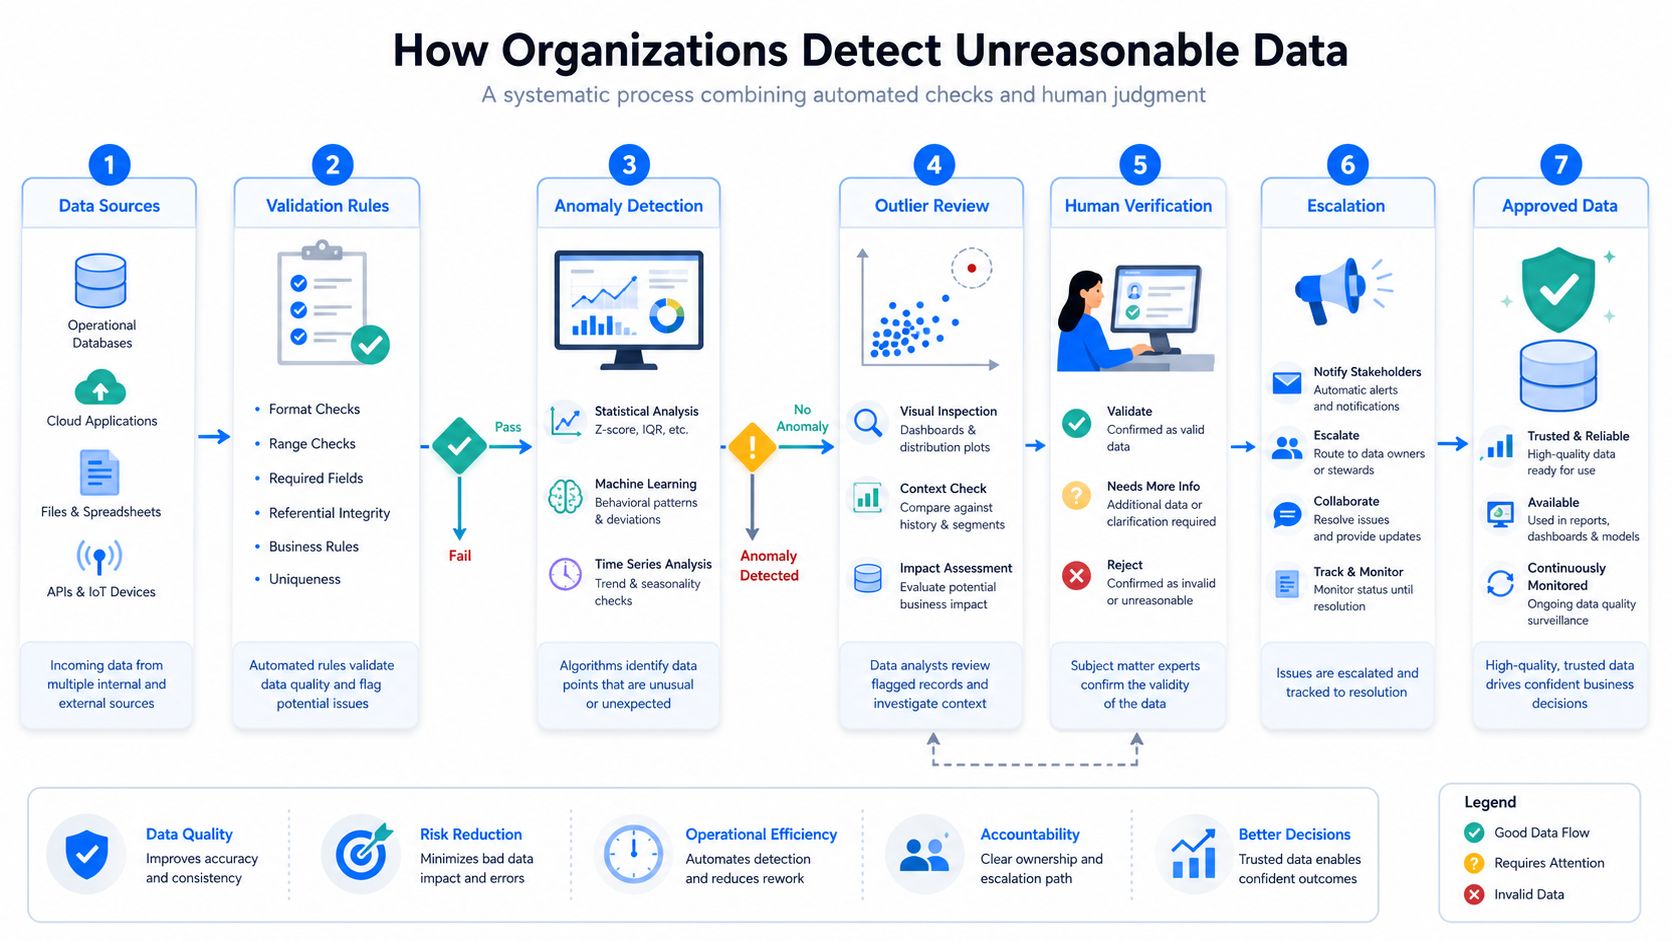
For broader implementation guidance, anomaly detection for early data issues provides a useful operational framing. The important design choice is to tune alerts to consequence. A small shift in a low-impact table may be informational, while a modest change in a regulatory or financial dataset may require immediate escalation.
Validation vs Reasonableness vs Anomaly Detection
A retail business provides a clear example of how the three mechanisms differ. Its daily sales table normally contains around 2 million transactions. One day, the table contains 2.1 million, which may pass a volume rule because the table is present, populated, and within a broad operational limit. Yet the average order value increases by 350%, creating a behavior change that static validation may never inspect.
The response should be layered:
Validation checks the known constraints. It confirms that amounts, dates, identifiers, and required fields meet defined rules.
Reasonableness checks the business context. It asks whether the amount is plausible for the customer, product, region, or sales channel.
Anomaly detection compares current behavior with history. It flags the sudden change in average order value and possibly related distribution shifts.
Historical analytics supplies context. The team checks campaigns, pricing changes, promotions, ingestion behavior, and source-system events.
Investigation determines the outcome. The anomaly may represent real sales activity, duplicated records, a currency issue, or a transformation defect.
Approach | Question | Example |
|---|---|---|
Validation | Does the value satisfy the rule? | Amount ≤ €1m |
Reasonableness rule | Does it satisfy an expected business condition? | Amount within expected customer range |
Anomaly detection | Is behavior unusual compared with history? | 350% increase in average order value |
The distinction resembles other operational monitoring disciplines. Teams exploring predictive maintenance with Forge Reliability will recognize the same principle: a system can remain within a permitted operating range while its behavior shifts enough to justify inspection. In data platforms, that means monitoring the trajectory and relationships, not only the pass or fail state.
This is also why data observability versus data quality shouldn't be treated as a binary choice. Validation provides control over known requirements. Reasonableness provides contextual judgment. Anomaly detection provides adaptive comparison against observed behavior.
How digna Supports Data Reasonableness
digna Data Anomalies addresses the operational gap between manually authored rules and behavior-based monitoring. It uses AI-driven baseline learning and continuous anomaly detection to identify deviations from historical behavior without requiring teams to define every possible condition in advance.
The module can surface unexpected volume changes, distribution shifts, unusual metric values, abrupt changes in historical patterns, and recurring anomalies. That makes it relevant when data remains syntactically valid but changes in a way that could affect reporting, operational decisions, or AI inputs.
digna Data Analytics helps investigators examine the historical context behind an alert. Teams can use historical observability metrics to review trends, volatility, and statistical patterns instead of treating an anomaly as an isolated event. digna Data Validation remains useful when the expected condition can be stated explicitly as a business rule, audit requirement, or record-level control.

The implementation model matters for enterprise teams. digna runs inside the customer's own infrastructure, with metric computation and analysis performed in-database, so production data remains in place. Deployment can use a private cloud or an on-premises environment inside the customer's cloud, VPC, or data center.
The practical value comes from the combination rather than any one module. Anomalies identify unexpected behavior, analytics provides context, validation enforces known conditions, and related monitoring can track timeliness or schema changes that make otherwise valid data unsafe to use.
Monitoring Unreasonable Data Continuously
Continuous monitoring starts with prioritization, not with an attempt to monitor every column equally. Identify datasets whose unreasonable behavior could affect financial reporting, customer decisions, operational control, regulatory work, or AI systems. Then define the behavior worth observing, such as volume, arrival time, distributions, relationships, and business metrics.
A useful operating model has four parts:
Baseline: Learn normal behavior from representative historical data.
Detection: Compare new observations with expected patterns and flag meaningful deviations.
Context: Show the historical trend, affected dimensions, and related metrics.
Action: Route the alert to an owner who can investigate, classify, and document the outcome.
Automation is essential because manual review doesn't scale. A supervisory presentation on data governance reported that 42% of global respondents identified shortages of skills and staff as the biggest barrier to high-quality data. That constraint makes context-aware monitoring more practical than asking already stretched teams to write and maintain rules for every possible scenario. The same principle applies to operational feeds where timeliness matters, including reliable esports data delivery methods, because a complete data payload that arrives late can still fail its business purpose.
An anomaly doesn't mean the data is wrong. It means the current observation differs from expected behavior and needs classification. Teams should record whether the cause was a legitimate business event, a source-system change, a pipeline defect, a duplicated load, a delayed delivery, or an overly sensitive threshold.
The best alert programs also measure alert quality. Suppress known events when appropriate, segment baselines by meaningful context, and prioritize incidents by downstream harm rather than by how often a rule fails. This reduces noise while preserving attention for changes that can mislead decisions.
For organizations preparing data for AI, the readiness gap is significant. Precisely reported that only 12% of organizations considered their data sufficiently high quality and accessible for AI, while 64% named data quality their top data integrity challenge and 49% cited inadequate automation tools as the main blocker. These findings support a clear operating principle: data quality monitoring must test not only whether data is valid, but whether it remains trustworthy for the decision that consumes it.
digna combines Data Anomalies, Data Analytics, Data Validation, timeliness monitoring, and schema tracking to detect data that passes static rules but behaves unexpectedly. Visit digna to see how its in-database platform can help your team monitor unreasonable data continuously and investigate anomalies before they undermine analytics or AI.