8 Data Governance KPIs to Measure in 2026
|
8
min. Lesezeit

Most governance programs don't fail because nobody wrote policies. They fail because teams can't prove those policies change what happens in production. A 2025 enterprise governance benchmark found that 71% of organizations run a formal data-governance program, up from 60% two years earlier (2025 enterprise governance benchmark). Formal adoption is rising, but the same benchmark identified data quality as the leading business pain point at 56%, with governance close behind at 54%. The implication is clear: documenting ownership and publishing standards isn't enough. Leaders need evidence that controls operate, data arrives reliably, incidents are contained, and decisions become safer.
The eight data governance KPIs below form a connected measurement system. Coverage shows where governance exists, enforcement shows whether controls operate, quality and timeliness show the condition of data, and incident, schema, and business metrics show whether governance protects decisions. Each KPI includes calculation logic, implementation choices, and trade-offs.
Before calculating anything, define the asset population, owner, measurement window, criticality level, target threshold, and alert-response expectation. A score without a named owner is a report. A score tied to a remediation path is a control.
Table of Contents
1. Data Quality Score
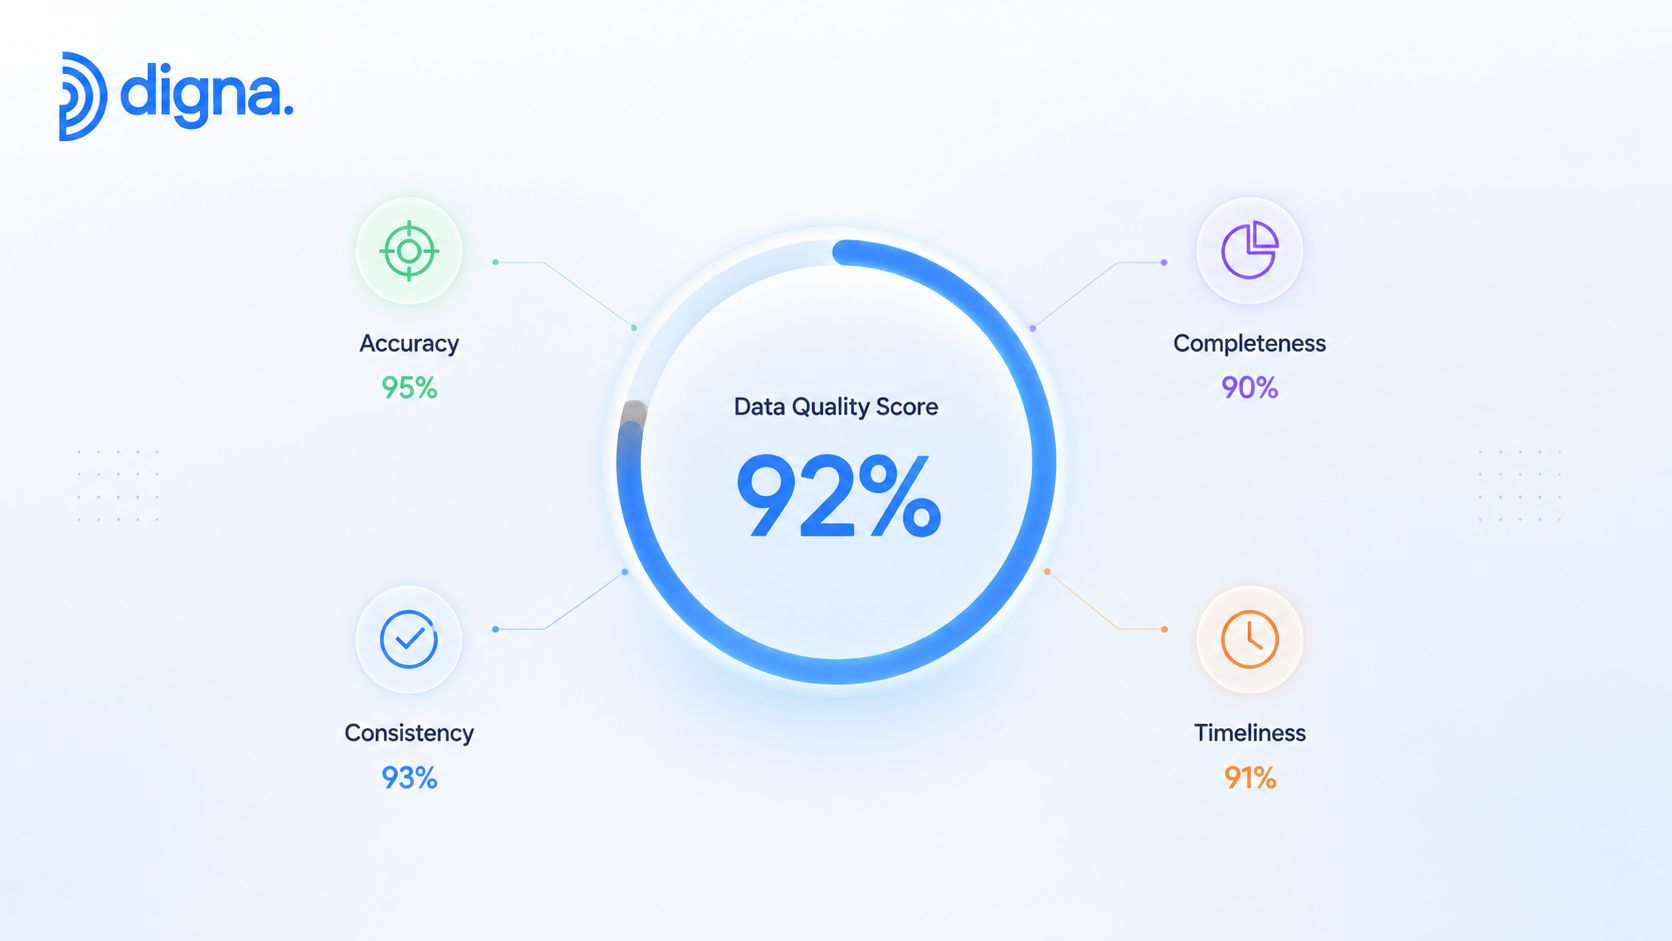
A Data Quality Score is the condition signal in the eight-KPI measurement system. Coverage shows where governance exists, enforcement shows whether controls operate, while this score shows whether critical data is fit for reporting, operations, compliance, or AI workflows. Common dimensions include accuracy, completeness, consistency, timeliness, and uniqueness. Teams can use data quality metrics guidance to define and combine these dimensions without treating the composite result as a diagnosis.
A simple calculation is:
Data Quality Score = sum of dimension scores multiplied by their assigned weights
Weights should match how each dataset is used. A regulatory report may give greater weight to validity and completeness, while a near-real-time operational dashboard may prioritize freshness. A shared enterprise score improves comparison, but dataset-specific scores retain the context needed to identify owners and remediation work.
Build the score around critical assets
Begin with a defined group of critical datasets instead of scoring the entire estate. For each asset, document the dimensions measured, validation rules, anomaly baseline, timeliness expectation, owner, and escalation path. Prioritize data linked to reporting, compliance, customer operations, or AI workflows, then expand coverage after the measurement process is stable.
The score should expose operational risk, not conceal it. A lower completeness result may reflect a planned source-system change, an unowned pipeline failure, or a recurring upstream defect. Those causes require different responses, so attach incident context and dimension-level results to the executive view.
Practical rule: A composite score should trigger investigation, not replace it.
digna's guidance is relevant when teams combine validation results, anomaly signals, and timeliness observations while keeping computation inside their own environment. In-database execution can also reduce the need to move sensitive data outside approved infrastructure.
2. Data Validation Pass Rate
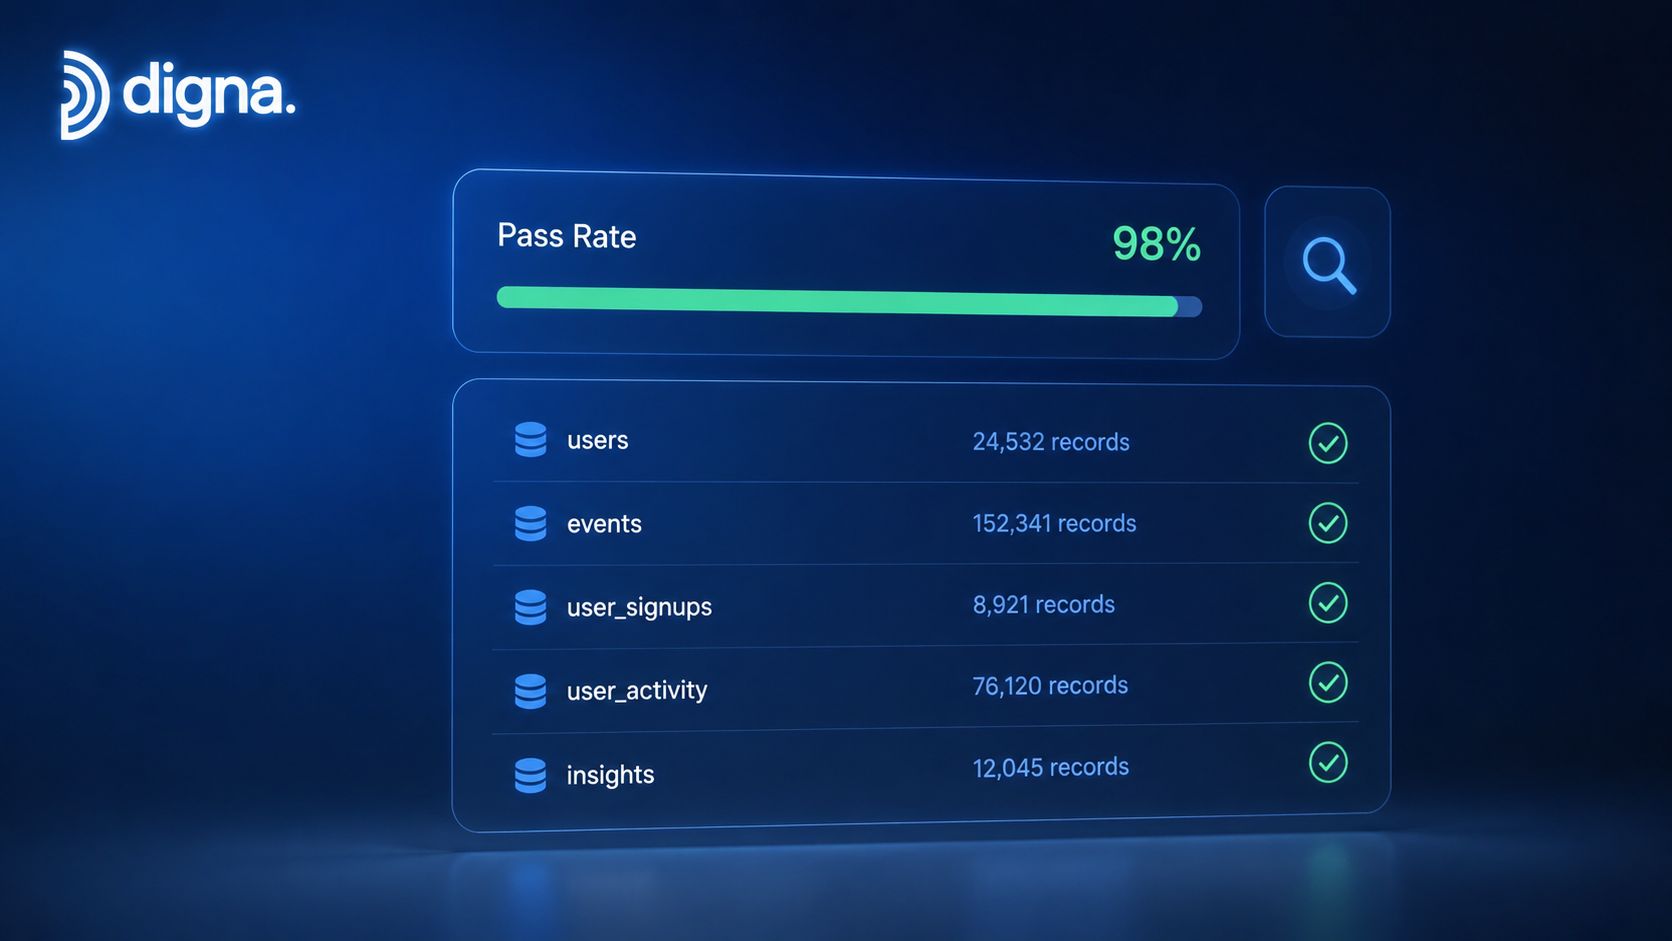
A Data Validation Pass Rate shows whether governed rules operate on actual records. It measures the share of records that pass defined business and structural checks during a stated period, connecting policy requirements with control performance.
Validation Pass Rate = records passing all applicable checks divided by total records evaluated, multiplied by 100
Calculate the KPI at rule, dataset, and domain level. The aggregate rate indicates overall enforcement, while rule-level results identify failures involving addresses, identifiers, dates, financial relationships, or other fields. Because one record can fail several checks, report records affected separately from total rule failures. This distinction prevents repeated failures in a small record group from distorting the operational picture.
Make failures explainable
Prioritize rules tied to reporting, compliance, AI inputs, or service delivery. Deterministic checks support consistent comparison, but aggregate counts are insufficient. Review samples of failed records and classify the cause, such as an upstream configuration error, a changed source definition, or a process that permits invalid values.
Use case risk should set the tolerance. Financial reporting controls generally require tighter limits than exploratory analysis. Schema validation can be calculated as records passing schema checks divided by total records. Published data-governance KPI benchmarks describe targets above 99.5% and treat results below 98% as a red flag, but those thresholds require adjustment for data criticality and rule scope.
digna's data validation rules and checks support record-level testing against business logic and audit requirements. Pair the pass rate with rule ownership, failed-record counts, and resolution time. A high rate without review of failures can reflect weak controls rather than healthy data.
3. Data Timeliness SLA Compliance
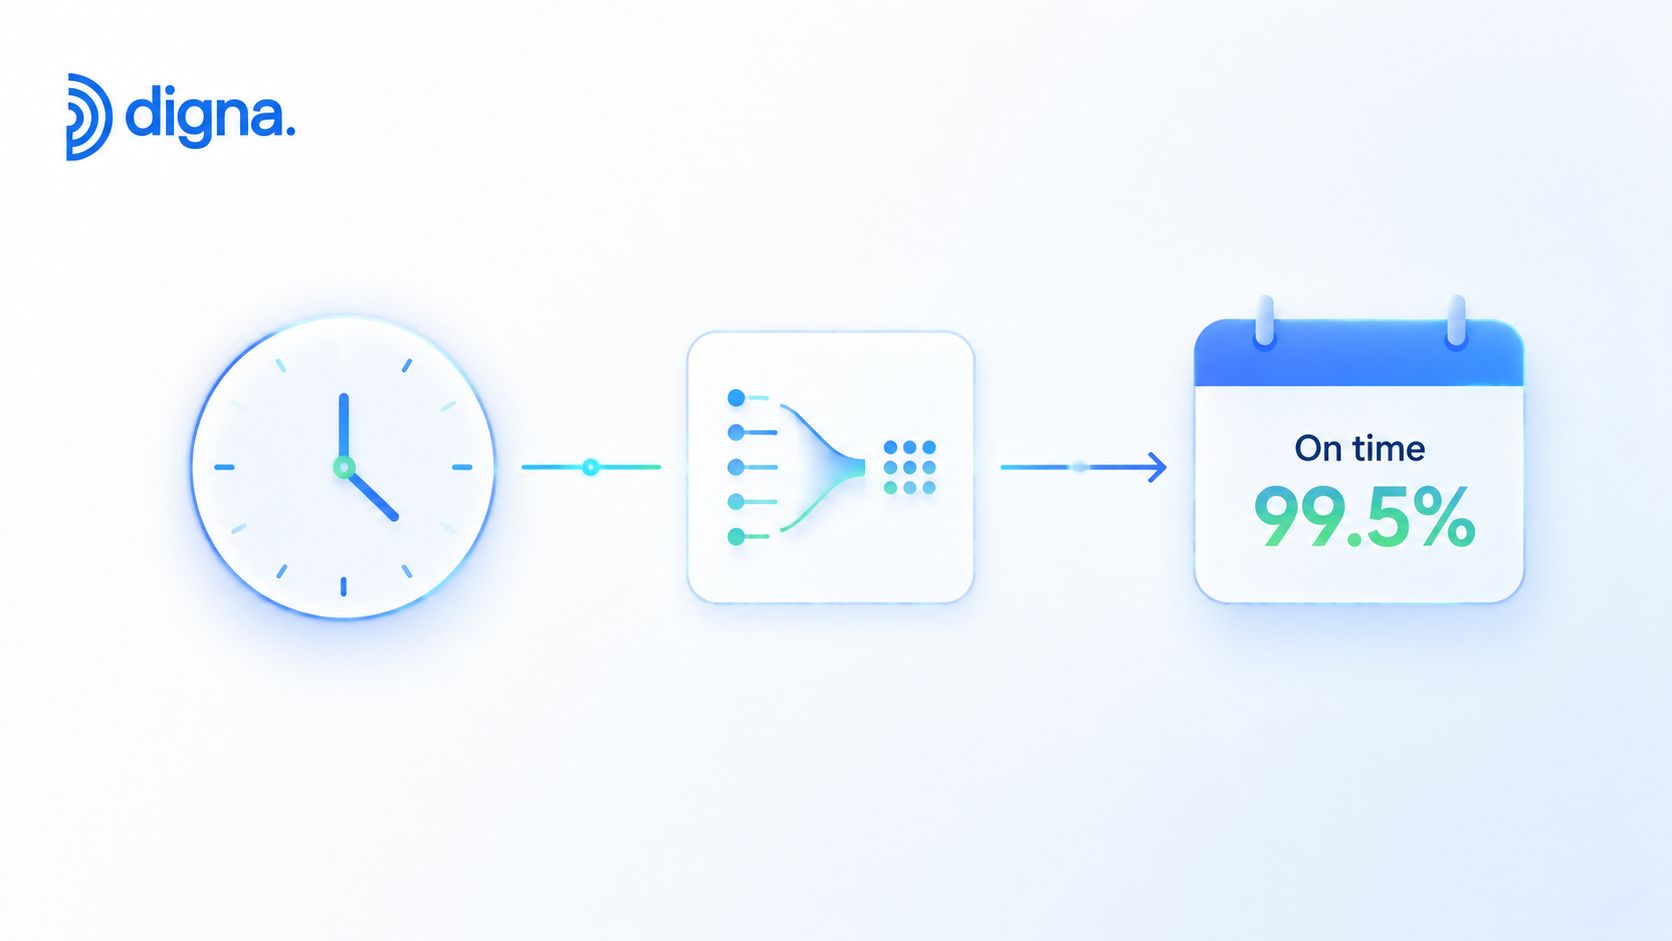
Late data can invalidate an otherwise accurate decision. Data Timeliness SLA Compliance measures whether expected deliveries arrive within the agreed window, connecting pipeline reliability with dashboard freshness, operational workflows, and decision latency. It forms the condition layer of the KPI system: coverage shows where governance exists, enforcement shows whether controls operate, and timeliness shows whether governed data is usable when decisions require it.
Timeliness SLA Compliance = data deliveries available on time divided by total expected deliveries, multiplied by 100
Calculate the numerator from timestamped delivery records. Include every expected delivery in the denominator, including missing loads. Excluding missing data makes performance appear stronger precisely when the pipeline is failing.
Set the clock around business need
Set the SLA from downstream requirements, not from current pipeline performance. A clinical result needed for a discharge workflow has different urgency from a monthly planning extract. Account for month-end, quarter-end, holidays, maintenance windows, and other calendar variations before escalating a delay.
One published benchmark recommends at least 98% timeliness for critical operational data (timeliness KPI definition and formula). A separate governance reference places freshness SLA adherence above 99% and treats below 95% as a red flag. These figures are reference points, not universal targets. The appropriate threshold depends on business consequence, delivery frequency, and the cost of late data.
digna's data timeliness monitoring approach uses expected delivery patterns to identify delays, missing loads, and early arrivals. Correlate missed SLAs with job runtime, queue depth, source availability, and infrastructure events. That analysis distinguishes a pipeline defect from an operating-environment constraint, giving owners a clearer remediation path.
4. Critical Data Incident Detection Rate
A governance program can't reduce incidents it never detects. Critical Data Incident Detection Rate measures how many relevant anomalies, quality failures, and schema changes monitoring surfaces within a defined response window.
The basic formula is:
Detection Rate = critical incidents detected within the target window divided by critical incidents identified through all available evidence, multiplied by 100
The difficult part is the denominator. Teams may discover incidents through monitoring, user complaints, failed reports, audit review, or downstream reconciliation. Those discovery channels should be reconciled so the KPI doesn't reward a monitoring system for reporting only its own alerts.
Measure signal, not alert volume
Begin with high-impact datasets and define what qualifies as critical. A sudden distribution shift in a regulatory dataset may require immediate escalation, while a seasonal fluctuation in an exploratory table may not. Track detection latency, false positives, and the route from alert to ticket. Detection without response evidence is only partial protection.
digna's anomaly detection capabilities combine baseline learning with validation and schema tracking. That combination matters because a business-visible incident can originate in a value distribution, a rule violation, or a structural change.
A monitoring team should ask two questions for every incident: “Did we detect it early enough?” and “Did the right owner act?”
Review false-positive patterns regularly. Known seasonal events, planned migrations, and recurring batch behavior should inform baseline tuning. The objective isn't to maximize alert count. It's to surface consequential failures early enough to prevent broken reports, failed models, or unreliable regulatory outputs.
5. Schema Change Detection and Resolution Time
Schema changes can create failures that ordinary quality checks miss. A removed column or incompatible type may stop a pipeline, while an optional-field change can pass through and alter downstream logic without immediate notice. Schema Change Detection and Resolution Time measures the elapsed time from structural-change detection to confirmed accommodation by downstream consumers.
Resolution Time = timestamp of confirmed downstream accommodation minus timestamp of change detection
Track mean, median, and worst-case resolution time separately. The mean summarizes overall performance, the median shows typical operating speed, and the maximum exposes escalation risk. Stop the clock only after downstream accommodation is confirmed, not when someone acknowledges an alert or creates a ticket.
Classify changes before they happen
A runbook should separate urgent changes from those suitable for planned review. Column removal, incompatible type changes, and altered key semantics generally require rapid escalation. New optional columns can enter a review queue when they do not affect downstream contracts.
Ownership and lineage shorten investigation because engineers can identify affected consumers without reconstructing dependencies during an incident. Record column meaning, source ownership, transformation logic, and downstream use. Coordinate planned changes with version control for SQL, dbt, and Python transformations.
Digna's schema drift explanation and monitoring guidance covers tracking for added or removed columns and data-type modifications. The KPI should therefore test more than detection coverage. It should show whether each material change reached the correct owner and was safely accommodated, connecting governance enforcement to pipeline reliability and decision risk.

6. Business KPI Anomaly Detection Effectiveness
Technical quality scores protect decisions only when they reveal whether business metrics remain trustworthy. Business KPI Anomaly Detection Effectiveness measures the share of meaningful changes in important metrics that are detected, explained, and escalated within an acceptable latency.
Effectiveness = meaningful business changes detected and correctly escalated divided by meaningful changes confirmed through review, multiplied by 100
The denominator requires a documented review process. Classify each reviewed alert as genuine business movement, a data-quality problem, a pipeline issue, or a false positive. These labels connect business outcomes to the underlying data quality metrics, while giving analysts evidence for tuning thresholds and reducing avoidable investigation.
Define “meaningful” with decision-makers
Executives may prioritize revenue, customer activity, transaction volume, or operational efficiency. Data teams may monitor the source tables and transformations that produce those measures. The control is effective only when both views connect: an alert should identify the metric, historical context, related data changes, and investigation owner.
digna's Business Monitoring capability supports analysis of business and operational metrics. Its Data Analytics module can help teams examine historical volatility and seasonality before setting sensitivity levels. This matters for metrics affected by calendar patterns, promotional cycles, or reporting cutoffs, where a fixed threshold can generate repeated false positives.
The strongest business anomaly alert helps a decision-maker determine whether the business changed or the data changed.
Review outcomes on a recurring basis. Compare detection and escalation results by metric, business domain, and cause category. A falling score may indicate weak monitoring coverage, while a high alert volume with few confirmed anomalies may indicate poor thresholds. Linking labels to source incidents, schema events, and validation failures turns this KPI from an alert count into evidence that governance protects operational decisions.
7. Data Governance Policy Adoption and Enforcement Rate
A documented policy has limited value until a control tests it and someone acts on exceptions. This KPI measures how widely approved policies are implemented through monitoring, validation, access controls, timeliness checks, schema controls, or other mechanisms.
Enforcement Rate = policies with active, tested controls divided by total defined policies, multiplied by 100
Define the denominator before measuring progress. Include formal standards and documented operating rules, while separating approved policies from aspirational guidance. Otherwise, adding policies can lower the rate even as control coverage improves.
Measure automation maturity
A benchmark found that 61% of organizations had policies in place, but only 38% had automated enforcement (governance maturity benchmark). The gap makes policy counts weak evidence. A policy may exist in a document without a system check, accountable owner, or actionable exception path.
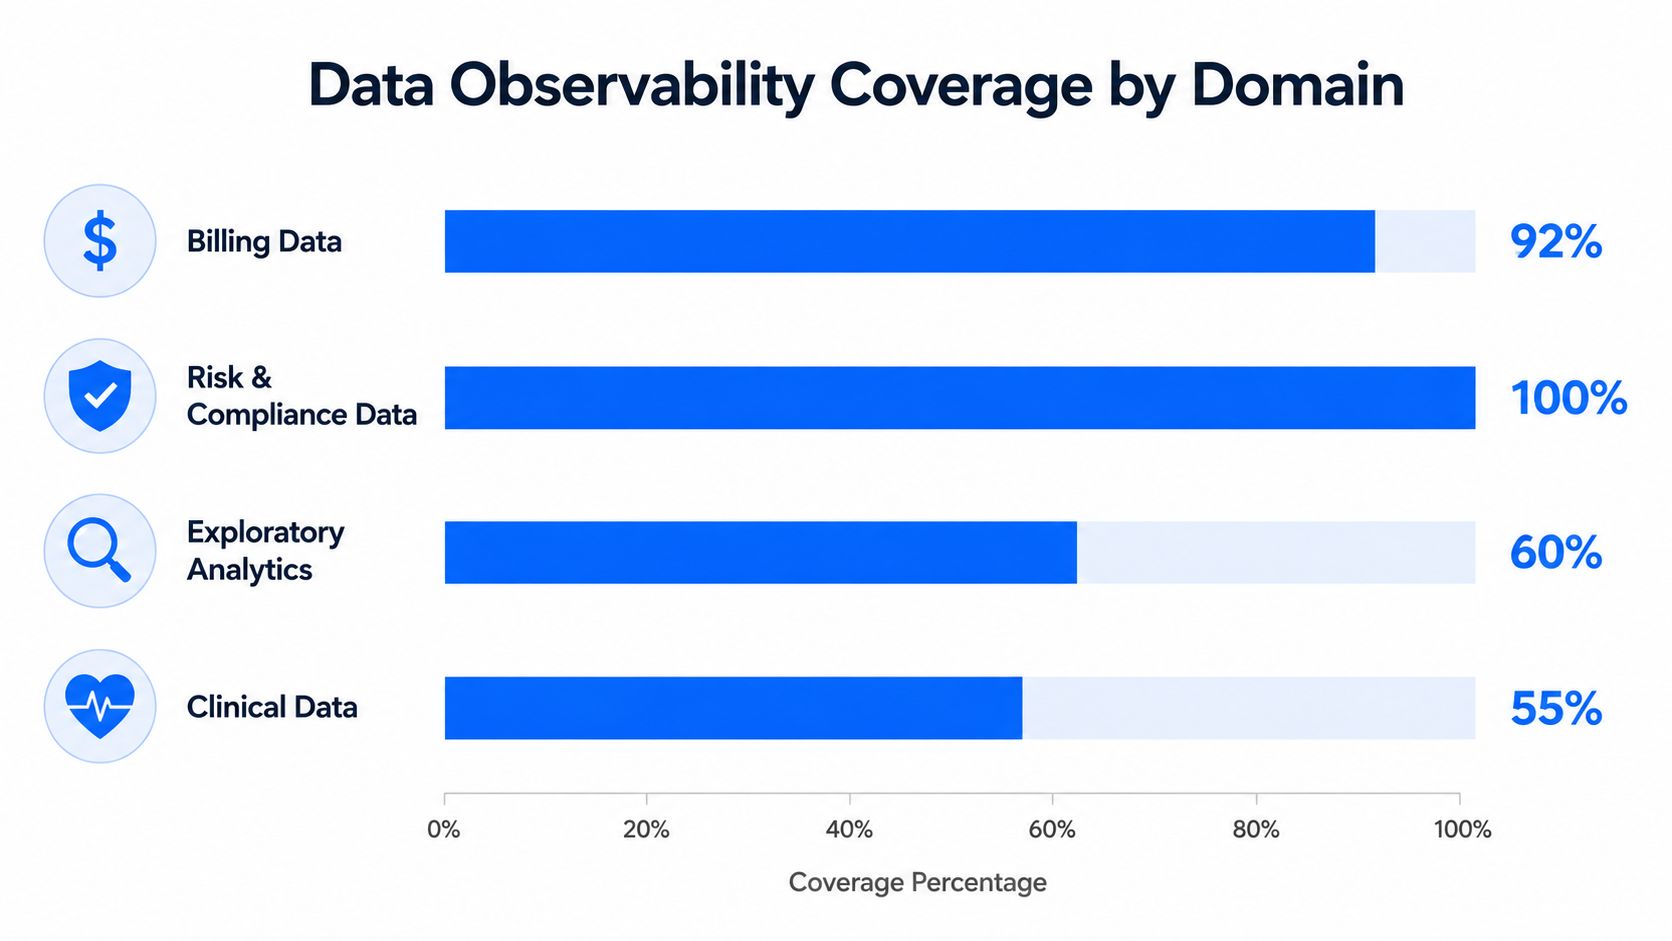
Map every policy to its control, dataset scope, owner, test frequency, exception process, and evidence location. Report results by domain and risk level, not only as an enterprise average. A healthcare organization, for example, may find that billing controls operate automatically while clinical controls remain manual.
Timeliness monitoring also provides evidence for enforcement. Tracking whether data meets agreed service levels helps verify that a policy operates in production, rather than merely existing in documentation. See the guidance on data timeliness definitions, metrics, and monitoring.
Adoption includes behavior after detection. Track alert acknowledgement, exception resolution, and workflow compliance. An automated control with routinely ignored findings is only partially enforced, so pair this KPI with incident outcomes and business-impact measures.
8. Data Observability Coverage and Monitoring Depth
Coverage shows where governance exists, while monitoring depth shows whether it can protect decisions. Measure the share of critical tables, pipelines, and business metrics under active monitoring.
Observability Coverage = monitored critical assets divided by total critical assets, multiplied by 100
A coverage percentage can hide weak protection. Monitoring one table for completeness provides less control than monitoring another for completeness, timeliness, anomalies, and schema changes. Report both the share of assets monitored and the number and type of active controls per asset.
Separate breadth from protection
Inventory the warehouse, lake, pipelines, and business metrics. Classify each asset by its connection to decisions, compliance obligations, service-level agreements, and operational risk. Prioritize gaps where failure could disrupt reporting, regulatory work, or operations.
Reference targets may include about 90% catalog coverage and 95% lineage or policy coverage, with 100% access-review completion for a mature program. These figures guide planning rather than define universal requirements. A regulated risk dataset may justify complete monitoring, while a low-risk exploratory asset may need less depth.
Use incident history, compliance obligations, and business priorities to set monitoring depth. A high coverage score with shallow checks can create false assurance, while deeper controls on the most consequential assets may reduce decision risk more effectively than uniform monitoring.
digna's Data Platform Observability solution monitors data workloads, consumption, availability, performance-related measures, and changes. Its in-database execution model can help teams extend monitoring without moving production data outside their environment.
8-Point Data Governance KPI Comparison
Metric | Implementation complexity 🔄 | Resource requirements ⚡ | Expected outcomes 📊 | Ideal use cases 💡 | Key advantages ⭐ |
|---|---|---|---|---|---|
Data Quality Score | 🔄 Medium, needs weighting logic and aggregation across dimensions | ⚡ Moderate, validation rules, anomaly detection, historical storage | 📊 Unified data-health score for benchmarking and trend tracking | 💡 Executive reporting, SLA tracking, cross-unit comparisons | ⭐ Simplifies reporting; prioritizes remediation |
Data Validation Pass Rate | 🔄 Medium, requires careful rule design and tuning | ⚡ High, record-level checks and ongoing rule maintenance | 📊 Precise enforcement metric with detailed failure reports | 💡 Compliance audits, upstream validation, targeted fixes | ⭐ Audit-ready, actionable failure evidence |
Data Timeliness SLA Compliance | 🔄 Low–Medium, needs baseline learning and schedule integration | ⚡ Moderate, monitoring pipelines and alerting systems | 📊 % of on-time deliveries; early warning for late/missing loads | 💡 Pipeline SLA monitoring, dashboard freshness, operational SLAs | ⭐ Automates SLA tracking; quantifies pipeline reliability |
Critical Data Incident Detection Rate | 🔄 High, AI baselining + integration with incident systems | ⚡ High, continuous anomaly detection and alerting | 📊 Faster detection (lower MTTD); surfaces known & unknown issues | 💡 Production analytics, model monitoring, high-risk data domains | ⭐ Early detection of anomalies; reduces outage impact |
Schema Change Detection & Resolution Time | 🔄 Low–Medium, continuous tracking + runbooks for response | ⚡ Low–Moderate, schema monitoring and impact analysis tools | 📊 Time-to-resolution metric; prevents silent downstream failures | 💡 Environments with frequent schema drift or many integrations | ⭐ Immediate detection; impact visibility and audit trail |
Business KPI Anomaly Detection Effectiveness | 🔄 High, requires accurate KPI definitions and tuning | ⚡ High, AI baselines, multi-dim analysis, root-cause hints | 📊 % of meaningful business changes detected and contextualized | 💡 Executive dashboards, revenue/volume monitoring, ops alerts | ⭐ Business-focused alerts with contextual root-cause hints |
Policy Adoption & Enforcement Rate | 🔄 Medium, policy-to-monitor mapping and exception workflows | ⚡ Moderate, policy management, audit logging, approvals | 📊 % of policies operationalized; governance maturity indicator | 💡 Governance programs, compliance reporting, risk management | ⭐ Shows operational control; prioritizes enforcement gaps |
Observability Coverage & Monitoring Depth | 🔄 High, automated discovery and multi-layer monitoring setup | ⚡ High, inventorying, baselining, dashboards across layers | 📊 Coverage ratio and depth metrics to identify blind spots | 💡 Large data platforms, observability maturity planning | ⭐ Quantifies monitoring maturity; guides coverage investment |
Turn Eight Metrics Into a Governance Operating Rhythm
These eight KPIs work best as a system, not as an inventory of unrelated numbers. Coverage tells you whether critical assets are visible. Policy enforcement tells you whether written standards operate in live workflows. Quality and validation show whether records are fit for use. Timeliness shows whether data arrives when decisions require it. Incident detection and schema resolution reveal how quickly the organization responds to change. Business anomaly effectiveness connects technical monitoring to the outcomes leaders manage.
Start by establishing a baseline on critical assets. Record the current quality dimensions, validation results, delivery performance, monitoring coverage, policy controls, incident pathways, and business-metric alert outcomes. Avoid changing the target while changing the measurement method. A trend is useful only when the population, formula, and observation window remain understandable.
Assign an owner to every KPI and every critical asset. The owner should have authority to investigate, approve exceptions, coordinate remediation, and confirm closure. This addresses a central governance problem identified in a 2025 survey, where 47% of respondents named unclear ownership and accountability as the primary blocker to scaling governance (2025 data governance survey). A dashboard can expose an issue, but only accountable people can resolve it.
Set thresholds by business impact. Use stricter controls for data that supports regulatory reporting, patient operations, financial risk, or high-consequence customer decisions. For reference, published frameworks include targets such as at least 90% catalog coverage, at least 95% policy coverage, MTTR under four hours, and 100% completion for quarterly access reviews (data governance metrics framework). Treat these as design inputs, then validate them against actual service needs and response capacity.
Review different signals at different cadences. Engineers and stewards need frequent views of failed validations, missed deliveries, open incidents, false positives, and schema changes. Governance leaders need trends in coverage, enforcement, quality, and remediation. Executives need a concise connection between data controls and business outcomes. This distinction matters because 39% of data leaders reported difficulty demonstrating governance impact to leadership, while 85% of senior data and analytics executives prioritized governance improvements to prepare for AI (2025 state of enterprise data governance report).
No single KPI proves governance health. A high quality score can coexist with blind spots. Broad coverage can coexist with weak enforcement. Fast detection can coexist with slow remediation. Build the scorecard so each measure answers a different operational question, and connect every alert to evidence of ownership, action, and confirmed resolution.
digna is one option for teams that need monitoring across quality, timeliness, anomalies, validation, schema changes, business metrics, and platform observability. Its modular platform runs inside the customer's environment and supports in-database execution, so teams can keep data in place while expanding the governance measurement system.
Use digna to monitor critical data quality, timeliness, validation, anomaly, schema, and observability signals inside your own environment. Visit digna to connect these controls to accountable owners, operational alerts, and evidence that governance is working in production.