8 Core Data Scrubbing Techniques for Reliable Data
|
7
min read

Your board deck is due, the dashboard looks “fine,” and the model output doesn't look crazy at first glance. Then one stale field, one silent schema shift, or one duplicate load throws the whole story off. That's the reality behind data scrubbing techniques today, they have to catch problems before they spread, not after someone notices a broken report. Traditional cleanup scripts still matter, but they don't scale well when data moves fast, sources change often, and teams need auditability as much as accuracy. A modern observability platform like digna makes that shift practical by pairing automation with in-database checks and continuous monitoring.
For a useful framing on why teams now build around observable, controlled data flows, see this discussion of why choose a web scraping API. The same logic applies once data lands in your stack, because reliability depends on what you can verify, trace, and replay.
Table of Contents
1. AI-Powered Anomaly Detection with Statistical Baseline Learning
1. AI-Powered Anomaly Detection with Statistical Baseline Learning
3. Record-Level Data Validation with Business Rule Enforcement
5. Data Timeliness Monitoring and Expected Delivery Validation
5. Data Timeliness Monitoring and Expected Delivery Validation
7. Unified Data Quality Observability and Cross-Dimension Analysis
7. Unified Data Quality Observability and Cross-Dimension Analysis
8. Privacy-Preserving Data Quality Monitoring with On-Premises Deployment
1. AI-Powered Anomaly Detection with Statistical Baseline Learning
A useful anomaly detector does not wait for analysts to define normal behavior record by record. It learns the baseline from the data itself, then watches for shifts in volume, distribution, or structure that fall outside that pattern. That matters because the failure is often not a single bad row, it is a pipeline that stops behaving the way it did yesterday.
This is why statistical baseline learning works so well in modern data scrubbing techniques. A platform can compare current patterns against historical behavior, surface the break, and keep the monitoring tied to the same data flow that created the issue. For a broader view of how teams connect quality monitoring with reporting, the data analytics guide for Canadian SMBs is a useful reference point.
digna's anomaly detection for time series fits teams that need ongoing monitoring instead of one-off cleanup. An e-commerce team can spot a sudden drop in transaction volume before the morning review. A bank can use the same approach to isolate suspicious account behavior, while a healthcare team can watch for unusual patient metric distributions that need a second look.
What works in production
Start broad, then narrow the scope. Broad anomaly detection catches the signal you did not know to look for, while record-level rules handle the business logic once the pattern is clear. That split is usually better than trying to encode every edge case up front.
A modern observability platform makes that approach easier to maintain because it shows the historical pattern alongside the spike or drop. Teams get a clearer view of whether they are dealing with an isolated outlier, a distribution shift, or a source-level issue that needs follow-up. The practical trade-off is simple, broader detection finds more unknowns, while tighter rules reduce false positives once the failure mode is understood.
Practical rule: Let the platform learn from historical data before you turn on production alerting
1. AI-Powered Anomaly Detection with Statistical Baseline Learning
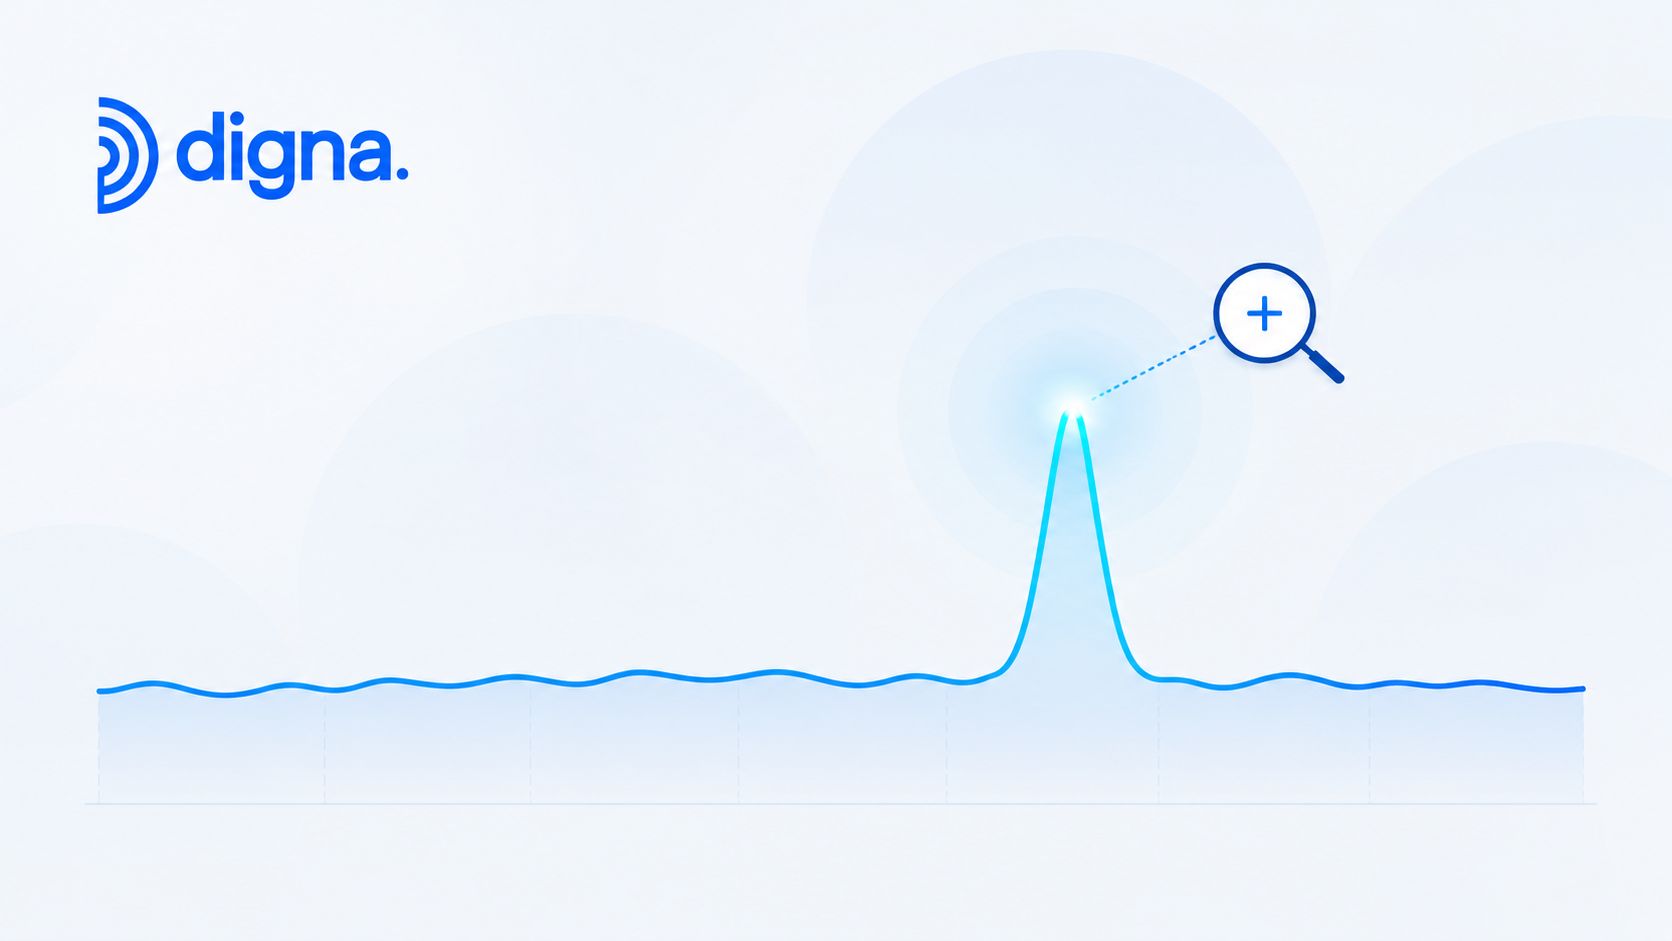
A good anomaly detector doesn't wait for you to tell it what “normal” means row by row. It learns that from the data itself, then watches for shifts in distributions, volume, or structure that don't fit the baseline. That matters because the failure often isn't a bad record in isolation, it's a pipeline that stops behaving the way it did yesterday.
digna's anomaly detection for time series fits well when teams need ongoing monitoring rather than ad hoc cleanup. An e-commerce team can use it to spot a sudden drop in transaction volume before the morning review. A bank can use the same pattern to isolate suspicious account behavior, while a healthcare team can watch for unusual patient metric distributions that deserve a second look.
What works in production
Start broad, then tighten. Broad anomaly detection catches the signal you didn't know to look for, while record-level rules handle the business logic once the pattern is clear. That's a better split than trying to encode every edge case up front.
Practical rule: Let the platform learn from historical data before you turn on production alerting. Without that warm-up period, you'll spend too much time chasing normal variation.
The strongest setups pair anomaly detection with context. If a dashboard flags an issue, analysts need to see the earlier trend line, not just the alert. That's where a platform like digna Data Analytics helps, because it keeps the historical pattern visible alongside the spike or drop.
A platform that shows the baseline and the outlier together shortens root-cause analysis fast.
2. In-Database Metric Computation and Scrubbing

Moving sensitive data into another system just to inspect it creates avoidable risk and more operational work. In-database scrubbing keeps analysis close to the source, so the data stays inside the customer-controlled environment while completeness checks, consistency validation, and profiling still run at scale. That approach lines up with the broader quality principle that scrubbing is about correcting inaccurate, incomplete, inconsistent, duplicate, or corrupt records, then validating the result against business rules and traceability requirements, as described in the IOM messy-data guidance and related workflow advice from Acceldata's data scrubbing overview and the IOM document on data cleaning and messy data.
That matters for regulated teams. A European financial institution can run regulatory scrubbing without exporting records. A healthcare provider can validate patient data without moving sensitive fields into a separate service. A telecom team can analyze call detail records while keeping sovereignty intact.
How to place the work
Database timing matters more than teams admit. Run heavier scrubbing jobs during off-peak hours, watch database resource usage closely, and use partitioning where it reduces scan cost. If the platform can keep metric computation in-database, you avoid a second copy of the truth drifting away from the first.
Practical rule: Don't schedule scrubbing where it competes with your most expensive production queries.
digna's in-database data quality platform approach is useful when you need anomaly detection and validation in the same execution path. That keeps sensitive data resident, reduces movement, and makes the operational footprint easier to explain to security and compliance teams.
3. Record-Level Data Validation with Business Rule Enforcement
Sometimes the problem isn't hidden in a trend. It's sitting in one record that breaks a rule the business already knows. Range checks, format checks, cross-field logic, and referential integrity controls stop bad rows before they contaminate downstream reporting or model features.
Stony Brook's data-cleaning guide gives practical examples that are easy to turn into validations, like end dates that can't come before start dates, or email fields that must contain an “@” and a domain. Those are the kinds of checks that catch issues a generic duplicate remover will miss.
Build the rule set with intent
Start with the rules that protect revenue, compliance, or patient safety. In banking, that means validating account numbers, transaction amounts, and customer data against the constraints that matter to audit and operations. In e-commerce, it means checking product completeness and consistency across catalog systems. In healthcare, it means enforcing clinical record standards before analysts or clinicians rely on them.
Keep severity levels explicit. A failed regulatory rule deserves faster attention than a cosmetic issue in a descriptive field. Rule volumes matter too, because if alerts are noisy, teams stop trusting them.
Prioritize high-impact rules first: Build around fields that affect money, safety, or compliance.
Document ownership clearly: Make sure every rule has a named business owner and a purpose.
Review thresholds regularly: If an alert fires too often, people ignore it.
digna Data Validation is relevant here because it lets teams combine custom rules with anomaly signals, so expected business logic and unexpected behavior stay visible in the same workflow.
5. Data Timeliness Monitoring and Expected Delivery Validation
A dashboard can open cleanly and still mislead the team if last night's feed never arrived. The numbers look normal, the charts render, and stale data slips into decisions without raising an obvious error. Timeliness monitoring checks arrival time as part of data scrubbing, which makes it practical for teams that need to know whether data is current enough to trust.
Retail teams notice this first when daily sales loads miss the morning meeting. Financial institutions see it when market data reaches downstream systems too late for trading workflows. Healthcare teams run into it when patient record updates lag behind the clinical dashboard, even though the source system has already changed.
Make lateness measurable, not anecdotal
Expected arrival windows work better than fixed alarms because real pipelines have their own rhythm. A learned delivery pattern shows what on-time delivery usually looks like, while a scheduled expectation gives the team the hard boundary needed for escalation. Used together, they help separate a source that is consistently late from one that is delayed by an unusual event.
Partial loads need the same attention. A file can arrive on schedule and still be incomplete, so arrival time alone does not tell you whether the dataset is usable. The stronger pattern is to monitor expected delivery and volume anomalies together, then route the result into the same observability workflow so operators can see timing, completeness, and source behavior side by side.
Set clear SLAs: Define when data should arrive and who responds when it does not.
Watch frequent offenders first: Focus on sources that arrive late often.
Track trends over time: Historical timing patterns show whether lateness is getting worse or just following a predictable cycle.
In practice, this works best inside a modern observability platform that treats delivery timing as a monitored signal instead of a one-off alert. digna can combine timing checks with anomaly detection and in-database processing, so teams do not have to maintain separate scripts for every source.
5. Data Timeliness Monitoring and Expected Delivery Validation
Late data is sneaky. The report still renders, the dashboard still opens, and by the time someone notices the numbers are stale, decisions have already been made. Timeliness monitoring focuses on when data arrives, not just what it contains, which makes it one of the most practical data scrubbing techniques for operational teams.
Retail teams feel this first when daily sales loads miss the morning meeting. Financial institutions feel it when market data lands too late for trading workflows. Healthcare teams feel it when patient record updates lag behind the clinical dashboard.
Turn lateness into a monitored signal
Expected arrival windows work better than fixed alarms because real pipelines have their own rhythm. Learned delivery patterns show what “on time” usually looks like, while scheduled expectations give teams the hard boundary they need for escalation. Combining both makes it easier to separate an unusual delay from a routine delay that always follows a certain source.
Use data volume alongside arrival time. A partial load can arrive on schedule and still be wrong, so timeliness alone is never enough. That's why the strongest setups track expected delivery and volume anomalies together.
Set clear SLAs: Define when data should arrive and who responds when it doesn't.
Watch frequent offenders first: Prioritize sources that are late often.
Track trends over time: Historical timing patterns reveal recurring operational problems.
digna Timeliness is built for that kind of monitoring, and its analytics layer helps teams see whether lateness is becoming a pattern or just a one-off event.
7. Unified Data Quality Observability and Cross-Dimension Analysis
A late file, a schema tweak, and a validation failure often show up as separate tickets. The core issue is usually one shared pipeline problem, and teams spend too much time matching clues across tools. A unified observability layer brings anomaly detection, validation, timeliness, and schema tracking into one view, so analysts and engineers can see cross-dimensional visibility without assembling the story by hand.
That matters because quality issues rarely stay in one bucket. A delayed load can also arrive with missing rows. A schema change can trigger rule failures that look like bad data until the source release is reviewed. An anomaly may only make sense after someone compares it with delivery history, structure drift, and downstream breakage. The longer those signals stay separated, the longer root cause analysis takes, and the more likely the wrong team gets paged.
A practical setup also changes how different teams work. Engineers need the source, the timing, and the failing check. Analysts need to know whether the dataset is still trustworthy for reporting. Governance teams need lineage and accountability. One interface can serve all three when it shows relationships between signals instead of isolating alerts.
Correlate the signals before you escalate
Role-based views help because each group looks at data quality from a different angle. Engineers want the failing table and the upstream change. Analysts want to know whether a metric is still usable. Governance teams want to trace ownership and impact. A platform built this way reduces the back-and-forth that usually follows a quality incident.
This approach also fits operational use cases beyond a single domain. The same pattern helps a logistics team correlate shipment delays with missing status updates, which is the kind of problem discussed in AI in logistics and supply chain. When observability ties those signals together, teams spend less time debating whether they are seeing one issue or three.
Use one monitoring layer: Consolidate overlapping checks where the same dataset is already being watched from multiple angles.
Connect signals to workflows: Push issue context into catalogs, ticketing systems, and governance tools so the next owner sees the full picture.
Expand coverage gradually: Start with the highest-risk tables, then widen the scope as the operating model settles.
digna's unified interface is relevant here because it pulls together anomaly signals, validation results, schema drift, and delivery patterns in one place. That gives teams a clearer operating view and shortens the path from symptom to source-level fix.
7. Unified Data Quality Observability and Cross-Dimension Analysis
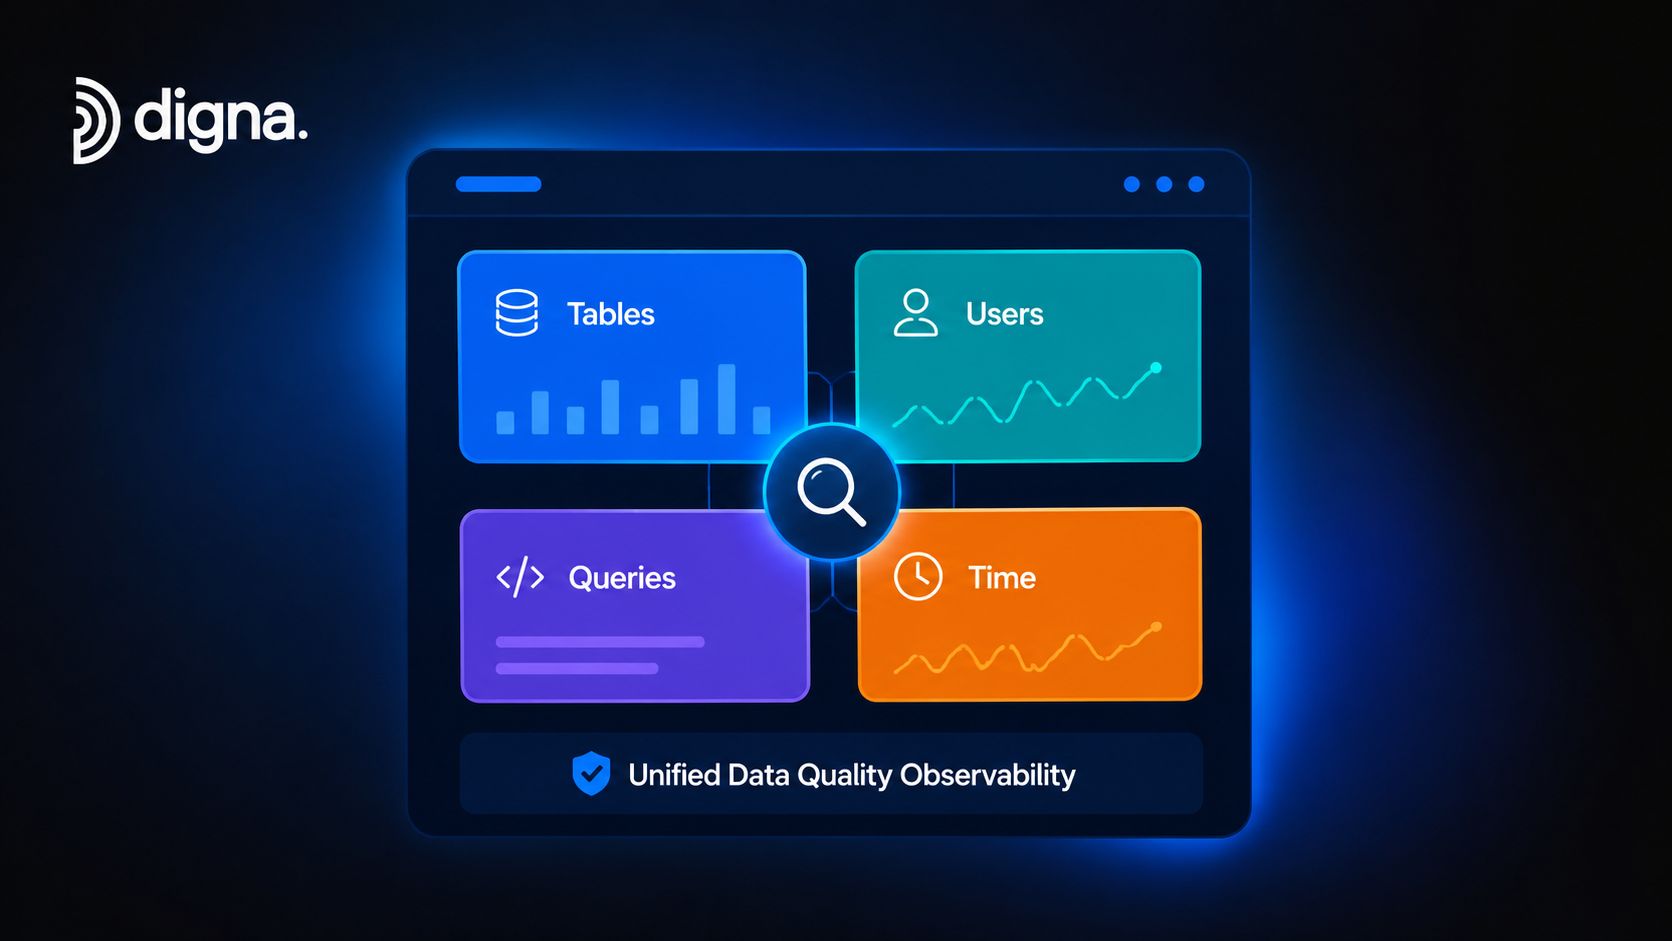
A lot of teams do not lack checks. They lack a single place to read them. An observability layer that brings anomaly detection, validation, timeliness, and schema tracking into one view lets people assess quality across dimensions without stitching the story together by hand.
That matters in day-to-day operations. A late load can coincide with a volume drop. A schema change can explain why validation started failing. An anomaly often makes sense only after you compare it with delivery history and structural drift. If those signals sit in separate tools, root cause analysis slows down and the wrong team gets paged.
Correlate the signals before you escalate
Role-based views help because engineers, analysts, and governance teams rarely need the same screen. Engineers want the source, the timing, and the failing check. Analysts want to know whether they can trust the dataset. Governance teams want lineage and accountability. One interface can serve all three if it shows relationships, not just alerts.
A practical setup usually starts by reducing overlap. If the same table is already monitored from several angles, consolidate the checks where that makes operational sense. Then push issue context into catalogs and governance tools so the next owner sees what happened and where to act. Expand coverage from the highest-risk tables first, then widen the footprint as the operating model settles.
digna's unified interface is relevant here because it pulls together data anomalies, validation, timeliness, and schema signals in one place. That cuts the overhead of jumping between tools, and it makes correlation faster when a pipeline issue hits.
8. Privacy-Preserving Data Quality Monitoring with On-Premises Deployment
Some teams can't afford to move sensitive data outside their controlled perimeter, even for quality checks. That's where privacy-preserving monitoring becomes part of scrubbing strategy, not a separate concern. The practical goal is to keep the data useful for analytics and validation while preserving privacy and meeting regulatory constraints.
Mainstream scrubbing advice often focuses on deleting obvious errors, but that doesn't solve the harder problem of keeping PII useful while reducing identifiability. Privacy-focused methods like perturbation and data swapping are designed to preserve statistical structure while lowering risk, which is why they show up more often in privacy literature than in ordinary cleanup guides. The gap is important for regulated environments where teams need to sanitize data for testing, analytics, or sharing without breaking downstream use cases. For that privacy-preserving angle, see mostly.ai's discussion of PII scrubbing.
Control the environment first
On-premises or private-cloud deployment gives you the simplest answer to residency and access concerns. European financial firms, healthcare organizations, government agencies, and multinational enterprises all face versions of the same constraint, sensitive data has to stay where policy says it must stay. That makes infrastructure planning part of the scrubbing technique itself.
Integrate monitoring with your existing security and compliance stack. Audit logs matter. Access policies matter. So does the ability to explain where data lives and who can inspect it.
Plan deployment early: Don't bolt infrastructure decisions onto the end of a compliance review.
Keep logs complete: Trace access, changes, and validation runs.
Align with regional rules: Make sure the platform matches the data protection model you operate under.
digna's customer-controlled deployment model fits this use case because the analyses run inside private cloud or on-prem environments, with no vendor access to production datasets. That's a practical way to keep scrubbing, validation, and observability together without exposing the records you're trying to protect.
8-Point Comparison of Data Scrubbing Techniques
Technique | 🔄 Implementation Complexity | ⚡ Resource Requirements | 📊 Expected Outcomes | Ideal Use Cases | ⭐ Key Advantages / 💡 Quick Tip |
|---|---|---|---|---|---|
AI-Powered Anomaly Detection with Statistical Baseline Learning | Medium–High, automated models, initial tuning | Moderate compute + sufficient historical data | Continuous anomaly detection with fewer false positives | E‑commerce drops, fraud detection, healthcare metric anomalies | ⭐ Adapts to seasonality; catches novel issues. 💡 Allow 2–4 weeks historical data and tune sensitivity. |
In-Database Metric Computation and Scrubbing | Medium, SQL-based, vendor compatibility considerations | High DB compute; no data movement | Secure, compliant scrubbing with low network overhead | Regulated industries, data residency-sensitive workloads | ⭐ Keeps data in-place and leverages DB optimizations. 💡 Schedule jobs off-peak and monitor DB utilization. |
Record-Level Data Validation with Business Rule Enforcement | Medium, rule definition and maintenance required | Low–Moderate compute; rule management overhead | Enforces business logic and prevents bad records downstream | Banking validations, product catalog integrity, clinical records | ⭐ Clear audit trails and compliance. 💡 Start with high‑impact rules and classify by severity. |
Schema Change Detection and Structural Data Validation | Low–Medium, automated monitoring, governance coordination | Low compute; continuous tracking | Early detection of schema drift to prevent pipeline failures | Data lakes, analytics pipelines, API producers | ⭐ Prevents downstream breakage and protects models. 💡 Integrate alerts into schema governance workflows. |
Data Timeliness Monitoring and Expected Delivery Validation | Low–Medium, schedule setup and pattern learning | Low–Moderate; needs arrival history | Predictive alerts for late/missing loads, SLA monitoring | Retail daily loads, market data feeds, clinical updates | ⭐ Reduces time‑to‑detection for freshness issues. 💡 Configure SLAs and warning windows; combine with volume checks. |
Historical Data Analytics and Trend-Based Scrubbing | Medium–High, time‑series analytics and interpretation | High storage & compute for long histories | Contextual insights; detects gradual degradation and trends | Capacity planning, root‑cause analysis, long-term quality tracking | ⭐ Reveals slow trends and root causes. 💡 Review trend reports regularly and correlate with events. |
Unified Data Quality Observability and Cross-Dimension Analysis | High, integrates multiple dimensions and tools | High initial integration; consolidates ongoing costs | Holistic visibility and faster root‑cause resolution across dimensions | Enterprise governance, MLOps, cross‑team observability | ⭐ Eliminates tool sprawl and correlates signals. 💡 Configure role‑based dashboards and expand coverage gradually. |
Privacy-Preserving Data Quality Monitoring with On-Premises Deployment | High, on‑prem deployment, operational responsibility | High infra investment and maintenance | Full compliance and data sovereignty with in‑environment monitoring | GDPR/HIPAA environments, government, air‑gapped setups | ⭐ Ensures data never leaves customer perimeter. 💡 Plan infrastructure and integrate with existing security/audit systems. |
Automate Scrubbing, Elevate Trust
Effective data scrubbing is no longer about one-off cleanup scripts. It's about building a continuous system that catches anomalies, enforces rules, tracks schema drift, watches delivery timing, and preserves provenance so teams can trust what they use. The strongest data scrubbing techniques don't just remove bad records, they make quality visible enough to maintain over time.
That's the shift modern observability platforms support. With in-database execution, historical analytics, unified dashboards, and private deployment, digna gives teams a practical way to keep sensitive data under control while still applying automation at scale. The value isn't only in cleaner tables, it's in faster root-cause analysis, fewer silent failures, and a tighter link between raw inputs and trusted outputs.
If your dashboards still depend on manual spot checks or fragile cleanup jobs, it's time to put observability closer to the source. Review how digna fits your warehouse, lake, or regulated environment, then map one high-value dataset to a continuous scrubbing workflow this week. Schedule a free demo at digna.