Data Quality Assurance Guide for Modern Data Teams
|
7
min read

You're in the meeting where the dashboard looks fine, the model shipped, and then someone asks why yesterday's numbers don't match finance. The load ran late, a column changed shape, and nobody saw it until users did. That's the moment data quality assurance stops being a cleanup task and becomes a control layer.
In plain terms, data quality assurance asks one question before data reaches people or systems: is this data fit for the decision it's about to support? The European Medicines Agency frames quality as fitness for purpose and says the data should reflect reality, which is the right mental model for regulated work and for everyday analytics alike. EMA data quality framework
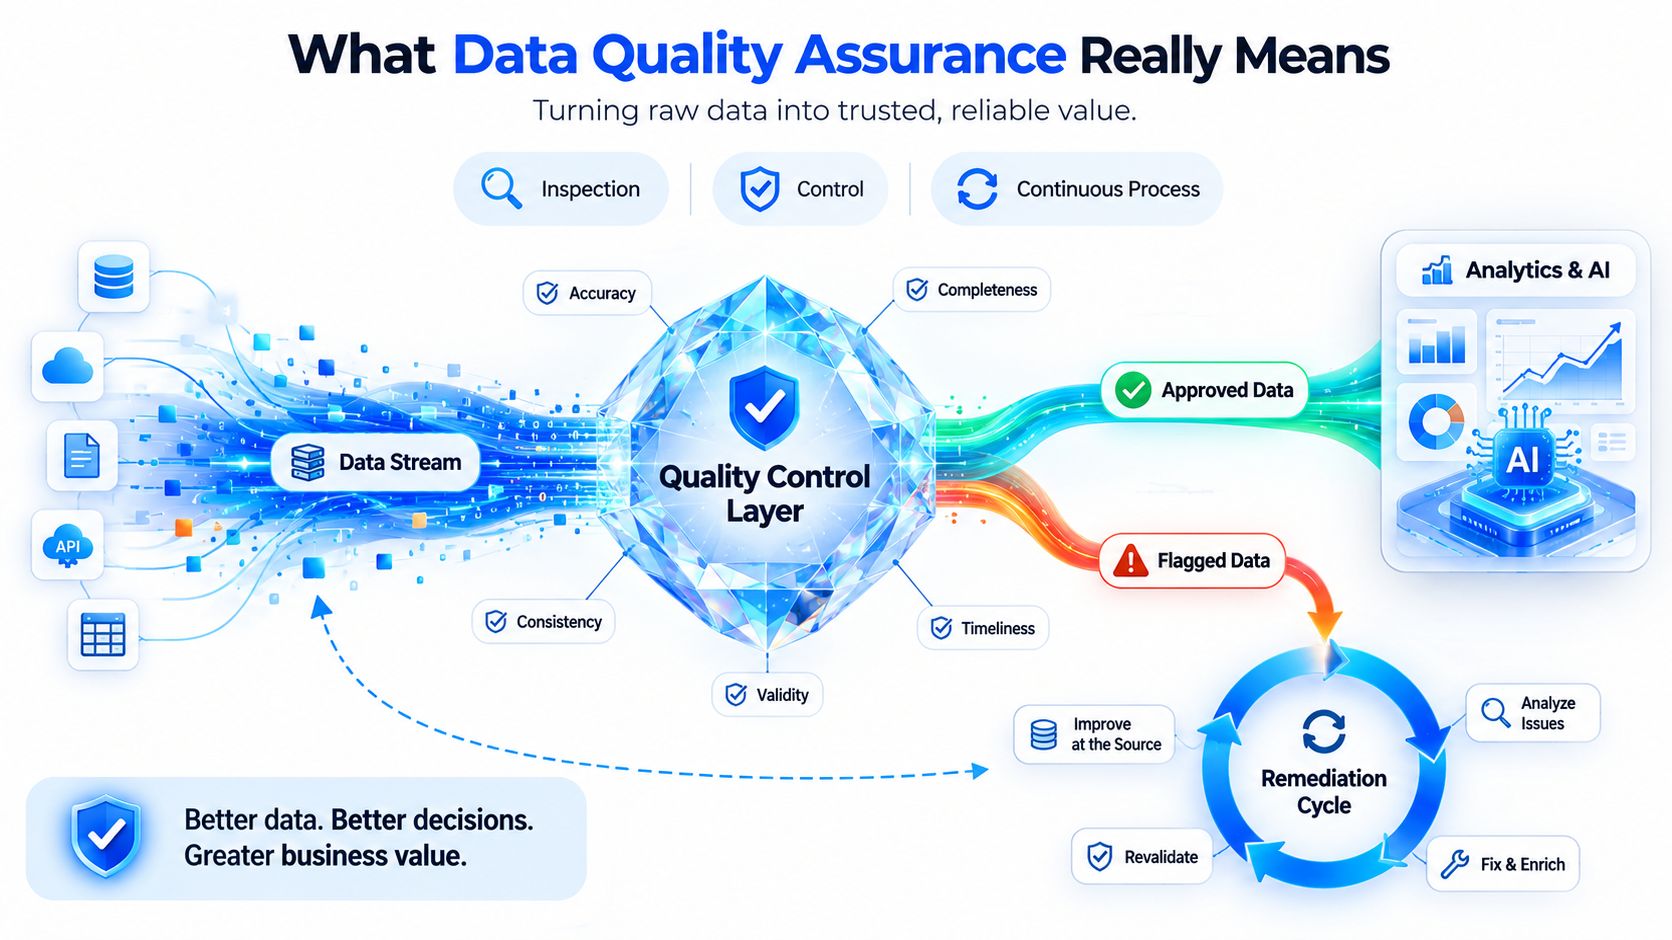
A lot of teams start with profiling and cleansing, which helps, but it's still reactive if the work happens after a broken feed lands in BI or ML. A manufacturing line doesn't inspect only the finished pallet after it leaves the dock. It checks the part as it moves through the line, flags defects early, and sends failures back into remediation before they spread.
That's the shift here. Reactive data quality cleans up defects after someone notices them. Proactive data quality assurance keeps watch continuously, with defined checks, thresholds, and ownership so problems get caught before they become meetings. By the end of this guide, you'll know how to design a program that does exactly that.
Table of Contents
What Data Quality Assurance Really Means
Why profiling alone falls short
Reactive quality versus proactive assurance
The Six Core Dimensions You Need to Measure
Accuracy, completeness, and consistency
Timeliness, uniqueness, and validity
Methods That Catch Problems Before Users Do
Four checks that catch most failures early
Layer the checks
KPIs and SLAs That Make Quality Enforceable
From metrics to targets
Make the KPI enforceable
A Six-Phase Implementation Roadmap
Phase 1 through Phase 3
Phase 4 through Phase 6
How a Modern Observability Platform Operationalizes the Program
What the platform is doing under the hood
Why deployment model matters
Common Pitfalls and How to Avoid Them
Five failures that show up again and again
Keep the program from drifting
Practical Checklists, Workflows, and Quick Answers
Starter checklist
Sample workflow for a new critical data element
Quick answers teams usually ask
What Data Quality Assurance Really Means
A broken dashboard usually isn't broken because one analyst made a bad chart. It's broken because the data stream behind it changed, slowed down, or drifted out of trust. In that moment, the problem isn't cleansing, it's control.
The clearest definition is the practical one. Data quality assurance is the discipline of making sure data is fit for purpose, not just clean in the abstract. The Hong Kong Census and Statistics Department's quality framework is useful here because it treats timeliness as the gap between data availability and the event it describes, which makes freshness part of quality, not an afterthought. Statistical quality framework PDF
Why profiling alone falls short
Profiling tells you what the data looks like today. Cleansing fixes what you already found. Neither one, by itself, guarantees that tomorrow's load won't arrive late, a schema won't shift, or duplicate keys won't slip into the warehouse.
That's why modern programs treat quality as an always-on control layer. The control layer watches the incoming stream, checks it against expected behavior, and routes exceptions into remediation. In practice, this means analysts and business users don't become the first alarm system.
Practical rule: if a data issue is only visible after a report is published, the quality process started too late.
Reactive quality versus proactive assurance
Reactive quality asks, “What broke?” Proactive assurance asks, “What needs to be true before we trust this table?” That difference sounds small, but it changes the operating model.
A reactive team spends its time fixing isolated incidents. A proactive team defines the boundary of critical data, sets thresholds, and monitors continuously. Industry guidance now treats data downtime as a core metric, alongside freshness, duplicate record percentage, table health, and transformation errors, because trust collapses when data is delayed, missing, or untrustworthy. Data quality metrics guide
The point is simple. If the dataset supports revenue reporting, compliance, or model inference, quality has to be engineered into the delivery path, not added after the fact.
The Six Core Dimensions You Need to Measure
A quality program starts with shared definitions. Without them, business teams say “bad data,” engineers say “failed checks,” and the underlying problem stays hidden, whether it is missing records, stale loads, or invalid values.
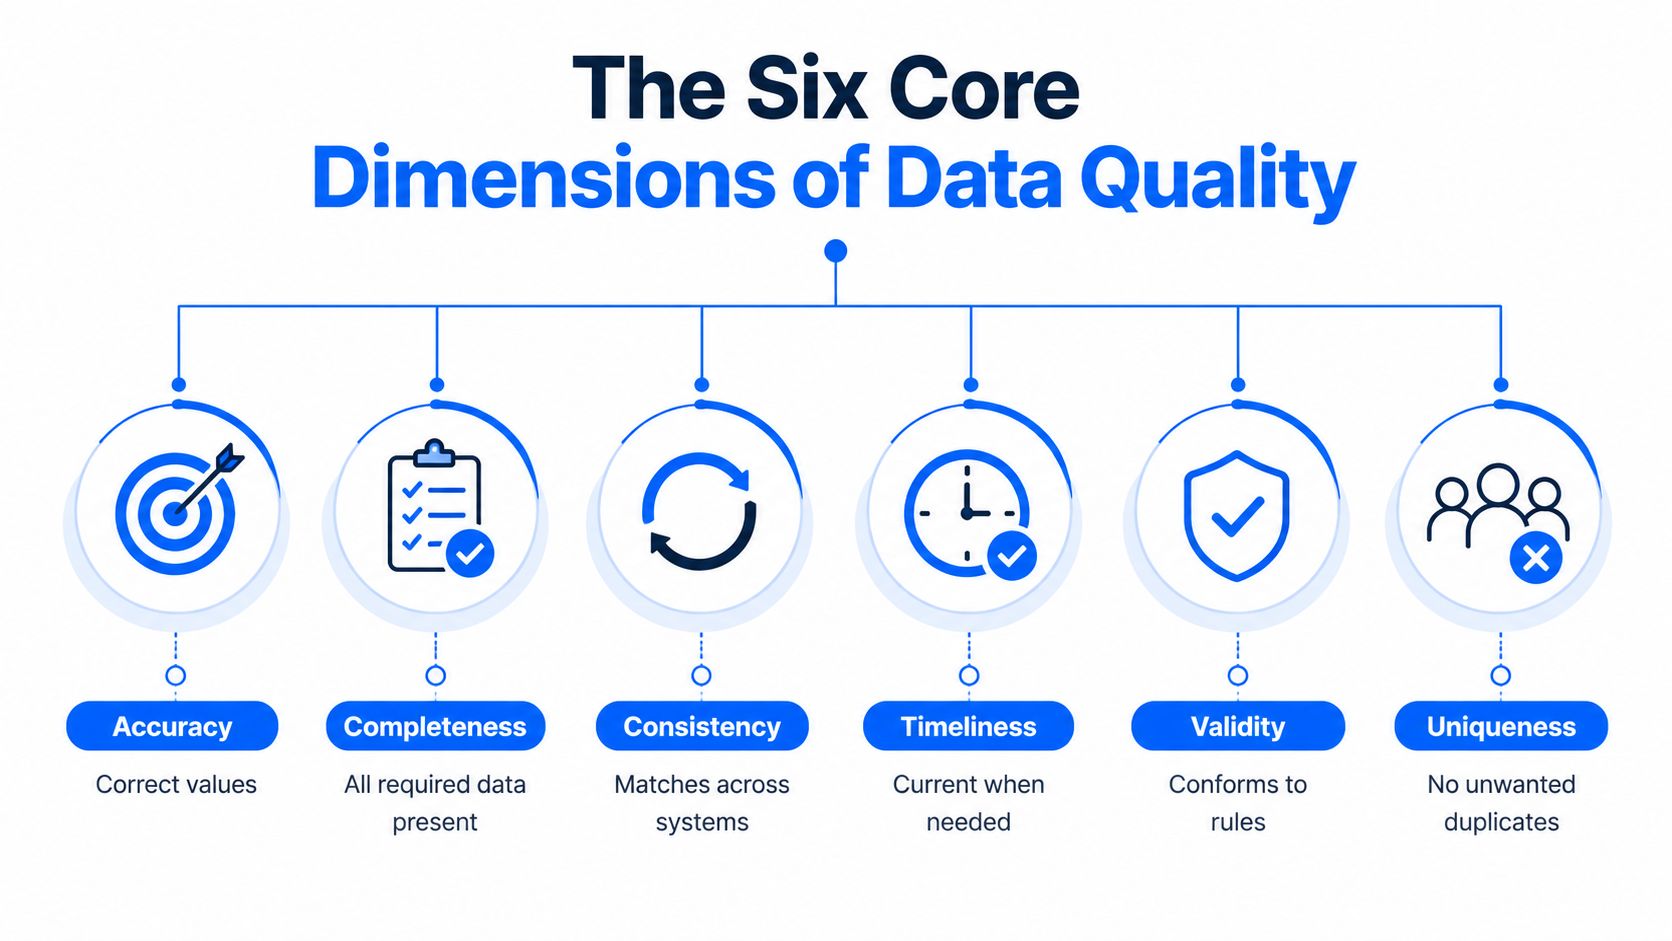
The older statistical framing still matters because it gives teams a durable way to describe quality: relevance, accuracy, timeliness, accessibility, comparability, and coherence. In enterprise systems, that language is usually translated into the six operational dimensions used most often today, accuracy, completeness, consistency, timeliness, uniqueness, and validity. The label matters less than the measurement behind it.
Accuracy, completeness, and consistency
Accuracy asks whether a value matches reality. A customer address can be perfectly formatted and still point to the wrong place, so format alone is not enough. The practical check is a rule or reference lookup against trusted source data.
Completeness asks whether required fields are present. The simplest measure is null rate per column, because missing values in a critical field carry more risk than missing values in a decorative one. A column that drives billing, compliance, or routing should be watched more closely than one used only for convenience.
Consistency asks whether values agree across systems or across fields. If finance says an account is active and operations says it is closed, one of those systems is out of step. Cross-field validation and reconciliation checks are the tools that surface that mismatch before it reaches a report or downstream workflow.
Timeliness, uniqueness, and validity
Timeliness asks whether the data is current enough to use. The operational measure is freshness, meaning the time since the last update compared with the expected arrival window. Statistics Canada also recommends producing output at regular, predictable intervals, such as the last day of the month or year, which turns delivery discipline into a process requirement. Statistics Canada Data Quality Toolkit
Uniqueness means you do not have unwanted duplicates. Detect it with unique-constraint violations or duplicate-key checks, then track the trend so repeat failures do not blend into normal load noise.
Validity means the value conforms to the rule set you defined. That rule set can be a format rule, a reference list, or a business constraint. Strong programs treat validity as an enforceable control, not a subjective review, because a value that is merely “plausible” can still break a downstream process.
One useful way to keep the model straight is to map each dimension to a control you can automate, trend, and assign to an owner. That makes quality measurable instead of abstract, which is what lets it function as an always-on control layer instead of a cleanup project.
Methods That Catch Problems Before Users Do
A dimension tells you what to measure. A method tells you where the control sits in the delivery chain. Teams usually stall when they describe quality in abstract terms but never decide which checks belong in the pipeline, which belong in monitoring, and which belong in CI.
The practical move is to treat data quality assurance like a control layer in an industrial system. Some checks stop bad rows at the gate. Others watch for drift after release. A third group catches changes in structure or delivery timing before a report, model, or downstream workflow consumes the data.
Four checks that catch most failures early
Record-level validation catches business-rule violations at the row level. If customer country must come from an approved list, or a postal code must match a known format, the record fails fast. Controls such as drop-down menus, look-up tables, reference lists, standardized ISO 8601 date formats, and built-in edits reduce the chance that bad input enters the system in the first place, which is the same logic behind strong front-door checks in regulated environments.
Anomaly detection looks for drift in row counts, value distributions, or learned patterns. Use it when the rule is “this table normally behaves like X,” but you do not want to hand-write every possible failure case. The same idea applies to unstructured and multimodal data, where modality-specific checks such as OCR character error rate and ASR word error rate help catch quality loss that never appears in a simple row-and-column test. Unstructured and multimodal quality review
Schema tracking catches the structural breakage that can derail downstream jobs without warning. New columns, removed columns, and type changes are the usual offenders. Data engineering guidance points to row-count changes, schema changes, primary-key uniqueness drift, and value-level changes as the high-signal checks that surface common silent failures after a code release or pipeline change. Data quality metrics guide
Timeliness monitoring compares expected versus actual arrival time. A feed can succeed technically and still arrive too late to trust, so the check has to watch both delivery and usefulness.
Layer the checks
Do not rely on a single method and assume it covers everything. Structural checks catch obvious regressions early. Statistical checks catch slow degradation that rule-based tests miss. Record-level checks catch policy violations, and freshness checks catch delivery failures.
The engineering pattern is to layer them. Start with the checks that protect the most critical decisions, then add depth where the cost of a miss is high. In practice, that means a critical customer feed might get row-level validation at ingestion, schema checks in CI, anomaly detection on daily volume and distribution, and freshness alerts tied to the SLA for the downstream team. That combination turns quality from a one-time cleanup task into an always-on safeguard.
KPIs and SLAs That Make Quality Enforceable
A check without a threshold is just a log line. Teams can admire it in a dashboard all day and still not know when to act.
The right boundary is the critical data element. That's the table, column, or feed that affects a business decision. Once that boundary is clear, the next move is to translate each quality dimension into a KPI with an owner, a target, and an escalation path. A metric only becomes operational when someone is accountable for it.
From metrics to targets
Industry guidance recommends profiling historical trends first, then defining tiered thresholds so teams can separate expected variation from true defects. That matters because a static alert line often creates noise in one season and blind spots in another. The more useful approach is to let the baseline teach you what normal looks like, then set the alert boundary around business risk.
KPI | Dimension | How It Is Measured | Typical Tier 1 Target |
|---|---|---|---|
Completeness rate | Completeness | Non-null rows divided by total rows | Close to full coverage for critical fields |
Uniqueness rate | Uniqueness | Distinct keys divided by total keys | No duplicate keys in Tier 1 tables |
Freshness | Timeliness | Time since last successful update | Within the agreed delivery window |
Data downtime | Timeliness and trust | Time data is delayed, unavailable, or untrustworthy | Near zero for decision-critical feeds |
For a practical reference point, see the internal guide on data quality metrics and operational thresholds.
Make the KPI enforceable
A KPI needs four things to matter in production.
Owner: one team or person who responds when it moves.
Target: the line that separates acceptable from unacceptable.
Escalation path: who gets notified if the target is missed.
Review cadence: when thresholds get tuned as data patterns change.
Operational truth: if nobody can name the owner of a failed KPI, the KPI is decorative.
A lot of executive reporting works better with a single roll-up score, but engineering still needs the underlying signals. Keep the score for leadership, keep the dimensions separate for remediation, and don't let the aggregate hide a bad table.
A Six-Phase Implementation Roadmap
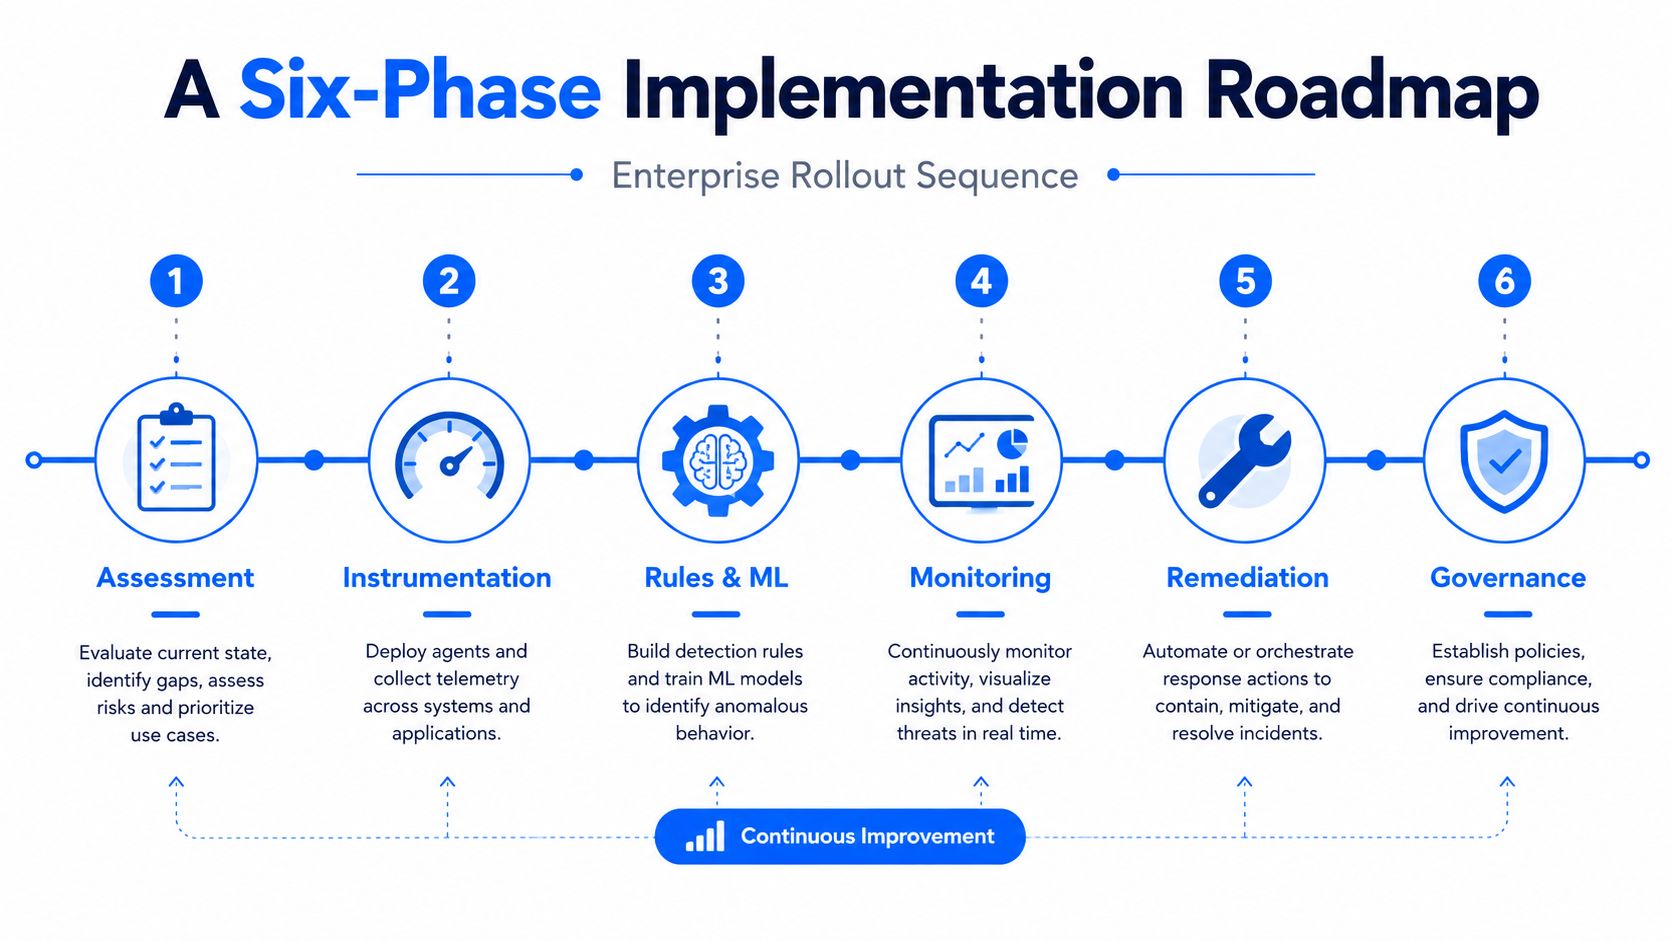
Enterprises usually fail at data quality for a boring reason. They jump straight to tools and skip the operating model. The rollout works better when each phase has a deliverable, an owner, and a success measure.
Phase 1 through Phase 3
Assessment starts with profiling, critical data element selection, and a pain-point inventory. The owner is usually the data platform or governance lead, with business input on what matters most. Success looks like a short list of high-risk tables and a clear map of where the incidents come from.
Instrumentation adds in-database metric computation and baseline learning. That gives you the factual baseline needed for alerts, trend analysis, and seasonal behavior. The owner is typically data engineering, because this phase depends on execution inside the pipeline or warehouse.
Rules and ML combines business rules with anomaly detection. Some problems need explicit validation, while others need learned behavior to catch drift or late-arriving changes. The success measure here is simple, the checks are mapped to real failure modes instead of being duplicated across teams.
Phase 4 through Phase 6
Integration wires the checks into pipelines, orchestrators, and CI/CD paths so bad data does not move downstream undetected. Automation routes alerts into tickets or chat workflows and gives users a way to remediate without opening three separate systems. Governance closes the loop with ownership, review cadence, and policy enforcement so the program doesn't fade after launch.
The best implementation plans also include a baseline learning period. That avoids overreacting to normal volatility and gives teams a practical starting point for threshold tuning.
A recent best-practices guide recommends reviewing and tuning alert thresholds monthly, which is a useful cadence for keeping signal quality high as datasets change. Data quality best practices
How a Modern Observability Platform Operationalizes the Program
The easiest way to turn the roadmap into a repeatable system is to stop treating quality as a pile of scripts. A modern observability platform folds monitoring, validation, and baseline learning into the delivery flow so the work stays continuous instead of manual.
A platform like digna does that with anomaly detection, timeliness checks, schema tracking, record-level validation, and in-database metric computation. It keeps execution inside the customer environment, which matters in regulated settings where data movement and vendor access are tightly controlled. It also gives engineers, analysts, and business users a shared interface for seeing the same signals without building separate monitoring layers. digna data observability
What the platform is doing under the hood
The useful part of this model is the combination. Baseline learning helps separate normal variation from genuine drift. Timeliness monitoring catches delays before a dashboard goes stale. Schema tracking protects downstream jobs from structural breaks. Record-level validation keeps business logic enforceable.
That combination reduces reliance on hand-crafted rule libraries and on specialist teams who spend their days babysitting checks. It also fits the enterprise reality where warehouses, lakes, and pipelines all need coverage, but no one wants another shadow stack.
A useful test: if the platform can show the trend, the delay, the structural change, and the row-level violation in one place, the incident gets easier to route and faster to fix.
Why deployment model matters
Private cloud and on-prem deployment are not cosmetic features in this category. They're part of the control story. Customer-controlled execution keeps sensitive data inside the environment and supports the kind of governance teams need in finance, healthcare, telecom, and public sector deployments.
The point isn't that one platform solves every quality problem. The point is that the platform can turn the operating model into something durable, visible, and repeatable.
Common Pitfalls and How to Avoid Them
The hardest part of data quality assurance is not writing checks. It's keeping the program useful after the first wave of enthusiasm wears off.
Five failures that show up again and again
Rule overload happens when teams write dozens of brittle checks for every edge case. The symptom is maintenance pain and a rule library nobody trusts. The fix is to prioritize business-critical rules and let anomaly detection cover the patterns that shouldn't be hard-coded.
Alert fatigue shows up when every threshold is too tight. The symptom is ignored notifications. The fix is tiered thresholds, baseline learning, and monthly tuning so the alert line follows real data behavior instead of a guess.
Missing ownership turns every issue into a cross-team argument. The symptom is that no one owns the failed feed, so everyone gets dragged into the incident. The fix is a named owner for every critical data element and a clear escalation path.
Schema blindness means the program watches values but misses structural changes. The symptom is a pipeline that looks healthy while a column type change breaks downstream logic. The fix is explicit schema tracking on every critical table.
Treating quality like a one-time project is the most expensive mistake. The symptom is a clean launch and a messy month three. The fix is to run quality as a continuous control with review cadence, threshold tuning, and governance.
Keep the program from drifting
The easiest way to keep quality alive is to tie every check back to a decision. If no one depends on the table, don't overbuild for it. If the table drives revenue, compliance, or models, it deserves stricter controls and faster escalation.
The quality program gets easier to defend when the business can see the link between the issue, the KPI, and the impact. That's what turns a technical checklist into an operating discipline.
Practical Checklists, Workflows, and Quick Answers
A rollout starts to work when the team can answer three questions without a long meeting: what matters, what to watch, and what happens when it breaks.
Starter checklist
Select the table first: begin with the feed that drives the most visible business action.
Define the critical fields: mark the columns where missing, invalid, or late data creates risk.
Set one baseline: capture normal row counts, freshness, and value behavior before writing alarms.
Assign one owner: every critical dataset needs a named response path.
Pick one review cadence: monthly threshold tuning keeps the program from drifting.
Separate signals from scores: keep the executive roll-up, but preserve the raw metrics for engineering.
Sample workflow for a new critical data element
Profile the data. Check completeness, uniqueness, and obvious validity issues first.
Write the rule. Translate the business requirement into a technical test.
Set the KPI. Decide what measure will represent success in production.
Choose the threshold. Use historical behavior if you have it, then tighten or loosen based on business tolerance.
Route the alert. Send it to the right owner with a response path.
Review monthly. Tune the threshold, retire noisy checks, and add new ones only where the risk justifies it.
Quick answers teams usually ask
Which tables should we monitor first? Start with the ones that affect reporting, compliance, or model inputs. Those are the tables where a failure creates visible cost fastest.
How do we set thresholds without history? Start with a conservative baseline, then tighten after you've observed normal variation. That's better than pretending you know the pattern before you do.
How do we balance downtime against cost? Use the business impact of the table, not the convenience of the tooling team. A stale feed for a regulatory report deserves faster action than a low-use internal lookup table.
How do we measure ROI? Tie the program to fewer broken decisions, less manual checking, and faster detection. If the team can point to fewer surprise incidents and less time spent hunting root causes, the program is doing real work.
digna helps teams run data quality assurance as a live control layer, with anomaly detection, record validation, schema tracking, and timeliness monitoring inside customer-controlled environments. If you're trying to move from cleanup work to an always-on program, visit digna and see how it supports the same operating model covered here.