Data Pipeline Monitoring: Metrics & Smart Alerting
|
5
min read

You can have three green dashboards and still wake up to a broken board pack, a missing finance feed, or a BI report nobody trusts. That's the annoying truth of data pipeline monitoring. The job isn't to stare at more charts, it's to know, early enough, whether the data is late, malformed, drifting, or about to break something downstream.
In Europe, that pressure is sharper because monitoring isn't just a technical habit. Spain's Digital Spain 2025 plan, launched with a €2.5 billion budget, put data and interoperability at the centre of public infrastructure, and the EU Data Governance Act added another layer of trust and access expectations for data flows across organisations, which means pipeline controls now sit inside a wider governance story, not outside it. The policy backdrop here is becoming impossible to ignore, especially when timeliness, schema consistency, and traceability are business requirements as much as engineering ones.
Beyond the 3 AM Fire Drill
At 3 AM, the first clue is usually a message from someone who doesn't care about your DAG status. Finance wants numbers. Ops wants answers. The dashboard is broken, the pipeline says success, and the logs are scattered across three tools that each insist they did their job. That's the kind of night that turns a decent engineer into a permanent incident responder.
The fix isn't “more alerts”. It's a shift from reactive monitoring to observability. The practical goal is to see the failure before a person in the business feels it, which means tracing data timeliness, schema changes, and delivery gaps end to end. In regulated European environments, that shift matters even more because the question isn't only “did the job run?”, it's “did the right data arrive, in the right shape, where it was supposed to be?”
Practical rule: if the alert only tells you compute is healthy, you're not monitoring the pipeline, you're monitoring the server.
That's why this problem has moved from ops hygiene to governance. A useful starting point is a broad reliability checklist, and if you need a baseline for thinking about pipeline risk, this data reliability checklist for data teams is worth keeping handy while you design your own monitoring rules.
What to Actually Monitor in Your Pipelines
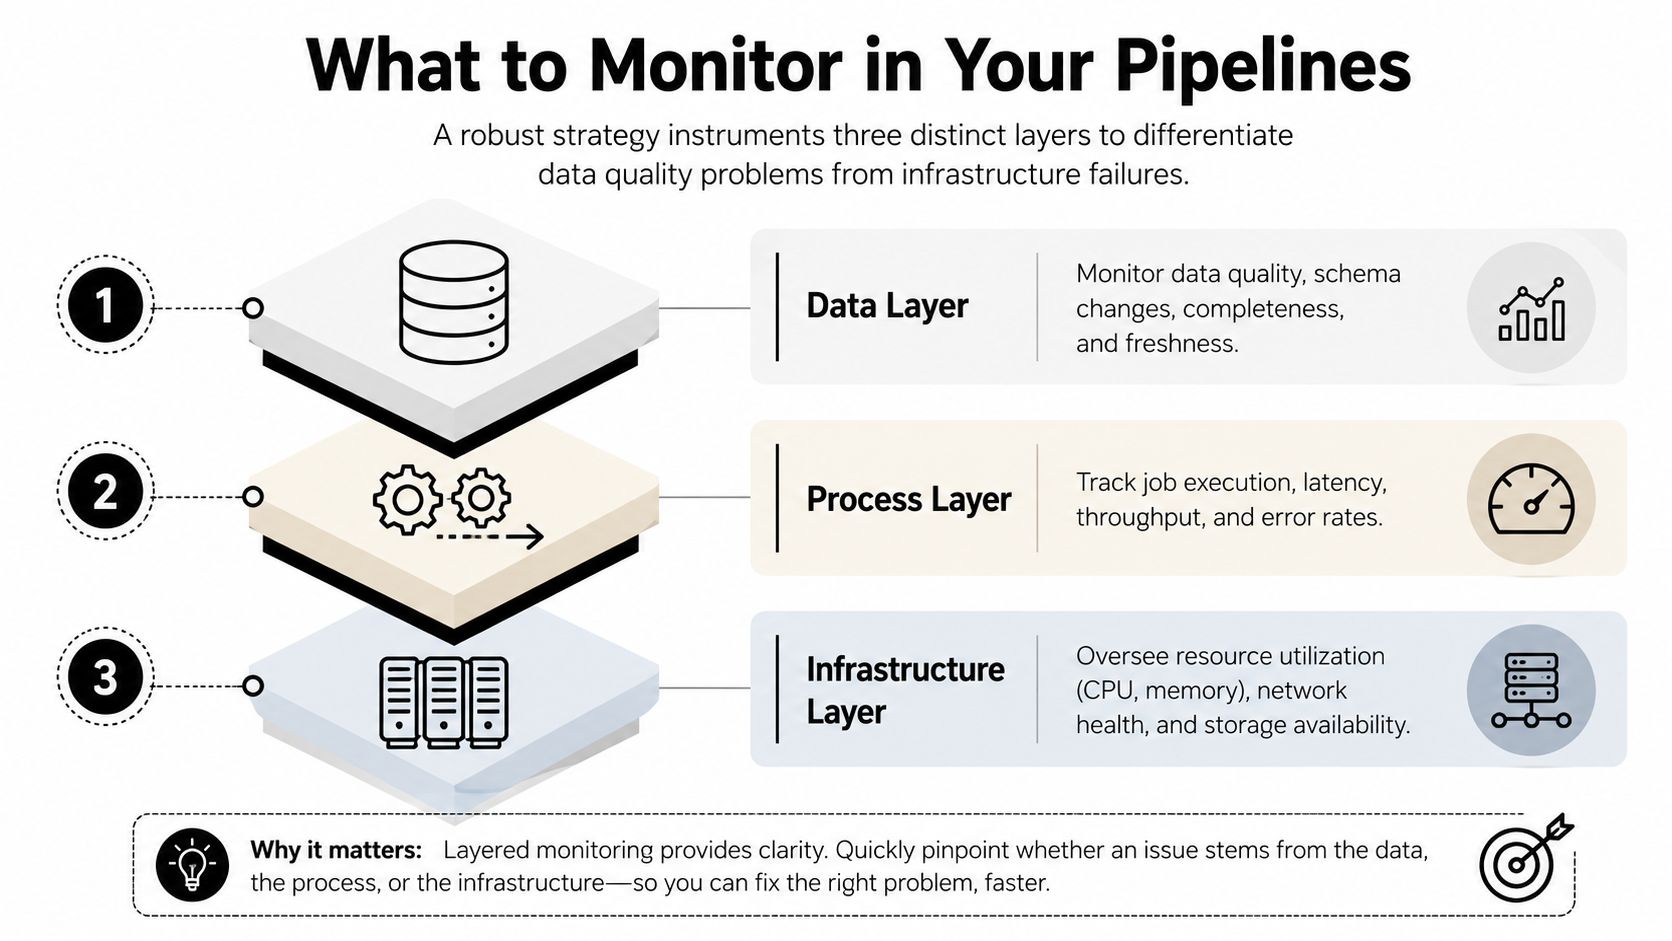
A pipeline is easiest to debug when each signal belongs to a clear layer. If you mix data quality, job execution, and cluster health in the same bucket, you'll spend half your life asking whether the issue is in the source, the transform, or the platform. The cleaner move is to instrument three layers at once, then decide what failed without a scavenger hunt.
Data Layer
Silent damage usually begins at this point.
Freshness timestamps tell you whether the data arrived late, which matters when reporting and downstream SLAs are sensitive to timing.
Record counts catch drops and duplications, but the stronger signal is trend behaviour over time, not a single threshold.
Schema drift exposes added, removed, or retyped fields before BI models and transformations start failing.
Null rates and distribution anomalies reveal corruption that still looks “successful” at the job level.
Expected delivery time versus actual arrival is especially useful for feeds that arrive on schedules, because it spots lag before humans see a stale dashboard.
Process Layer
Orchestration problems often surface.
Run duration helps you spot creeping slowness before jobs begin overlapping.
Latency between stages shows whether one task is backing up another, which is often the first sign of dependency trouble.
Error rates by task separate a flaky transform from a source outage.
Unique run IDs make it possible to follow one execution across logs, alerts, and downstream impacts.
Time since last successful run is one of the fastest sanity checks when a team starts asking why a table hasn't moved.
Infrastructure Layer
This layer matters, but it shouldn't be your only layer.
CPU and memory help you catch resource pressure before jobs fail outright.
Disk I/O and storage availability matter when loads slow down for reasons that look like data issues.
Network health can explain why ingestion stalled even though code didn't change.
Platform-level failure signals are useful as a guardrail, but they won't catch a clean-looking job that wrote bad data.
If you need a reference point for the kinds of data quality checks that belong in the first layer, these data quality metrics are a good way to translate abstract “quality” into actual observability signals. And if you're normalising messy domain feeds, the same principle applies whether you're dealing with finance or normalising esports data for CS2, the structure of the data matters more than the label on the source system.
Choosing Your Observability Stack
The build-versus-buy decision gets messy fast when privacy enters the room. A DIY stack built from orchestration logs, warehouse queries, and custom alert rules can work, but it gives you more code to own, more tuning to maintain, and more places for the monitoring layer itself to break. That's tolerable for a small team with simple flows. It gets painful in finance, healthcare, public sector work, and any setup where data residency carries significant weight.
The bigger issue is architecture. A lot of legacy monitoring tools still want metadata, extracts, or samples pushed into the vendor's environment. That's fine until the dataset is sensitive, regulated, or not supposed to leave the customer-controlled boundary. For European enterprises, that's the wrong default. Monitoring should live where the data lives.

In-database observability changes the shape of the problem. Platforms such as digna automatically calculate data metrics in-database, learn baselines, analyse trends, and monitor schedules inside the customer environment. Its anomaly detection computes metrics such as Sum, Min, and value counts for every column, which means the system is looking at behaviour without requiring data movement. The implementation model is documented here, and the practical appeal is simple, the monitoring layer can fit the residency boundary instead of fighting it.
If your monitoring plan depends on shipping production data somewhere else first, you've already created the compliance problem you were trying to avoid.
There's also a governance benefit that gets missed in a lot of tooling conversations. In-database execution reduces operational friction, preserves auditability, and makes it easier to keep the control plane close to the data plane. That's a much better fit for European enterprises than a visibility layer that effectively becomes a data export pipeline.
Instrumenting Pipelines for Full Visibility

A pipeline only becomes monitorable when it emits the right metadata. Airflow, dbt, Spark, and similar tools won't magically give you root cause if your jobs don't log enough context to connect the dots. The cleanest pattern is to make every run traceable from the moment it starts, then attach quality metrics when the data lands.
A practical hourly sales feed
Take an hourly e-commerce sales load. The source lands orders, your transform enriches them, and a warehouse table feeds reporting. The first thing to add is a unique run ID that follows the job from ingestion through transformation and load. Without that, every incident turns into log archaeology.
Then log structured events at the start and end of each task. Capture the source snapshot, the target table, the row count in, the row count out, and any schema changes observed along the way. If the downstream dashboard suddenly shows fewer sales, you want to know whether the extract was thin, the transform dropped rows, or the load never completed.
What to emit every time
Run identifier for traceability across systems.
Stage timestamps so you can measure where time was lost.
Record counts before and after transformation to catch silent losses.
Schema metadata so new columns or type changes don't sneak through.
Validation results for business rules that matter, such as duplicate order IDs or missing customer keys.
The best implementation habit is consistency. If every pipeline emits a slightly different metadata shape, your alerting and dashboards become harder to query than the data itself. Standardise the event schema early, then keep it boring. Boring metadata is good metadata.
Historical behaviour matters too. Monitoring guidance from Astera is blunt about the problem with static checks, they create noise and miss gradual drift, so use historical baselines, not just hard thresholds, when you instrument the pipeline. A code-first path for pushing observability into your data jobs is useful if you want to wire this into development rather than bolt it on later.
Setting Up Smart Alerting and Dashboards
Static thresholds are easy to set and easy to regret. “Alert if row count drops below X” sounds tidy until the business changes, seasonality kicks in, or a source normally goes quiet on weekends. Then the alert channel fills with junk, everyone mutes it, and the one real incident gets ignored because the team has been trained to distrust the noise.
The better model is baseline-aware alerting. That means watching the shape of the data over time, then flagging a deviation from normal behaviour rather than a random number crossing a line. The difference is huge in operational life. A daily feed with lower weekend volume shouldn't page anyone. A sudden freshness delay on a regulated dataset probably should.

That's where AI-driven anomaly detection earns its keep. digna learns a dataset's normal behaviour automatically and flags deviations without manual rule maintenance, while also keeping historical observability context around each alert. The automation approach is laid out here, and the value isn't that it feels clever, it's that it cuts down the useless alerts that make teams stop paying attention.
A useful dashboard is a short one. It should show SLA status, freshness, drift, and current incidents at a glance, then let you drill into the failing table or job without hunting through five tabs. If the dashboard needs a spoken explanation every time someone opens it, it's already too complicated.
Rule of thumb: dashboards are for triage, not theatre.
For European teams, there's a second advantage here. Smarter alerting helps you stay selective, which matters when cloud usage and governance overhead are both growing concerns. You want monitoring that earns its place by surfacing actionable deviations, not by flooding the room with expensive certainty about irrelevant things.
From Alert to Resolution A Troubleshooting Workflow
An alert should start a diagnosis, not a panic. The first question is always blast radius, because one broken feed can poison one report or ten downstream consumers. The second question is whether the fault came from the source, the transform, or the delivery path. If you skip those questions, you end up debugging in circles.
The fastest workflow starts with the alert context itself. A good platform won't just say “anomaly detected”, it will show how long the metric has been trending, whether the pattern has happened before, and whether the issue is isolated or part of a broader dataset pattern. That kind of context is exactly what digna's alerting model provides, and it shortens the path from symptom to likely cause.
A simple order of attack
Check the alert context first. Confirm whether the issue is a sudden break or a slow drift.
Trace the run ID. Use it to follow the pipeline through central logs, task events, and downstream dependencies.
Inspect lineage and consumers. Find out which dashboards, models, or reports depend on the affected table.
Review recent code or configuration changes. Many failures come from an innocent-looking schedule change or schema update.
Compare against previous incidents. Repeated patterns usually point to an unstable source or a brittle assumption.
That sequence turns troubleshooting into a repeatable process. It also helps teams avoid the classic mistake of treating every incident as a one-off. If the same class of failure keeps returning, the issue is usually not the alert. It's the absence of a real dependency model.
The best operators keep one habit in mind, every alert has a history, even when the history is messy. Use it. Then use the run ID, the baseline context, and the downstream impact view to decide whether you're dealing with a data issue, an orchestration issue, or a pipeline design problem that needs fixing at the source.
If you're redesigning your monitoring for a regulated European environment, start with the boundaries, not the alerts. Map what must stay inside the customer environment, define the metrics that matter to each dataset, and then test an in-database monitoring layer against one live pipeline before rolling it out more widely. A practical next step is to review digna against your own residency, timeliness, and schema-drift requirements, then use a real production feed to see whether it surfaces issues before your users do.
For the expected-versus-actual arrival check described in the data layer, see how digna Timeliness monitors when data should arrive and flags late or missing loads.
Frequently asked questions
What should you monitor in a data pipeline?
Monitor three layers separately. The data layer covers freshness timestamps, record counts, schema drift, null rates and expected versus actual arrival time; the process layer covers run duration, latency between stages, error rates by task and run IDs; the infrastructure layer covers CPU, memory, disk I/O and network health.
Why is a unique run ID important for pipeline monitoring?
A unique run ID lets you follow one execution from ingestion through transformation and load, across logs, alerts and downstream impacts. In the article's hourly e-commerce sales example, it is the first thing to add, because without it every incident turns into log archaeology.
What metadata should every pipeline run emit?
Each run should emit a run identifier, stage timestamps, record counts before and after transformation, schema metadata, and validation results for business rules such as duplicate order IDs or missing customer keys. The article also recommends standardising the event schema early so alerting and dashboards stay easy to query.
Why are static thresholds bad for pipeline alerting?
Static rules like "alert if row count drops below X" break when seasonality kicks in or a source goes quiet on weekends, so the channel fills with noise and teams mute it. Baseline-aware alerting instead flags deviations from learned normal behaviour, catching gradual drift that hard thresholds miss.
How should you troubleshoot a data pipeline alert?
Start with the alert context to see whether it is a sudden break or slow drift. Then trace the run ID through logs, inspect lineage and downstream consumers, review recent code or configuration changes, and compare against previous incidents, since repeated patterns usually point to an unstable source.


