Trustworthy Analytics with a Business Intelligence Dataset
|
7
min read

The executive dashboard says revenue is climbing. Ten minutes into the meeting, someone notices that yesterday's extract never arrived. The figures are internally consistent, the visualizations render correctly, and the pipeline status is green, but the decision being made is based on stale information.
That failure starts below the dashboard. A business intelligence dataset is not just a table, export, or semantic model. It's a governed, observable asset whose accuracy, freshness, structure, meaning, and permitted use all determine whether the resulting insight deserves trust.
Table of Contents
The Reliability Reality of Modern Analytics
BI has always been more than reporting
Defining the Business Intelligence Dataset
The nine dimensions in practice
Governance and the Data Contract
From Rules to Reliability with AI
Use each method for the problem it solves
Managing Schema Drift and Structural Change
Classify the change before you assess the risk
Put structural checks beside value checks
Regulatory Requirements and Data Trust
Turn obligations into evidence
Enabling Safe AI and Self-Service Analytics
Assess fitness before publication
Building Your Observability Strategy
Start narrow and make alerts useful
The Reliability Reality of Modern Analytics
A reporting team can spend hours debugging a dashboard only to discover that the visualization tool did exactly what it was told. The underlying dataset loaded an incomplete partition, a source system changed a field definition, or an upstream job delivered data after the business deadline. Nothing looks obviously broken until someone compares the dashboard with reality.
That's why numerical accuracy alone is a weak definition of quality. A revenue table may contain correct historical values and still be operationally unfit if it arrives after the meeting where leaders decide whether to change pricing, staffing, or inventory. Reliability depends on whether the data is available, understandable, relevant, and ready when the decision requires it.

BI has always been more than reporting
The discipline has a long lineage. IBM researcher Hans Peter Luhn coined the term business intelligence in 1958 in an IBM Journal article. Decision-support systems became prominent during the 1980s, and business intelligence developed into a broader umbrella in the mid-1990s, covering reporting, querying, performance management, planning, online analytical processing, systems integration, and predictive analytics. Gartner estimated worldwide business-intelligence, analytics, and corporate-performance-management software revenue at $12.2 billion in 2012, after growth of 16.4%. Those historical milestones are summarized in the history of the BI and analytics market.
Modern BI environments reflect that evolution. They combine warehouse tables, operational feeds, metric definitions, transformation logic, and analytical models. A dashboard is only the visible surface of that system.
Practical rule: Treat every important dataset as a live product with an owner, service expectations, evidence of quality, and a response process when behavior changes.
Teams that adopt this view look beyond failed jobs. They monitor missing loads, unusual record volumes, metric drift, delayed partitions, structural changes, and conflicting definitions. That broader perspective is the foundation described in digna's guide to data reliability.
Defining the Business Intelligence Dataset
A business intelligence dataset is a governed information asset designed to support a defined decision or group of decisions. It can include source data, transformation logic, warehouse structures, semantic definitions, quality controls, lineage, access policies, and consumption surfaces such as dashboards, reports, models, and AI applications.
That definition matters because a dataset's fitness depends on its use. A weekly finance report and an intraday operations dashboard can use related data while requiring different freshness, completeness, and escalation thresholds. A dataset that's suitable for trend analysis may be unsuitable for automated decisions involving personal data or high operational risk.
Canada's government data-quality guidance identifies nine dimensions of information quality: accessibility, accuracy, coherence, completeness, consistency, interpretability, relevance, reliability, and timeliness. It defines timeliness as the delay between the period represented by the data and the point when users can access it. These dimensions are set out in Canada's data-quality guidance.
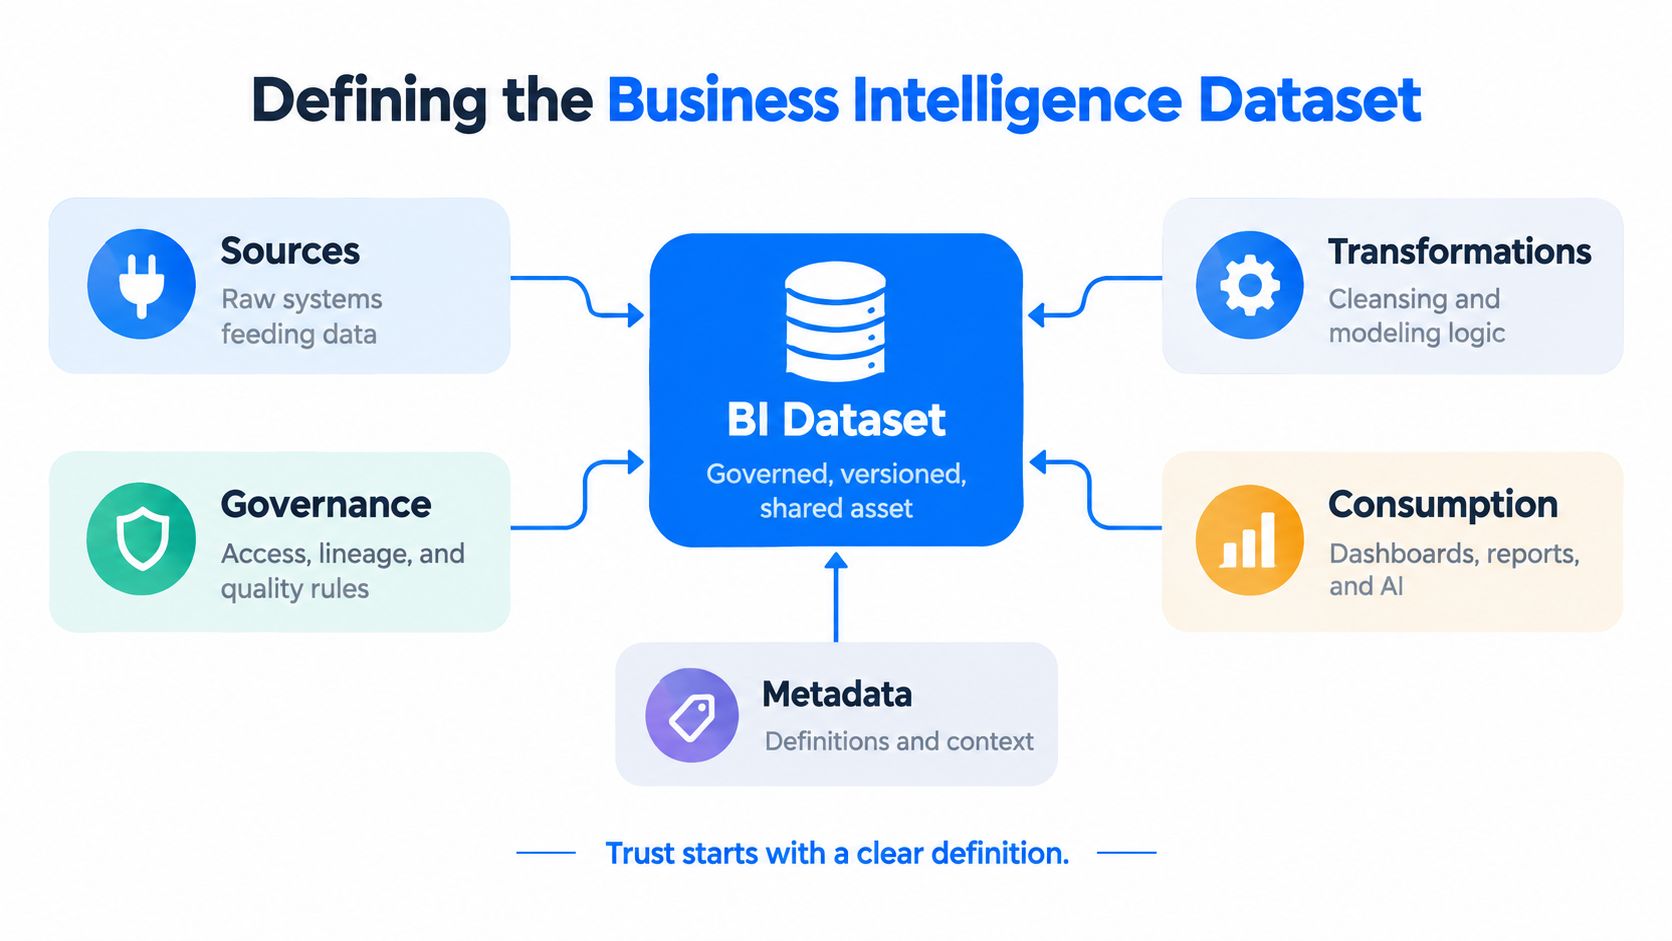
The nine dimensions in practice
These dimensions work together rather than forming a simple scorecard.
Accuracy asks whether values represent the real-world object or event.
Completeness checks whether expected rows, fields, or partitions are present.
Consistency checks whether the same business concept behaves consistently across systems.
Coherence concerns whether related values and relationships make sense together.
Interpretability requires clear definitions, units, codes, and context.
Relevance connects the dataset to the decision it's meant to support.
Reliability concerns repeatable performance and dependable controls.
Accessibility covers whether authorized users can obtain and use the data.
Timeliness measures whether data arrives within the decision window.
A practical implementation turns those ideas into observable measures. Track completeness for expected rows or attributes, validity for domain constraints, uniqueness for business keys, reconciliation against authoritative totals, and freshness latency from source-period time to warehouse availability. Store these measurements historically. A current pass or fail status won't reveal gradual degradation, recurring late deliveries, or seasonal volatility.
The result is a shared definition of dataset health. Fact and dimension table design still matters, but the tables are only one layer of the asset. Metadata, ownership, lineage, and quality evidence determine whether people can use them responsibly.
Governance and the Data Contract
A dashboard can be technically available while remaining operationally unsafe. An analyst may interpret a metric at the wrong grain, use data after its business cutoff, or miss a partial delivery because no producer has committed to what the dataset must contain. A data contract turns those assumptions into explicit obligations shared by producers and consumers.
The contract should travel with the dataset and change alongside it. Start by assigning a business owner who can settle questions about definitions and acceptable use, plus a technical owner who can trace sources, transformations, and delivery failures.
Record the decisions that users otherwise infer:
Purpose and approved use cases, including supported decisions and prohibited uses.
Metric definitions, covering formulas, grain, filters, currency or unit conventions, and late-arriving records.
Freshness expectations, tied to the business deadline rather than only the pipeline schedule.
Quality controls, such as completeness, validity, uniqueness, reconciliation, and timeliness checks.
Lineage and dependencies, from source systems through transformations to dashboards and models.
Change history and escalation, including alert recipients, approval for breaking changes, and consumer notification procedures.
A contract becomes useful only when its commitments match the decision. A regulatory extract may require traceability and complete coverage, while an operations view may depend more on arrival time and deviations from its normal delivery pattern. Applying one global quality score to both can conceal the failure that matters.
Governance also needs an operating model. A 2025 study reported that 41% of surveyed organizations had a formal governance organization, while 68% had difficulty finding reliable data and analytic content, according to Dresner Advisory's governance research. Another 2025 survey found an even split between centralized and federated governance preferences, with 36% choosing each model. These findings do not identify a universal winner. They show why ownership and stewardship require deliberate design.
Centralizing standards can reduce ambiguity. Centralizing every decision can create a bottleneck.
Federated teams can deliver quickly when shared definitions, minimum controls, and escalation paths are mandatory. The contract supplies the boundary: teams can manage local implementation while consumers retain predictable expectations. The data contract implementation guide provides a practical frame for making those agreements executable and keeping BI datasets reliable as multidimensional assets.
From Rules to Reliability with AI
Static rules are useful, but they don't scale as the only defense. A rule can assert that a value must be present, a date must fall within an allowed range, or a key must be unique. It can't easily understand that a familiar metric is behaving abnormally for this dataset, this season, or this operating context.
ITSV, the IT backbone of Austria's social insurance, illustrates the operational cost. Before implementing digna, ITSV managed data quality with 9000 hand-crafted rules in its data warehouse. More than 140 daily alerts flooded inboxes, most were ignored because their meaning was unclear, and only 25% of relevant data-quality cases were covered.
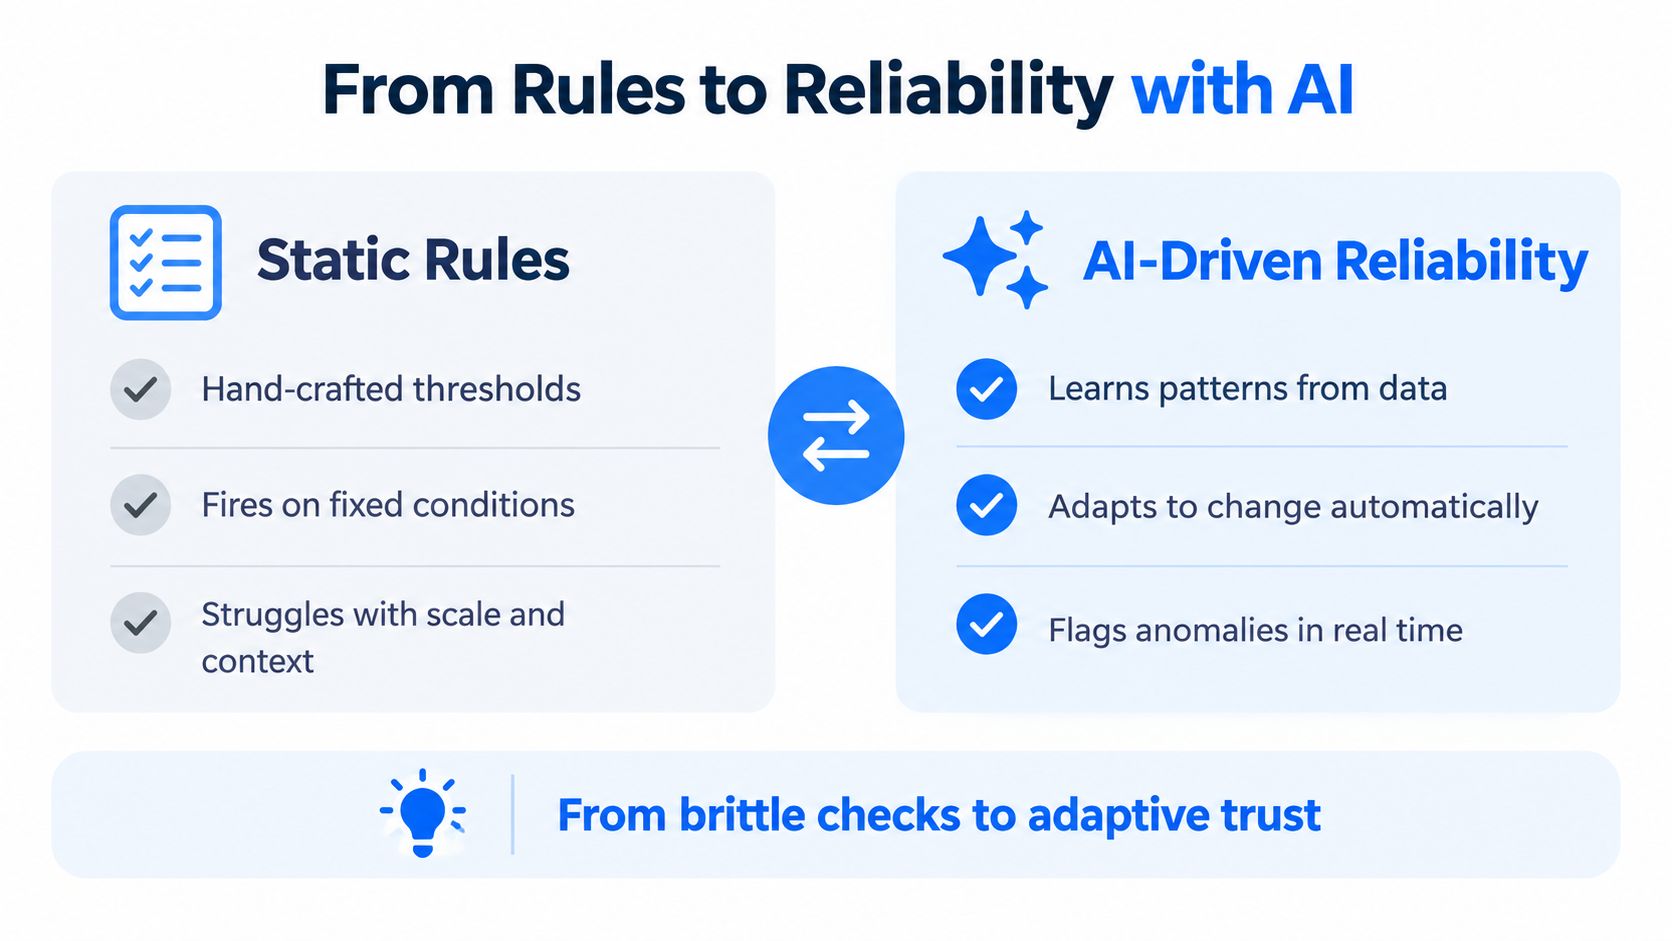
Use each method for the problem it solves
Static validation remains the right choice for hard constraints. If a transaction identifier must be unique, a jurisdiction code must belong to an approved set, or a required field cannot be null, deterministic checks are clear and auditable.
Behavioral monitoring handles a different class of failure. It learns the normal shape of a dataset and identifies unusual changes in volume, distributions, timing, volatility, or business metrics. That helps reveal a slow decline in populated fields, an unexpected shift in claim patterns, or an early delivery that indicates a source process has changed.
Monitoring approach | Works well for | Common weakness |
|---|---|---|
Deterministic rules | Hard business constraints and audit checks | High maintenance when conditions multiply |
Baseline learning | Unexpected behavior, drift, and temporal patterns | Needs context and review before action |
Hybrid monitoring | Critical datasets with both fixed rules and changing behavior | Requires clear ownership of each signal |
The practical answer is a hybrid. Keep deterministic checks for requirements that must never be violated. Add adaptive monitoring for behavior you can't describe with a stable threshold. Then route alerts with dataset, owner, impact, and evidence rather than sending another unexplained notification.
Teams working with machine-learning workflows may also benefit from Agenty's training data solution when preparing structured training inputs. Preparation doesn't replace ongoing monitoring, though. The dataset still needs controls after it enters production.
For teams evaluating AI-ready data practices, the central question isn't whether AI should replace rules. It's where automation can reduce maintenance while preserving deterministic controls for decisions that require explicit proof.
Managing Schema Drift and Structural Change
A pipeline can succeed technically while the business intelligence dataset becomes unusable. That happens when a source adds, removes, renames, or changes a field and downstream transformations continue running against an unexpected structure.
A recent schema-drift benchmarking study evaluated five change classes, column addition, deletion, data-type modification, renaming, and nested-structure changes, across 50 Airflow DAGs. The study reports that simple additions are easier to handle, while nested structural changes remain difficult. The findings are documented in the schema-drift benchmarking study.
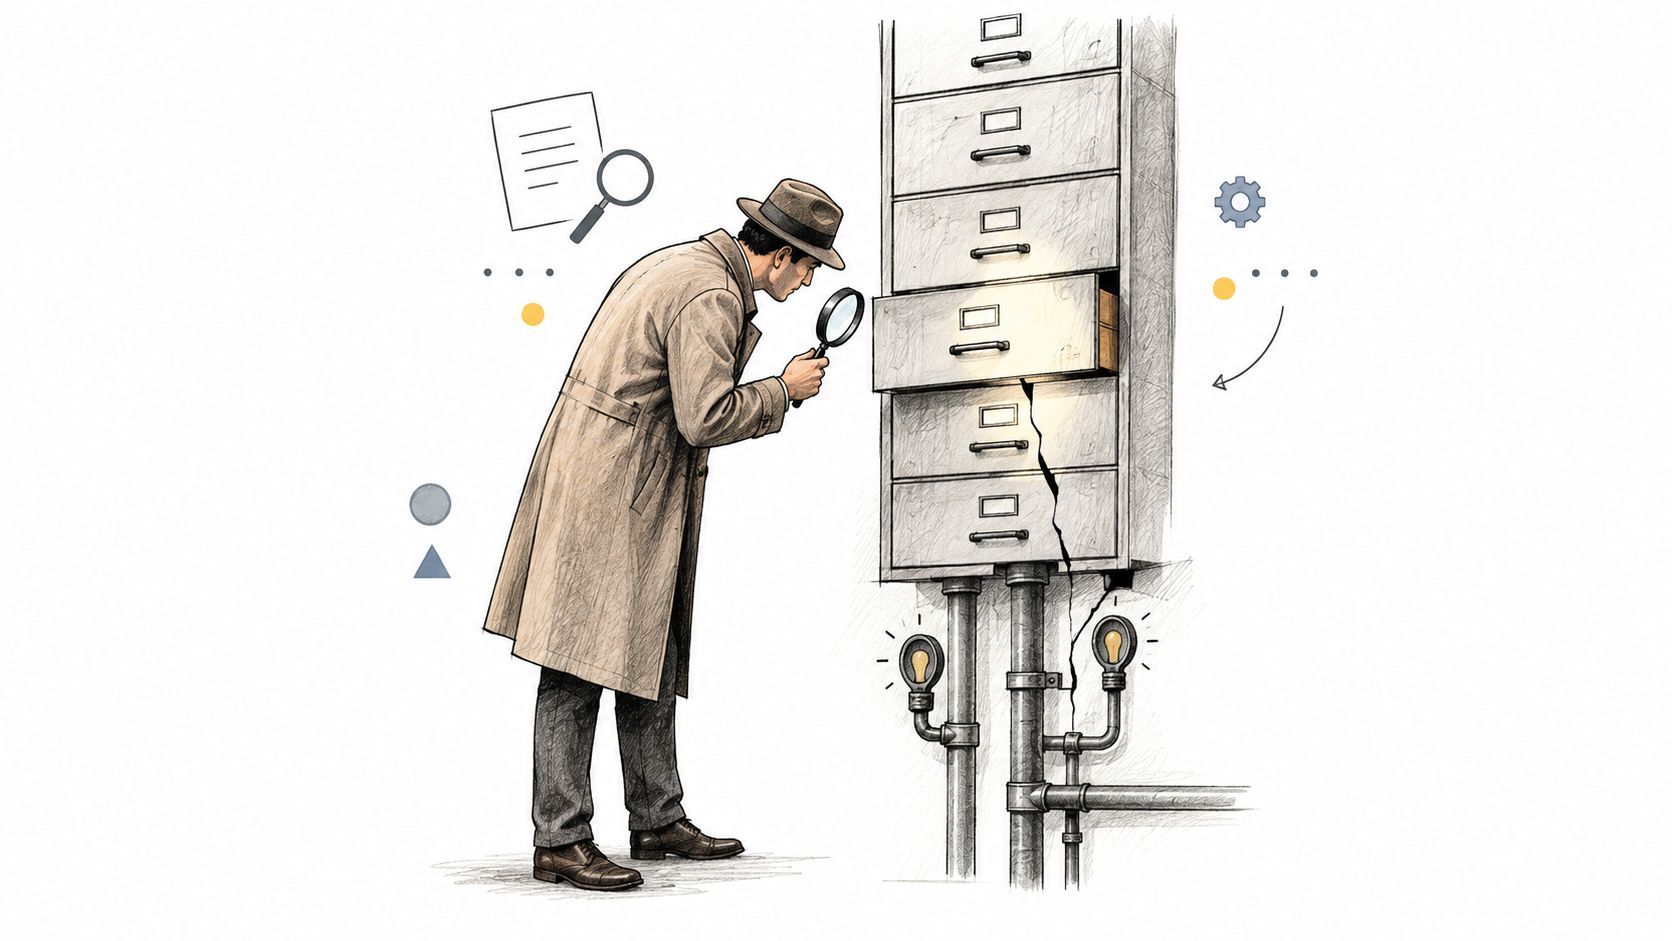
Classify the change before you assess the risk
An additive column is often backward-compatible, but not always. Wildcard projections can pull the new field into a transformation unexpectedly, and semantic layers may expose it before its definition is approved.
Deletion and renaming are more obvious threats. They can break joins, measures, filters, and calculated fields. Type changes can be quieter. A numeric field converted to text may trigger coercion, truncation, or failed aggregation, depending on the transformation tool.
Nested changes deserve special attention because conventional column-level checks may miss them. A nested object can be flattened, reorganized, or populated differently while the top-level field remains present.
The hardest category is semantic drift. The field keeps the same name and data type, but its meaning changes. A status code may adopt a new coding scheme, a timestamp may shift from local time to UTC, or a population may be filtered differently. The pipeline remains green while the metric becomes incomparable with its history.
Put structural checks beside value checks
Maintain versioned schemas and compare incoming metadata with the last approved structure. Test representative BI queries before promotion, and include affected tables, fields, old and new types, downstream dashboards, and owners in every alert.
Then check behavior. A field can retain its name and type while its distribution changes sharply. Structural monitoring catches the physical change. Value-distribution checks catch meaning and population changes that structure alone can't reveal.
Regulatory Requirements and Data Trust
A business intelligence dataset becomes part of the control system as soon as regulated reporting or operational decisions depend on it. It must preserve more than queryable records. Teams need evidence of how information was collected, transformed, validated, accessed, and corrected.
The European Commission identifies accuracy as one of the GDPR's seven core data-processing principles. Organizations must keep personal data accurate and up to date for its processing purpose, then correct inaccurate information. The Commission explains this requirement in its GDPR principles guidance.
That standard affects dataset operations directly. If a customer or patient record is wrong, the team should be able to identify when it was detected, which records and downstream datasets were affected, how the issue was assessed, who approved the correction, and when consumers received the fixed data.
Turn obligations into evidence
For personal data, accuracy checks belong beside controls for integrity, confidentiality, purpose limitation, data minimization, and storage limitation. A successful refresh proves delivery, not correctness. Records may still be stale, incomplete, or governed by an invalid code set.
EU financial entities also operate under DORA, which became applicable on January 17, 2025. The regulation requires internal governance and controls for ICT risk management. In practice, that places continuous monitoring, standardized incident evidence, resilience testing, and third-party risk management inside the normal operating model.
The control design can stay practical:
Validation evidence: Preserve record-level and aggregate results for critical rules.
Timeliness evidence: Capture the source period, expected delivery, actual arrival, and delay.
Change evidence: Retain schema versions, approvals, and downstream impact.
Incident evidence: Record detection, triage, remediation, and closure.
Access evidence: Connect dataset access and permitted use to documented ownership.
A dataset observability system should produce this trail as part of normal operation. Digna's in-database approach can keep checks and evidence close to the data, reducing the need to reconstruct events from separate logs. The resulting record can support an auditor, an incident review, or a business owner deciding whether a report was safe to use.
Enabling Safe AI and Self-Service Analytics
Self-service access multiplies what analysts can do, but availability isn't the same as fitness. An analyst may query a dataset with no stable definition, sensitive attributes, incomplete population coverage, or freshness that falls short of the decision's needs. In production, a BI dataset is a multidimensional reliability asset. Its safety depends on meaning, access, coverage, timeliness, structure, and observed behavior.
Research published in 2025 found that 60% of respondents considered self-service BI critical or very important, while 89% rated it at least important, according to the self-service BI research paper. The findings help explain why organizations keep expanding access. They do not make every accessible dataset suitable for every purpose.

Assess fitness before publication
A practical fitness review should establish:
Which decision will this support? Descriptive reporting, forecasting, and automated decisions have different tolerance for uncertainty and error.
Who and what does it represent? Check population coverage, missing groups, sampling limitations, and known exclusions.
What privacy risks remain? Removing direct identifiers does not eliminate the risk of adversarial re-identification.
Are definitions stable? Document measures, grain, units, coding, and time zones.
What evidence supports quality? Include validation history, freshness behavior, anomaly records, and unresolved limitations.
What triggers a review? Define changes in schema, distribution, population, or intended use that require reassessment.
Synthetic data can reduce exposure while weakening signals needed for rare events, subgroup analysis, tail risk, or exact operational relationships. It suits some development and testing scenarios, but cannot replace governed production data in every case.
AI systems also require reproducibility and human review. A model trained on a dataset whose meaning changed without notice can produce plausible outputs that no longer match the business process. Self-service users need equivalent context. Catalog documentation should identify the data's location, meaning, last reliable period, approved uses, and accountable contact.
Safe access combines permissioning, clear semantics, monitoring, and a defined human decision boundary. The goal is not slower experimentation but keeping convenience from becoming an untracked production dependency. Digna's in-database approach can connect these controls to the dataset itself, giving AI and analysts operational evidence alongside access.
Building Your Observability Strategy
A workable observability strategy starts with decisions, not tools. List the reports, models, and operational processes where wrong or late data would cause material harm. Map each dependency to its source, owner, freshness expectation, critical metrics, business rules, and downstream consumers.
Then implement monitoring in layers:
Anomalies: Learn normal behavior for volumes, distributions, business metrics, and platform signals.
Timeliness: Track expected delivery, actual arrival, missing loads, and early or late patterns.
Validation: Enforce deterministic record and aggregate rules where the business requirement is explicit.
Schema changes: Detect added or removed fields, renames, type modifications, and nested changes before promotion.
Start narrow and make alerts useful
Choose a small set of high-value datasets first. Establish a baseline, review the alerts with engineers and business owners, and remove signals that don't lead to action. An alert should identify the affected asset, explain the observed deviation, show the relevant history, and route to someone accountable.
The architecture matters too. In-database execution can reduce data movement and support environments where production information must remain inside the customer's cloud, VPC, or data center. A platform such as digna can combine anomaly detection, timeliness monitoring, record validation, business monitoring, and schema tracking while executing metric computation within the customer's databases.
Measure operational outcomes rather than dashboard count. Track time to detect, time to assess, time to resolve, recurring incidents, late deliveries, and the number of business-critical reports affected. IBM's 2025 Cost of a Data Breach study reported an average 241 days to identify and contain a breach, and organizations using AI and automation extensively had an average breach cost of USD 3.62 million, compared with USD 5.52 million for organizations that didn't use those technologies, according to IBM's 2025 breach-cost study. These figures concern breaches, not BI incidents, but they reinforce the value of automated detection and shorter response cycles.
For a practical explanation of the broader discipline, see what data observability means. The durable result is a dataset that teams can explain, monitor, challenge, and trust.
digna provides in-database data quality and observability for anomalies, timeliness, validation, business metrics, and schema changes across warehouses, lakes, and pipelines. Visit digna to assess how its modular monitoring can support accountable, reliable business intelligence datasets in your environment.
Structural change is one of the most common ways a trusted dataset quietly breaks. For a closer look at the mechanics, see why schema drift breaks data pipelines.
Frequently asked questions
What is a business intelligence dataset?
It is a governed information asset built to support a defined decision, not just a table or export. Besides the data itself it includes transformation logic, semantic definitions, quality controls, lineage, access policies and an owner, and together these decide whether the resulting insight can be trusted.
Which data quality dimensions matter for a BI dataset?
Canada's government data-quality guidance lists nine: accessibility, accuracy, coherence, completeness, consistency, interpretability, relevance, reliability and timeliness. They work together rather than as a scorecard. A revenue table can be perfectly accurate and still unfit if it arrives after the meeting where the pricing decision is made.
What belongs in a data contract for a BI dataset?
A useful contract names a business owner and a technical owner, then records purpose and approved uses, metric definitions, freshness expectations tied to the business deadline, quality controls, lineage, change history and escalation paths. Its commitments should match the decision the dataset supports, not one global quality score.
Are static data quality rules enough for BI?
Rarely on their own. Deterministic rules suit hard constraints such as unique keys or required fields, but they miss behavioral change. ITSV ran 9,000 hand-written rules, received more than 140 alerts a day and still covered only 25% of relevant cases. Combining rules with learned baselines works better.
How does schema drift affect BI dashboards?
When a source adds, removes, renames or retypes a field, pipelines can keep running while dashboards break or quietly change meaning. Semantic drift is the hardest case: same name and type, new meaning, such as timestamps moving to UTC. Pair versioned schema checks with value-distribution monitoring.


