Automatic Quality Control Explained for Reliable Data
|
7
min read

Your morning dashboard is green, yet the revenue trend looks wrong. A scheduled feed arrived late, a column changed type, or a source system altered the distribution of a field. The pipeline completed successfully, so the usual status check passed. By the time someone notices the business impact, analysts have already shared unreliable numbers and engineers are tracing the problem backward.
Manual review can't keep up with the volume and variety of modern data pipelines. Automatic quality control changes the operating model by watching data continuously, identifying meaningful deviations, enforcing essential rules, and giving the right people evidence they can act on. The consequences of leaving these failures undetected are described clearly in this overview of bad data quality consequences.
Table of Contents
Introduction Why Data Quality Breaks Without Automation
From inspection to continuous operations
The central design decision
What Automatic Quality Control Really Means
The statistical foundation
What the system watches
How Automated Checks Work From Rules to AI Detection
Rule-based validation
Statistical thresholds
AI and machine learning detection
Choosing the Right Check Type for Each Signal
Putting Automation Into Continuous Operation
Keep computation close to the data
Connect time, structure, and meaning
Benefits You Can Measure and Feel in Daily Operations
What changes for the team
Where Automatic Quality Control Delivers Value in Practice
Finance
Healthcare
Telecommunications
Public sector
Deciding When to Automate and How to Start With digna
Adoption checklist
Introduction Why Data Quality Breaks Without Automation
A data team might inspect a few critical tables after a release, confirm that a transformation ran, and move on to the next task. That process can catch obvious failures, such as an empty table or a broken job. It won't reliably catch a gradual shift in customer activity, a late-arriving source, or a valid-looking value that no longer makes business sense.
The problem isn't that teams lack tests. Modern environments combine warehouses, lakes, streaming systems, vendor feeds, transformation tools, and dashboards. Each layer can appear healthy while the result becomes less trustworthy. A successful pipeline run proves that code executed. It doesn't prove that the data still represents the business.
From inspection to continuous operations
Manufacturing offers a useful analogy. A final inspection can remove defective products, but sensors placed throughout the production line can identify process drift before defects accumulate. Data teams need the same feedback loop. Instead of treating quality as a gate at the end of a pipeline, they can monitor records, delivery behavior, structure, business metrics, and platform activity as part of daily operations.
That shift also clarifies ownership. A data engineer may need to investigate a schema change, an analyst may need to explain an unusual KPI movement, and a governance lead may need evidence that a control ran. Automatic quality control should connect those tasks rather than create another isolated report.
The central design decision
Automation doesn't mean replacing every rule with a model. Some signals should be learned from historical behavior, such as normal volume or expected delivery time. Other signals must remain deterministic, such as a required field, an allowed status, or a regulatory constraint.
The practical question is therefore precise: which conditions should the system learn statistically, and which conditions must it enforce exactly? The answer determines whether automation reduces noise or generates more alerts.
What Automatic Quality Control Really Means
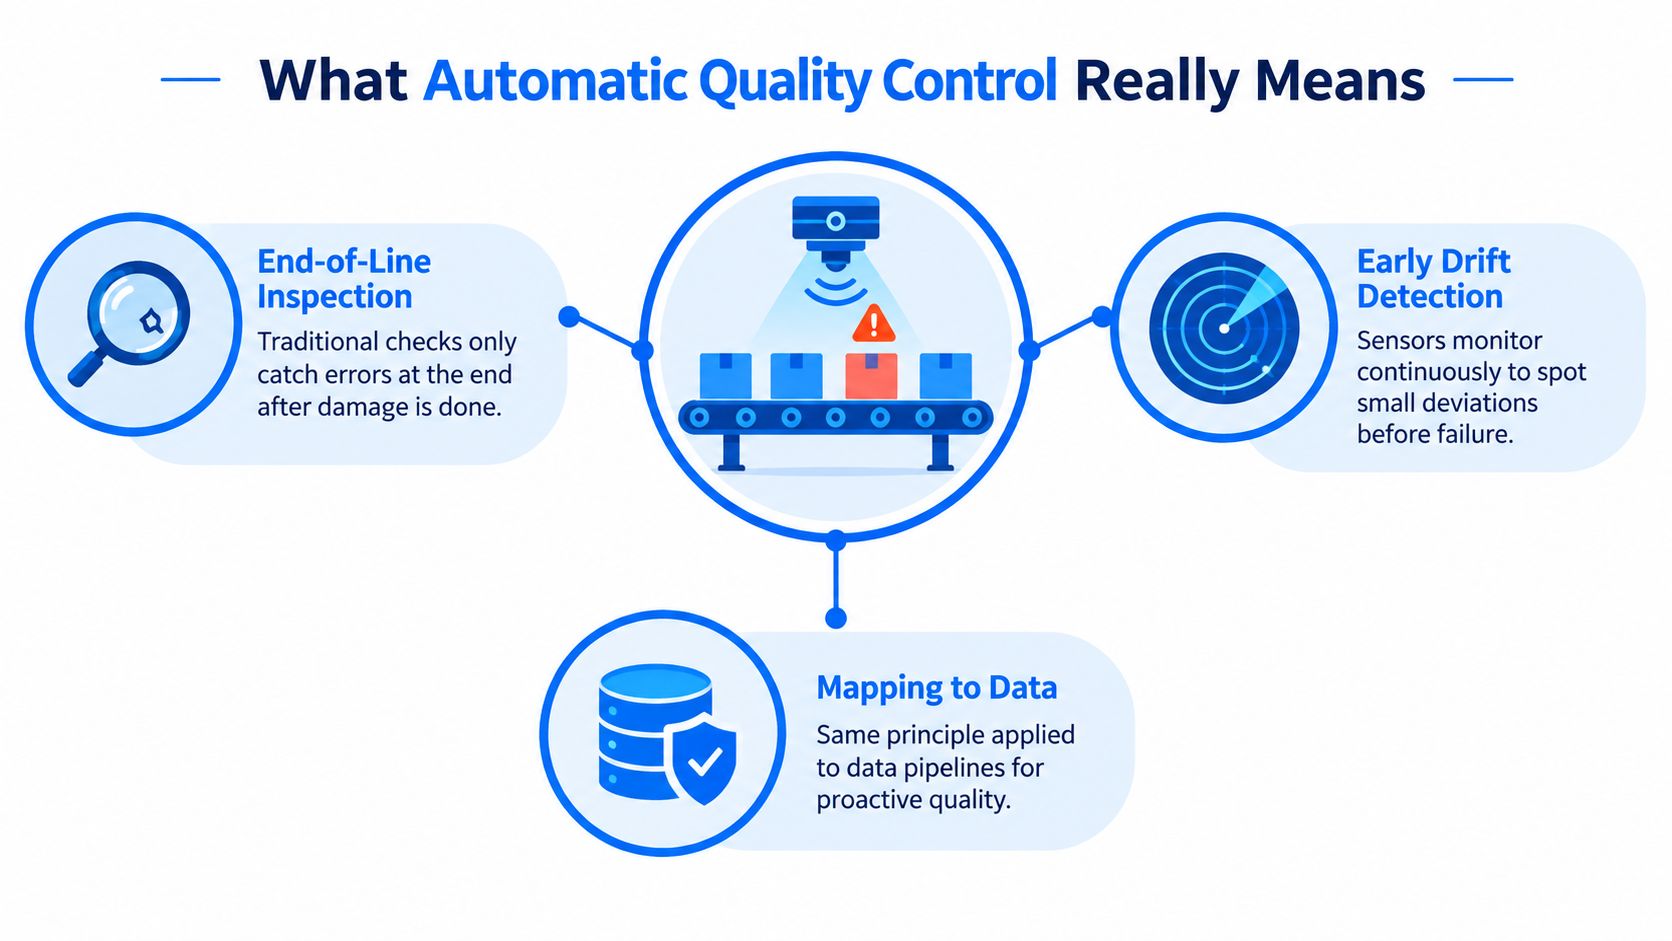
Consider a factory conveyor carrying identical parts. A sensor tracks temperature, weight, and position while a camera checks the surface. The system doesn't wait until the final box is packed to discover a problem. It compares current readings with expected behavior, flags unusual movement, and can stop or redirect the process before more defective parts pass through.
Data quality works the same way. A monitoring system observes tables and pipelines, establishes what normal behavior looks like, and checks incoming data against that baseline. It can also apply explicit validations when the organization has a rule that must always hold.
Automatic quality control is the continuous use of software to observe data behavior, enforce defined quality requirements, detect meaningful deviations, and route evidence to the people or systems responsible for action.
The statistical foundation
Statistical process control, or SPC, provides a helpful foundation. It uses control charts and measurement data to distinguish normal variation from special-cause variation, meaning a change that suggests something unusual has entered the process. In a normally distributed process, a commonly cited 3-sigma control limit puts the chance of a good part falling outside the band at about 1 in 1,000, while a 6-sigma limit reduces that probability to about 1 in 1,000,000 (SPC research on automated detection).
The lesson isn't that every data table needs a six-sigma rule. The lesson is that quality systems should detect drift early, rather than depend only on end-of-line inspection. A baseline gives the system context. Without context, a threshold may flag ordinary seasonality or miss a meaningful change.
What the system watches
Automatic quality control covers several layers of behavior:
Record quality: Required values, valid formats, ranges, reference values, duplicates, and business relationships.
Pipeline timeliness: Whether data arrives when users and downstream jobs expect it.
Schema stability: Whether columns are added, removed, renamed, or changed in type.
Business behavior: Whether revenue, transactions, customer activity, or another KPI moves outside expected patterns.
Platform behavior: Whether workloads, availability, consumption, or performance-related metrics change unexpectedly.
A single test can't cover all of these. The operational system combines measurements, rules, history, ownership, alerts, and remediation context. That combination is what turns testing into continuous control.
How Automated Checks Work From Rules to AI Detection
Three families of checks cover most automatic quality control designs. They aren't competitors in every situation. Each answers a different question, and the strongest implementations assign each signal to the method that fits its risk.
Rule-based validation
Deterministic checks are explicit and repeatable. A rule might require a customer identifier, reject a negative quantity, restrict a status to an approved reference list, or verify that a timestamp follows a required format. If the condition fails, the result is clear: the record or dataset violates a stated requirement.
Rules are particularly valuable for business logic, audit controls, and contractual expectations. They also make useful evidence because an owner can explain exactly what passed, what failed, and why. Their limitation is maintenance. A rule can't infer a changing baseline unless someone updates it, and an overly broad rule can create unnecessary operational work.
Statistical thresholds
Statistical checks ask whether a measurement has moved unusually far from its established behavior. The measurement might be row volume, null density, value distribution, or delivery time. Control bands can adapt to patterns that a fixed threshold would treat incorrectly.
The system still needs thoughtful configuration. A business metric may vary by weekday, release cycle, or reporting period. A baseline that ignores those patterns can over-alert. A baseline that's too permissive can miss a real issue.
AI and machine learning detection
AI-driven detection is useful when the data has complex relationships or when manually writing rules would be impractical. A model can learn patterns for a dataset and flag deviations in volume, distribution, or values. This doesn't make the result automatically correct. The model needs sufficient history, suitable monitoring, and a review process for false positives.
An ocean-profile benchmarking exercise demonstrates why test selection matters. Researchers evaluated 60 distinct automated checks and found that choosing an optimal subset was necessary because different quality-control rules trade off sensitivity against over-flagging (benchmarking automated quality checks). More tests don't automatically create better quality. They can create alert fatigue if the team can't distinguish a meaningful signal from ordinary variation.
Choosing the Right Check Type for Each Signal
Check Family | Best For | Strengths | Watch Outs |
|---|---|---|---|
Rule-based validation | Required fields, formats, ranges, reference lists, and business constraints | Clear pass or fail results, explainable logic, strong audit evidence | Requires maintenance when business requirements change |
Statistical thresholds | Volume, distributions, null behavior, and delivery patterns | Adapts to observed behavior and highlights drift | Can over-alert when seasonality or baseline quality is poorly understood |
AI detection | Subtle, multivariate, or changing patterns across datasets | Finds behavior that would be difficult to express as individual rules | Needs governance, review, and controls against opaque decisions |
The right strategy isn't to write fewer rules. It's to decide which signals deserve exact enforcement, which need adaptive thresholds, and which benefit from learned detection. For a practical explanation of anomaly detection in pipelines, see how AI detects data anomalies.
Putting Automation Into Continuous Operation
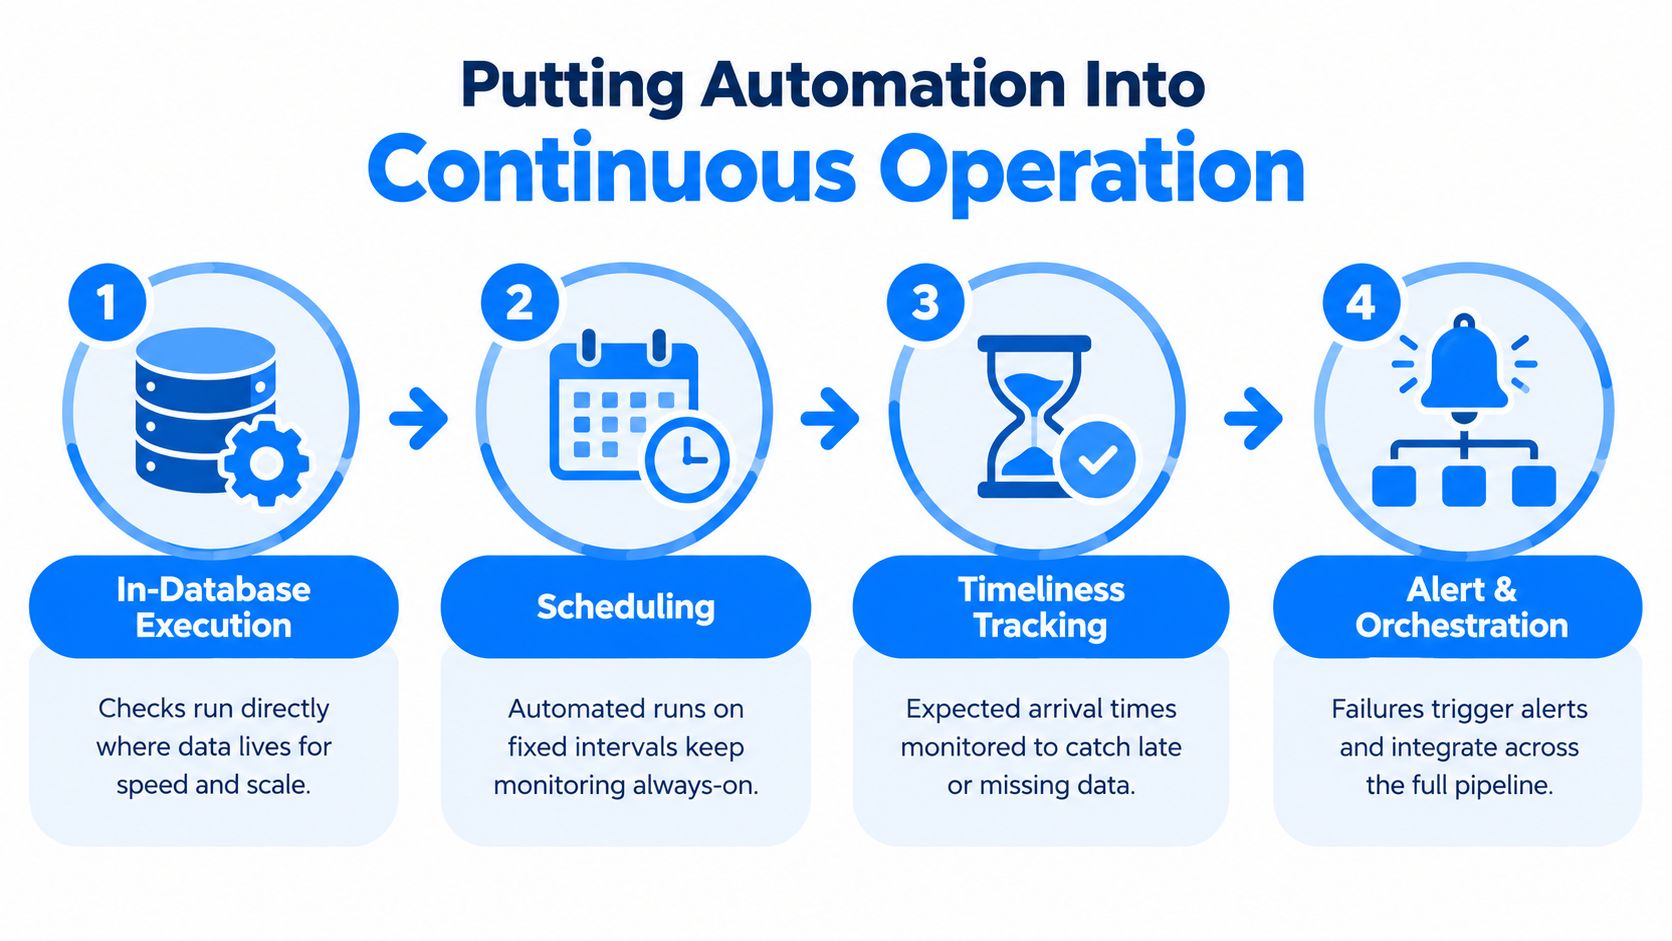
A collection of checks becomes useful only when it runs as an operational loop. The loop should observe the data where it already lives, run on a dependable schedule, compare actual behavior with expected behavior, and route failures to an owner with enough context to respond.
Keep computation close to the data
In-database execution lets teams compute metrics and perform analysis inside the customer's database. Data stays in place, which can reduce unnecessary movement and support privacy and governance requirements. This approach is especially relevant when production data can't be copied into an external monitoring service.
The design still needs access controls, logging, and clear separation between monitoring metadata and sensitive records. Local execution isn't a substitute for governance. It gives governance a stronger foundation because the organization can define where computation happens and what evidence leaves the environment.
Connect time, structure, and meaning
A reliable monitoring loop combines different forms of evidence:
Schedule the observation. Fixed intervals or pipeline events ensure checks run without someone remembering to start them.
Track expected delivery. Timeliness monitoring can learn expected arrival behavior and flag late, missing, or early data.
Detect structural change. Schema tracking identifies added or removed columns and data-type modifications before downstream consumers fail.
Watch business metrics. KPI monitoring connects technical data behavior to outcomes that business owners recognize.
Route the incident. Alerts should include the affected asset, the failed condition, the observed change, and the person or team responsible.
Survey evidence points to a strategy gap. SYNQ found “insufficient knowledge of how to test well” was the top data quality challenge, while the vast majority of teams relied mainly on built-in tests from their transformation tool and only about 10% used AI often in data quality workflows (SYNQ data quality benchmark survey). That suggests teams need operating guidance, not another test library.
A shared dashboard, data catalog, scheduler, and collaboration workflow can turn an alert into a managed incident. Engineers can inspect technical evidence, analysts can see business impact, and stakeholders can follow status without moving production data outside the customer's environment. More practical guidance on validation and ongoing controls is available in data validation rules and continuous data quality.
Benefits You Can Measure and Feel in Daily Operations
The most useful benefit of automatic quality control isn't the number of checks configured. It's the reduction in uncertainty during ordinary work. Teams can identify drift before a dashboard refresh exposes it, see whether a late feed caused a reporting gap, and distinguish a broken pipeline from a genuine business change.
Industrial vision systems show the value of inspecting continuously rather than sampling only at the end. Reviews of PLC-integrated vision-based quality control describe systems that capture every product image, classify defects in real time, and support 100% inspection at line speed. One reported integration achieved about 96.2% accuracy, with 95.4% precision, 96.8% recall, and a 96.1% F1-score (review of industrial vision-based quality control).
What changes for the team
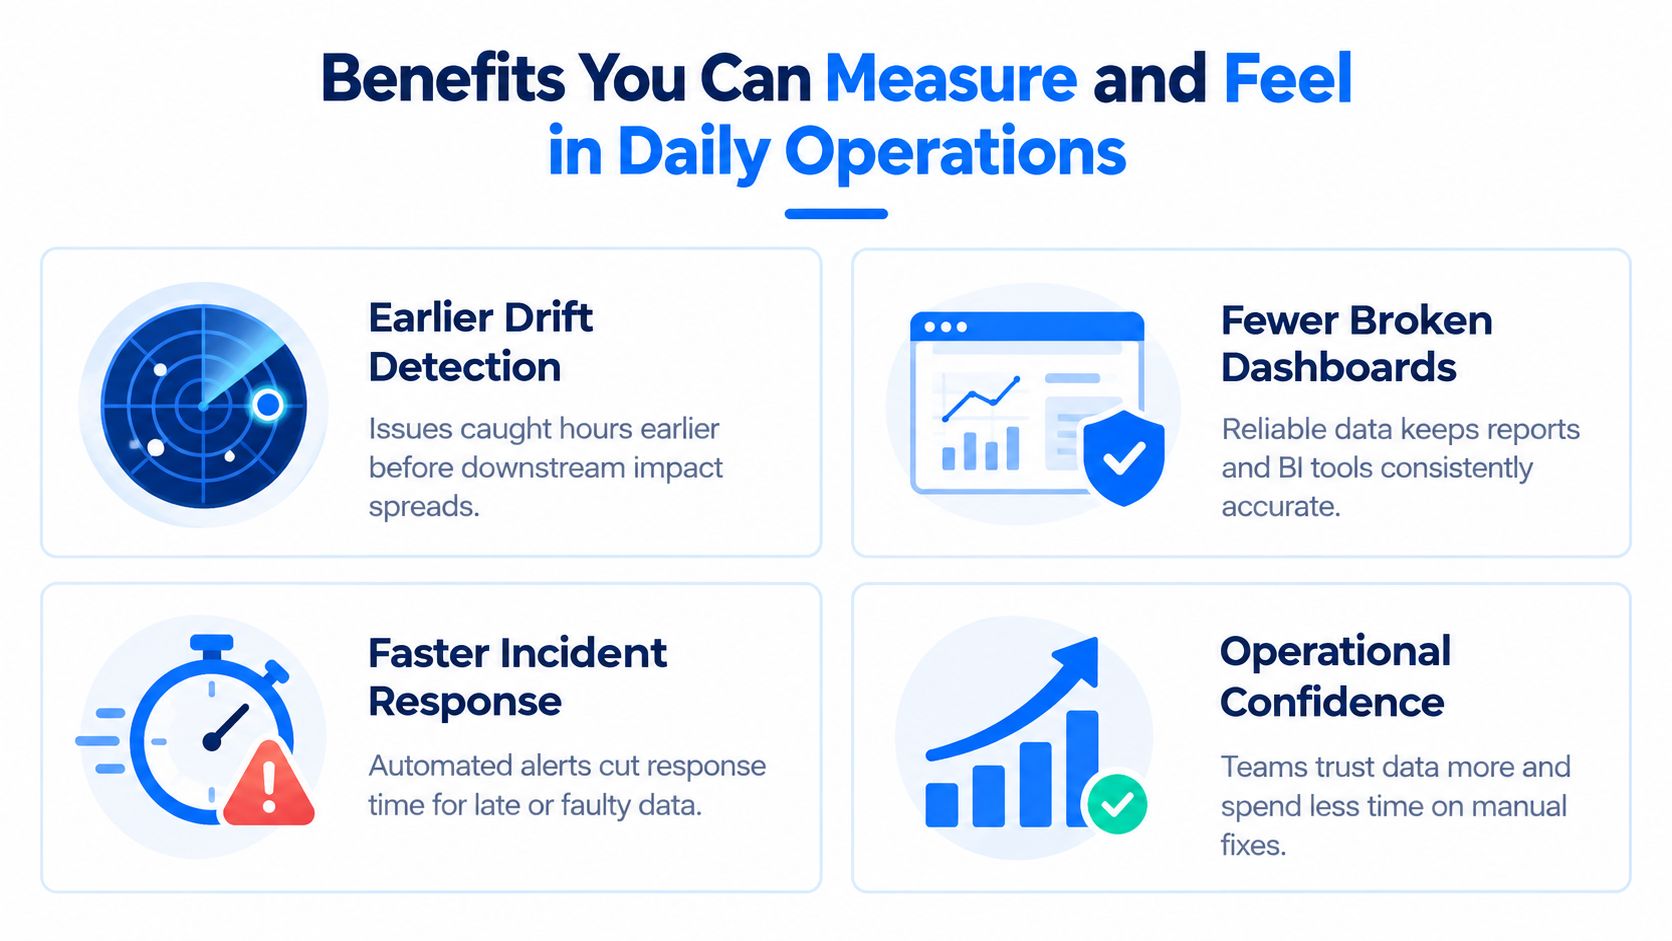
Earlier drift detection gives engineers time to investigate a source or transformation before downstream consumers multiply the impact. A small deviation becomes a visible event instead of a hidden assumption.
Fewer broken dashboards follows from monitoring both the data and the structure. A dashboard can remain technically available while showing stale or distorted information. Quality signals help teams identify that difference.
Faster response to missing loads comes from expected delivery tracking. Rather than waiting for an analyst to notice an empty report, the system can identify that a dataset hasn't arrived within its normal operating pattern.
Stronger compliance evidence comes from deterministic controls, execution history, ownership, and documented outcomes. Auditors and business owners need more than a green status. They need to know what ran and what happened.
For readers exploring the role of predictive data for QA, the broader principle is similar: historical behavior can help teams anticipate quality risks, but predictive signals still need clear action paths. Automation supports cost control, model reliability, and trust in analytics only when alerts are understandable and someone owns the response.
The practical outcome is confidence. Teams spend less time checking whether data exists and more time deciding what the data means. That benefit disappears if every alert is noisy, duplicated, or disconnected from a responsible team, so tuning and ownership remain part of the quality system. Further context on these operational outcomes appears in the benefits of data quality.
Where Automatic Quality Control Delivers Value in Practice
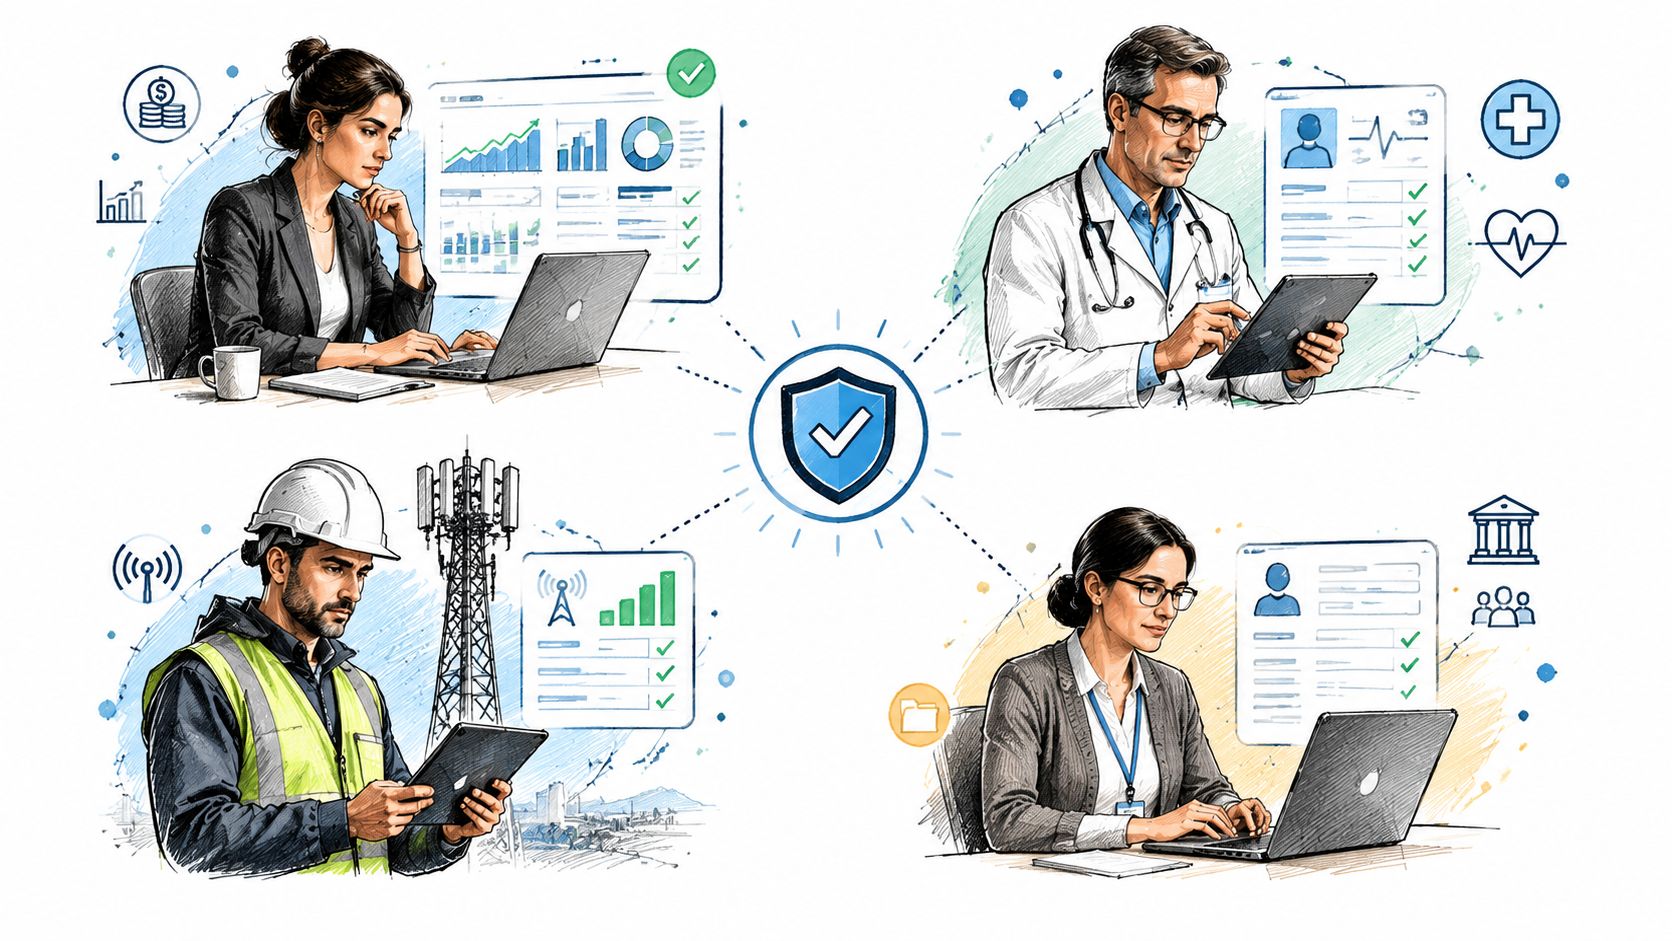
The same control architecture behaves differently across industries because the risks differ. A finance team may care about regulatory reporting and transaction completeness. A healthcare organization may prioritize clinical data reliability and privacy. A telecom operator may watch high-volume customer events, while a public-sector department may need consistent, traceable records for audits.
Finance
A risk feed arrives every morning and powers reports used by finance and compliance teams. A completed job doesn't guarantee that the feed contains the expected records or that a source change hasn't altered a critical field. Timeliness monitoring can identify a late arrival, deterministic validation can enforce transaction rules, and schema tracking can surface a structural change before reporting breaks.
Practical takeaway: start with the datasets that support regulatory, risk, or financial decisions, then attach explicit owners to every control.
Healthcare
A clinical operations team combines information from several systems. A missing field may affect interpretation, while a structural change can disrupt a downstream application without producing an obvious pipeline error. Continuous validation and schema monitoring provide a way to identify those conditions while keeping computation inside the organization's controlled environment.
Practical takeaway: separate privacy-sensitive data handling from monitoring evidence, and define which controls require deterministic proof.
Telecommunications
A telecom platform processes customer and operational events at high volume. Business owners may need to know whether an unexpected movement reflects actual customer behavior or a pipeline issue. Monitoring underlying business metrics alongside data availability and platform workload helps teams investigate the right layer.
Practical takeaway: pair KPI monitoring with platform observability so unusual business movement can be tested against operational evidence.
Public sector
Government data often moves between departments and systems with different ownership models. A control program must support consistency, traceability, and audit-ready evidence rather than rely on informal checks in individual teams.
Practical takeaway: document the rule, execution, result, and responsible owner for each critical dataset.
For regulated environments, deployment architecture matters as much as detection. digna can run inside a customer's private cloud, VPC, or data center, with computation performed in-database so organizations can limit data movement while maintaining a shared view of incidents, trends, and status.
Deciding When to Automate and How to Start With digna
Start with risk, not with the largest catalog of features. A critical dataset with frequent delivery expectations and several downstream consumers deserves attention before a low-impact table that few people use.
Use four questions to set the first scope:
Decision impact: What business, clinical, financial, or public-service decision depends on this data?
Failure visibility: Would users notice a failure immediately, or could it remain hidden?
Operational complexity: Does the data cross several pipelines, owners, or platforms?
Governance pressure: Do privacy, compliance, or audit requirements demand evidence?
A sensible first project targets one high-impact problem, such as anomaly detection or timeliness. Expand after the team understands alert quality, ownership, and remediation. Keep the rollout modular, with deterministic validation, schema tracking, business monitoring, or platform observability added where the risk justifies it.
Adoption checklist
Run locally: Keep computation inside the organization's cloud, VPC, or data center when data movement creates risk.
Use the database: Prefer in-database metric computation where security and scale require it.
Separate learned and fixed signals: Let baselines identify unusual behavior, while deterministic rules enforce obligations.
Record evidence: Store the control, run context, result, owner, and resolution history.
Connect the workflow: Integrate alerts with the scheduler, catalog, dashboards, and collaboration process.
Review false alarms: Treat alert tuning as an ongoing engineering responsibility.
A focused data quality implementation approach helps teams turn these decisions into an operating model. The goal isn't to automate testing for its own sake. It's to make quality a continuous, transparent process that engineers and business owners can trust.
digna provides modular monitoring for anomalies, validation, timeliness, schema changes, business metrics, and data platform behavior inside the customer's environment. Visit digna to evaluate a focused starting point and see how continuous automatic quality control can fit your data estate.
See how digna does this in practice: automated data quality monitoring where your data lives.
Frequently asked questions
What is automatic quality control for data?
Automatic quality control is the continuous checking of datasets without a person triggering it. It combines rule-based validation for requirements you can state exactly, statistical thresholds for measurable tolerances, and machine learning that flags deviations from each dataset's learned behaviour.
How is automated quality control different from manual checks?
Manual inspection samples data periodically and depends on who is available to look. Automation observes every load against a baseline, so coverage does not vary by shift and detection time drops from days to minutes — which is what determines how much damage an issue causes downstream.
When should you use rules and when should you use AI detection?
Use rules where the requirement can be written down: a column must not be NULL, a value must match a format, a table must arrive by a deadline. Use statistical and AI detection for everything you cannot enumerate in advance, such as a volume drop, a distribution shift or a load that drifts later each night.
Does automatic quality control require copying data to another platform?
It should not. Keeping computation close to the data means only metrics and metadata leave the environment, which matters wherever data residency, privacy or sector regulation restricts where production data may be processed.
How do you start automating data quality control?
Start with the datasets whose failure has real consequences, let the system learn their normal behaviour, and automate the checks your team already performs by hand. Expand coverage once alerts are trusted — adoption fails more often from alert noise than from missing features.