Data Timeliness vs. Data Currency : quelle est la différence ?
|
6
minute de lecture

Timeliness asks whether data is available when it is needed. Currency asks whether data is sufficiently up-to-date for its intended use. That difference sounds small until a team ships a dashboard that lands on time but still tells the wrong story, because the values inside it are already stale. In data quality work, timeliness and currency are related, but they're not interchangeable, and treating them like one thing hides real operational risk.
The confusion shows up because people often use the shared word freshness as if it settles everything. It doesn't. A dataset can arrive exactly when the business expects it and still be too old to trust, or it can contain the latest values and still miss the decision window. The core test is simple, timeliness is about when data becomes available, currency is about how current that data is.
Table of Contents
Why Timeliness and Currency Are Not the Same Thing
Data quality literature draws the line clearly: timeliness is the lag between when data is expected and when it becomes available, while currency is whether the values still reflect the real-world state. Teams often blur data timeliness vs currency until a pipeline failure exposes the gap. That mistake is expensive because a single “freshness” label can hide two different failure modes, late delivery and stale content. The IMF's SDDS makes timeliness operational, with daily data expected within 1 day, weekly within 1 week, monthly within 1 month, quarterly within 1 quarter, and annual within 1 year after the reference date or period. IMF SDDS guidance on timeliness
Practical rule: If you're asking “did it show up on time,” you're measuring timeliness. If you're asking “does it still describe reality,” you're measuring currency.
That distinction matters because a dashboard can be green on delivery and still be wrong for action. DAMA-linked research also treats currency as a subdimension of timeliness, which reinforces the practical point that on time and current aren't the same measurement. DAMA data quality dimensions research
For a quick visual, keep the two questions separate in your head.
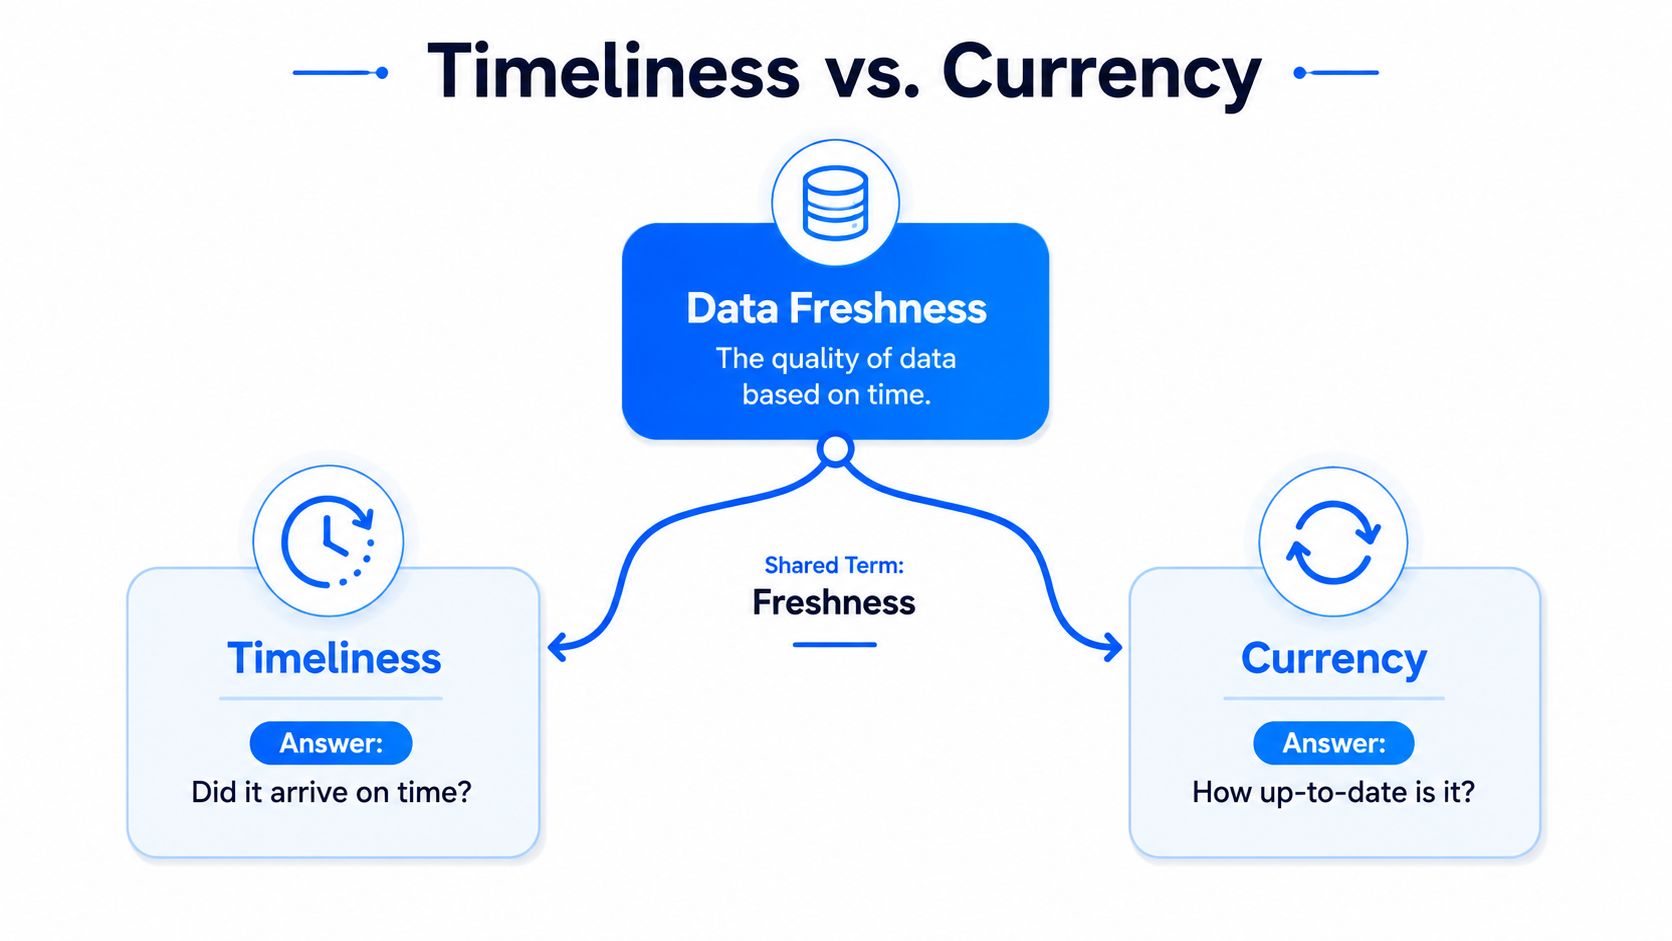
When teams mix them together, they usually end up with a vague freshness score that sounds useful and explains nothing. The better pattern is to track availability relative to need and recency of values as separate quality dimensions, then decide which one matters more for the use case. You can see that framing reflected in digna's data quality dimensions page, where the dimensions are treated as distinct checks rather than a single blended signal.
What Data Timeliness Actually Means
Timeliness means the data arrives by the time the business needs it. Not earlier in the abstract, not eventually, but by the required deadline. In practice, that makes timeliness a delivery contract, not a content check.
Take a daily customers table that has to be in the warehouse by 05:00. Finance uses it for reconciliation, analysts use it for dashboards, and the morning standup assumes it exists before people start asking questions. If the table lands at 04:45, it's timely. If it lands at 05:15, the content might still be accurate, but the workflow has already been disrupted.
The important thing is that timeliness is about availability relative to a required moment. A pipeline can carry perfect records and still fail the timeliness test if the report starts before the data is ready. That's why operational teams usually anchor timeliness to latency, delivery delay, on-time delivery rate, and SLA compliance.
A practical monitoring question is simple.
Can my downstream process safely start, or is it waiting on this dataset?
That question separates timeliness from every other quality concern. It also explains why teams with strict morning reporting windows care less about how elegant the data model is and more about whether the table is there when the job starts. If you want a concise vendor-neutral reference on this idea, digna's timeliness page frames it around expected availability and delivery behavior rather than data age.
What Data Currency Actually Means
Currency means the stored values still reflect reality closely enough for the use case. That's a different test from delivery timing. A record can arrive exactly on schedule and still be a bad fit if the underlying facts have drifted since the last update.
A customer address last updated three years ago is the cleanest example. The row may be valid, the job may run on time, and the report may open without errors, but the data doesn't describe the customer's current state. The same problem shows up with product prices from last month or a reference dataset that hasn't been refreshed recently.
Currency is governed by data age, last update timestamp, refresh interval, and the share of records updated within the required period. It's not a question of whether the pipeline ran. It's a question of whether the values inside the dataset are still recent enough to trust.
That's why a perfectly scheduled refresh can still leave a table non-current if the source system has gone quiet. The pipeline did its job, but it faithfully delivered stale inputs. The operational insight is straightforward, currency is about the age and currentness of the content itself, not the clock time of the delivery.
For a deeper business-oriented framing of freshness and currentness, digna's data freshness explainer is useful because it stays close to decision impact instead of academic language.
Can Data Be Timely but Not Current
Yes. That's one of the most common failure modes.
If a daily file lands at 05:00 as required, it's timely. If the source system stopped updating ten days ago, the content isn't current enough for campaign planning, customer service, or risk review. The delivery succeeded, but the business is still making decisions from old reality.
Scenario | Timeliness | Currency | What went wrong |
|---|---|---|---|
Data arrives at 05:00 and contains yesterday's information | Timely | May be insufficiently current | The delivery met the clock, but the values may already lag reality |
Data arrives at 10:00 when it was required by 06:00 | Not timely | Could still be current | The data is fresh enough, but the process missed its decision window |
Data arrives on time and reflects the latest state | Timely | Current | Nothing broke in either dimension |
Data arrives on time but is two weeks old | Timely | Not current | The job succeeded, but the content is stale |
This is the table that usually makes the difference click. The second row matters because a late dataset can still be current, and that matters for trend analysis or back-office reconciliation where the deadline is softer. The fourth row matters because teams often celebrate a green delivery badge while the business works from stale values.
The failure mode is different each time. Late-but-current can miss a fraud window or a morning cutoff. On-time-but-stale can create silent errors in trend analysis, customer communications, and forecast assumptions. Both problems deserve separate monitoring.
Can Data Be Current but Not Timely
Yes. And this is the one business users usually argue about first.
A dataset can contain the latest source values and still be useless for the morning process if it lands after the reporting cutoff. If source data is current but the pipeline fails and pushes delivery to 14:00 instead of 05:00, the data is no longer timely for the audience that needed it earlier. The values are fine, the delivery is late.
That matters in a batch-plus-streaming environment because teams often judge freshness from different timestamps. One group measures event time, another uses ingestion time, and a third cares about “ready for consumption” time. That split can produce very different lag numbers for the same dataset, which is why a single freshness SLA often hides business risk. This operational boundary is discussed in the fresh-data timing literature here
A dataset can be perfect for analysis and still miss the moment that made it useful.
The lesson for analytics engineers is direct. Don't let a healthy freshness label mask a missed delivery window. If the reporting process starts at 06:00, a dataset that becomes available at 14:00 may still be valuable later in the day, but it didn't serve the original workflow. That's a timeliness failure, not a currency failure.
How Is Timeliness Measured
Timeliness starts with a delivery contract. Define when the data is expected, then compare that target with when it becomes available for use. The gap is the delay that matters.
A few measures make that visible.
Expected versus actual arrival, so you can see whether the dataset met the scheduled window.
Latency, which captures the delay between the source event or update time and downstream availability.
Delivery delay, which helps when lateness is measured against a fixed business cutoff.
On-time delivery rate, which shows how often the pipeline meets the window.
SLA compliance, which ties the measure to an operational promise.
The right timestamp depends on the pipeline. In batch reporting, the useful measure is usually arrival time at the consumption layer. In streaming, it may be the lag between event generation and usable delivery. In hybrid pipelines, you may need both, because the same table can be timely for a daily report and late for an hourly control.
A common mistake is measuring the easiest timestamp instead of the one the business waits on. A morning finance close cares about when the numbers are ready, not when the file first entered storage. For a product-level view of expected delivery and arrival behavior, digna's timeliness documentation shows the same measurement logic in practice.
How Is Currency Measured
Currency starts with a different contract. You define how recent the data needs to be for its intended use, then measure whether the stored values still fit that expectation.
Useful measures include:
Data age, which tells you how old the value is at the time of use.
Last update timestamp, which shows when the value last changed.
Refresh interval, which tells you how often the source or downstream copy should change.
Percentage of records updated within the required period, which helps you judge how much of the dataset is still recent enough.
Staleness thresholds, which define when the data has gone too old for the use case.
Business context matters most here. Fraud detection may need a much tighter currency definition than monthly trend reporting. Regulatory evidence may care about traceable recency, while strategy dashboards may tolerate slower refreshes as long as the numbers are still representative.
A solid measurement spec names the use case first, then the age threshold second. Without that, teams end up arguing about whether the data is “fresh enough” in the abstract, which usually means nobody has written down the actual requirement. For a general data-quality measurement reference, the guide to accuracy, completeness, and consistency from PlotStudio AI is a good companion because it shows how quality metrics are usually written as explicit checks, not vibes.
You can also anchor currency checks inside a broader data-quality metrics framework, as described on digna's data quality metrics page.
How Can Organizations Monitor Both
Monitor them separately, then review them together. That's the cleanest operating model.
Start with expected availability tracking for timeliness. That tells you whether the pipeline delivered within the right window, and it catches late arrivals quickly. Then add value-age and anomaly checks on the data itself. That tells you whether the content is getting stale even when delivery looks healthy.
The third layer is historical trend analysis. Recurring delays and persistent freshness patterns show up here, especially when the same upstream source goes quiet at the same time every month or a specific table keeps drifting past its cutoff. A vendor-neutral guide on how teams monitor data freshness in pipelines is Streamkap's monitoring overview, which is useful because it treats freshness as something you observe over time, not as a one-time pass/fail test.
A practical workflow looks like this.
Track the delivery window, so late arrivals are visible.
Track data age, so stale-but-on-time deliveries are visible.
Review incident history, so recurring patterns don't get dismissed as one-offs.
That separation matters because availability and data age are related but not identical activities. If you merge them too early, a late delivery can hide a staleness problem, or a current dataset can hide a missed cutoff.
For teams using a structured monitoring stack, digna's reporting and monitoring page maps well to this layered approach because it treats delivery behavior and value behavior as different signals.
How Can digna Support Timeliness and Currency
digna Timeliness monitors expected availability and delivery behavior. It identifies late data, early deliveries, and missed windows, so teams can see whether the dataset arrived when it was supposed to.
digna Data Anomalies looks for unusual changes in arrival behavior, refresh patterns, and data-age behavior. That helps surface the kind of drift that doesn't always show up as a hard failure, especially when a source starts behaving differently from its normal baseline.
digna Data Analytics keeps the historical view. It helps teams investigate recurring delays, stale-but-on-time patterns, and changes in observability signals over time, which is where the operational story usually sits.
The useful point here is separation. Monitoring availability and monitoring data age are related, but they're not the same job. A team can know the pipeline was on time and still miss that the source system had stopped changing, or know the values are current and still miss a late delivery that broke the morning report.
digna runs inside the customer's own environment, so the checks stay in the customer's infrastructure. For teams that need to watch arrival schedules, inspect patterns, and keep the data in place, that design fits the timeliness-plus-currency split well. It's one option among several, but the core requirement stays the same, don't force two different questions into one metric.
Putting It Into Practice This Week
Pick one critical dataset and write two separate contracts for it. First, define the timeliness contract, the exact arrival window the business needs. Second, define the currency contract, the maximum data age that still makes the values useful.
Then decide which check owns which contract. A timeliness monitor should watch delivery behavior. A currency check should watch data age, update timing, and stale-but-on-time conditions. If you already use a platform like digna, map those responsibilities to the relevant modules rather than asking one metric to do both jobs.
Finish by scheduling a weekly review of two incident types, late arrivals and stale-but-on-time deliveries. That review is where you'll see whether the problem is a pipeline delay, an upstream source that has gone quiet, or a business cutoff that needs to be rewritten. Once those two failure modes are separated, the rest of the monitoring design gets much easier.
If you want a cleaner way to separate data timeliness from data currency in production, digna gives you timeliness monitoring, anomaly detection, and historical analysis in one platform that runs inside your own environment. Visit digna to see how that maps to your pipelines, then use the same split to write clearer SLAs for the datasets your teams rely on.


