ETL Data Quality: A Practical Guide to Reliable Pipelines
|
6
minute de lecture

Your pipeline turned green at 2:14 AM. By breakfast, finance is staring at revenue lines that don't make sense, analysts are asking whether the warehouse is broken, and your orchestration tool still insists everything succeeded. That gap between job health and data health is where etl data quality usually fails in practice.
The hard part isn't running checks. It's designing controls that notice when the data changed behavior, not just when a task errored out. ETL pipelines can finish on time, hit row counts, and still move corrupted, stale, or structurally incompatible data downstream, which is why quality has to be measured on the data itself, not the success flag attached to the job.
Table of Contents
When Green Pipelines Produce Broken Data
Why execution status is not enough
What usually breaks first
The Five Quality Dimensions Every ETL Pipeline Must Monitor
Why the five pillars need to work together
What each dimension actually catches
Rule-Based Validation Versus AI-Driven Anomaly Detection
Where each approach wins
How to layer them without creating alert chaos
Record-Level Validation Mechanics That Catch Defects
Use thresholds, not just counts
Checks that pay off in practice
Timeliness Monitoring and Expected Delivery Windows
Schema Drift and How to Detect It Before Downstream Breaks
Detect drift at the boundary
Respond without turning every change into an outage
Building a Layered ETL Quality Stack in Practice
How the stack usually matures
Who owns what in the stack
Common Misconceptions and a Practical Quality Checklist
A checklist you can apply this week
When Green Pipelines Produce Broken Data
A green run can look fine right up until someone opens the dashboard and sees numbers that do not match reality. The ETL layer may finish successfully while a source system changes a decimal field, a file lands half-empty, or a type coercion turns valid values into something that still loads but no longer means what it used to mean. By the time finance, operations, or BI spots the issue, the pipeline incident is already old news and the cleanup has moved downstream.
Historical ETL research is blunt about where these failures come from. A study of ETL deployments found that ETL jobs failing partway, systems being locked during execution, and users not finding data in the target because primary keys were transformed incorrectly were among the most common problems, and those same processes caused accuracy, timeliness, believability, and representational consistency issues (ETL data-quality failure study). The lesson is straightforward. The pipeline itself can introduce the defect, even when the source system looked fine.
Why execution status is not enough
Orchestration tools mostly report whether a task ran, not whether the data behaved correctly. A job can complete on schedule and still ship partial loads, miss a partition, or coerce values during transformation. That is why controls belong at the data layer, not just the workflow layer.
Practical rule: treat every successful ETL run as unverified until the data passes freshness, schema, and record-level checks.
The cost of getting this wrong is not abstract. Poor data quality has been estimated by Gartner to cost organizations an average of $12.9 million per year, and industry summaries note that bad data can drive 15% to 25% revenue loss in some companies, which is why early ETL quality controls matter so much (costs of poor data quality). Eppler and Helfert also described 23 distinct cost types tied to low-quality data, including maintenance, excess labor, data re-entry, revenue loss, customer loss, and rework. They also identified 10 categories of data-quality assurance costs, such as inspection, defect prevention, repair, training, and process improvement. In plain terms, the bill shows up whether you invest in quality or not.
What usually breaks first
The failures that hurt most are the quiet ones. A file lands late but still loads. A source system adds a column and your parser ignores it. A numeric field becomes text, and the warehouse accepts it after coercion. None of those problems necessarily stop the job, but they do poison the data.
The right response is layered monitoring, not hope. You want behavioral signals that tell you when the pipeline is producing data that no longer matches the shape, timing, or distribution you expect. That means looking beyond execution and into the properties of the records themselves.
The Five Quality Dimensions Every ETL Pipeline Must Monitor
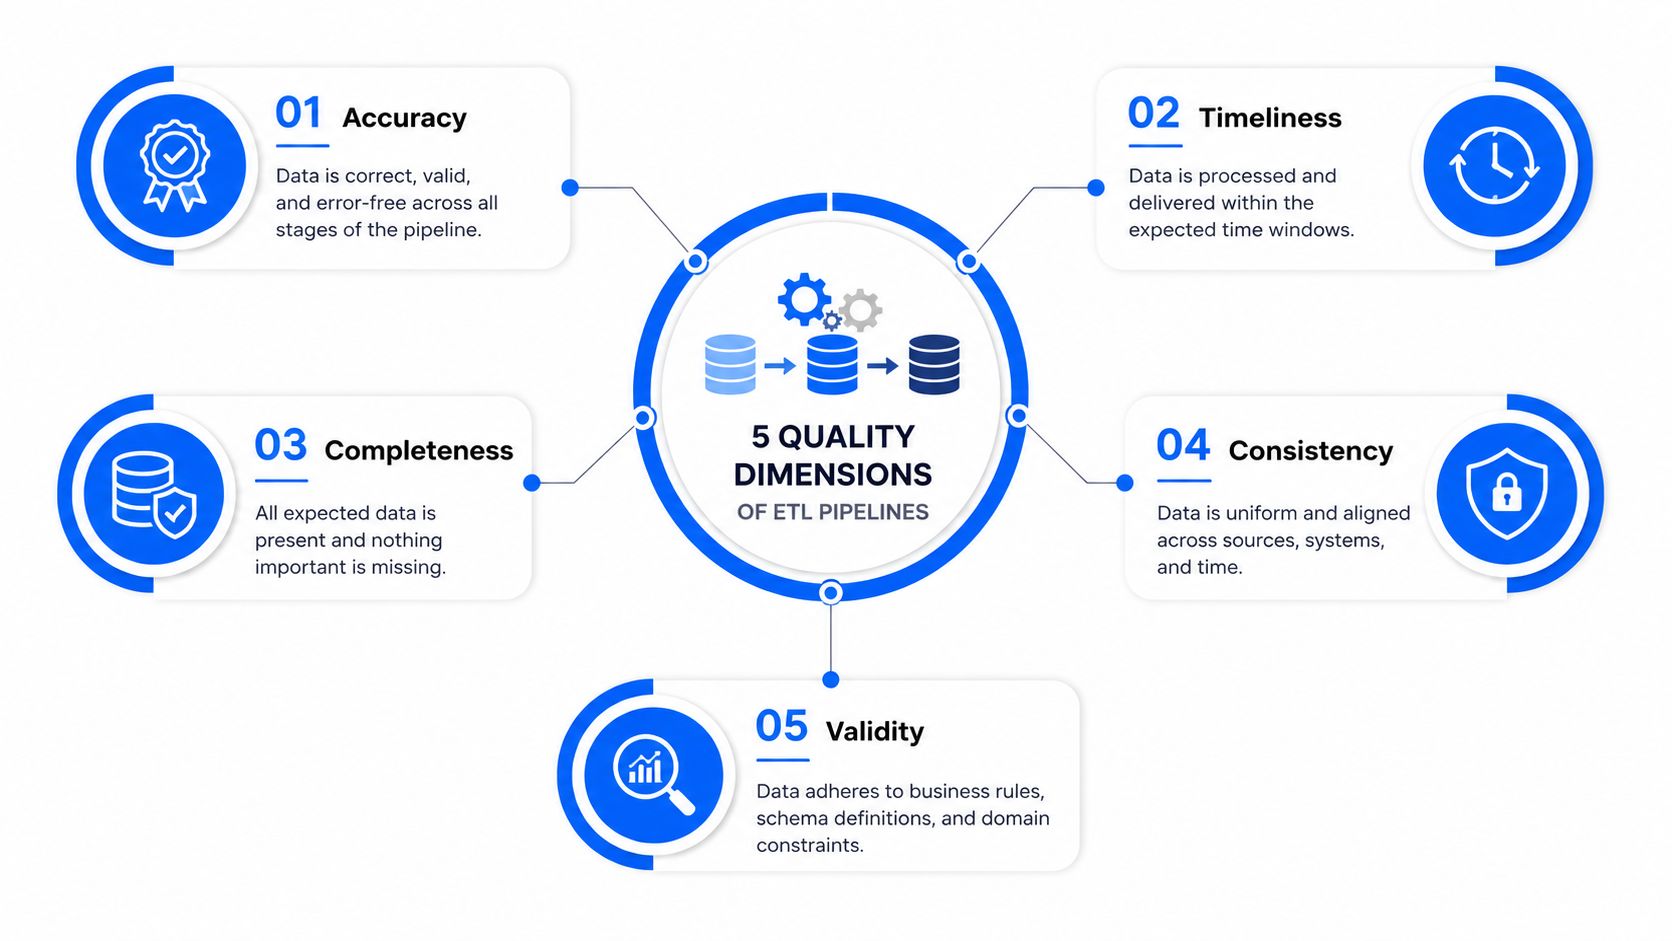
ETL quality works best when you stop treating it like a single score. Modern observability research frames the problem around freshness, schema, volume, distribution, and lineage, and that breakdown maps cleanly onto the older academic dimensions of accuracy, completeness, consistency, timeliness, validity, and uniqueness (modern observability pillars, academic overview of ETL quality dimensions). Each one catches a different failure mode, and none of them replaces the others.
Freshness tells you whether the latest valid record is arriving. Schema catches structural drift, including new columns, removed fields, and type changes. Volume flags sudden drops or spikes that hint at truncation or duplication. Distribution surfaces more subtle shifts, like null-rate changes or shifted value ranges. Lineage ties an issue back to the source and the transformation step that introduced it.
Why the five pillars need to work together
If you only watch schema, you'll miss stale but structurally valid data. If you only watch volume, a bad load can still pass because the row count looks normal. If you only watch freshness, you can still ship a structurally wrong file right on time. That's why these are behavioral signals, not interchangeable checkboxes.
A good resource for teams building the discipline around this is training data quality standards, especially if you're trying to align analysts, engineers, and governance owners on the same expectations. The point isn't to pile on more gates. It's to make the right failure mode visible before the warehouse becomes the only place anyone notices.
I also keep a simple internal reference for teams that want a more formal breakdown of the pillars in digna's dimensions of data quality. That kind of shared vocabulary matters when different teams use the same words to mean different things.
What each dimension actually catches
Freshness catches missing or delayed deliveries before dashboards go stale.
Schema catches unannounced structure changes that break consumers or corrupt mappings.
Volume catches truncation, duplication, and partial loads.
Distribution catches shifts in null rates, value ranges, and cardinality that row-by-row rules often miss.
Lineage helps you trace the failure to a source system, job, or transformation step.
A warehouse only looks healthy when you check the right layer.
The strongest observability deployments don't ask one dimension to do all the work. They use each dimension as a different lens on the same pipeline so that a problem can be caught where it started, not after it's already shaped downstream reporting.
Rule-Based Validation Versus AI-Driven Anomaly Detection
Rule-based validation is still essential, but it only covers what you already know to expect. If a revenue field must never be negative, if a country code must be in a defined set, or if a foreign key must exist before a fact row loads, a rule should enforce it. That's hard control, and hard control is good.
The problem is that rules are blind to behavior that shifts without violating a hard constraint. A source can start sending records late, a field can become noisier, a join can lose matching keys, or a distribution can drift enough to damage analytics while still passing every static check. That's where anomaly detection earns its place. For a broader overview of that pattern, the ETL anomaly detection guide is worth reading alongside digna's anomaly detection approach.
The practical trade-off is simple. Rules are precise and easy to explain. Anomaly detection covers wider territory, but it needs a baseline and can generate noise if you don't tune ownership and alerting carefully. In my experience, teams get into trouble when they treat anomaly detection as a replacement for deterministic checks. It isn't.
Where each approach wins
Dimension | Rule-Based Validation | AI-Driven Anomaly Detection |
|---|---|---|
Setup cost | Lower for known constraints | Higher because it needs historical baseline behavior |
Coverage | Narrow, but exact | Broader, catches drift and unusual patterns |
Maintenance burden | Grows as rules pile up | Grows when baselines, owners, and tuning aren't managed |
Latency to insight | Immediate for defined failures | Fast once patterns are learned, but not always instant on day one |
Blind spots | Unknown unknowns and behavior drift | Hard business invariants and explicit policy requirements |
How to layer them without creating alert chaos
Start with rules for invariants you'd never want to relax. Then layer anomaly detection on top for the metrics that tend to drift, such as volume, null rates, and field correlations. If a record fails either layer, route it to quarantine or a review queue instead of letting it continue downstream.
That approach also keeps your controls explainable. Engineers can debug a failed constraint. Analysts can understand why a baseline changed. Governance teams get a record of what was blocked and why. When done well, the system feels less like a wall of brittle checks and more like a calibrated set of guardrails.
Record-Level Validation Mechanics That Catch Defects
Record-level checks work only when they map to business impact, not just pass or fail status. A missing nullable field in a low-risk dataset is not the same as a missing key in a revenue fact table. The control has to reflect that difference, or it turns either too strict to survive or too loose to matter.
Clinical ETL work shows how fast quality can slip when definitions are fuzzy. In one hospital study, manual extraction error rates and automated export error rates varied depending on whether ambiguous fields were excluded, which points to a simple lesson, automation does not guarantee quality, and clarity in data definitions changes defect rates materially.
Use thresholds, not just counts
A 0.1% failure rate on a 50-million-row load is a different operational problem than the same rate on a 1,000-row batch. The first can hide tens of thousands of bad rows. The second may be a small but critical sample where even one defect matters.
That is why severity tiers matter. Warn, quarantine, and halt give the pipeline room to react without becoming both brittle and permissive.
The validation mechanics should stay concrete. A 2021 ETL validation article recommends correct column count, data types, and column constraints, plus column presence and ordering for flat files, along with primary-key, foreign-key, and unique-index constraints (validation mechanics article). That remains the backbone of dependable record-level validation.
Checks that pay off in practice
Null detection: Profile columns and set acceptable density ranges, especially for mandatory business fields.
Key enforcement: Reject duplicate primary keys and orphaned foreign keys before they contaminate downstream joins.
Domain validation: Use controlled values for fields such as ISO country codes and other finite enums.
Business thresholds: Express revenue tolerance bands, return-rate limits, or cancellation thresholds as percentages of incoming rows.
Late-arriving facts: Validate against effective-dating windows so events land in the correct time slice.
I prefer to quarantine ambiguous rows rather than let them mutate the trusted dataset. Quarantine gives data producers a chance to fix the source or mapping without turning the warehouse into a garbage collector.
Operational rule: if the team cannot explain why a failed row is safe to ignore, it is not safe to ignore.
One practical point. Do not write rules for every edge case. Start with the fields that drive finance, compliance, customer workflows, and model training. That is where quality defects become expensive fastest.
Check Type | What It Catches | Threshold Guidance | Recommended Action |
|---|---|---|---|
Null checks | Missing required values | Set by field criticality and dataset size | Warn for low-risk fields, quarantine for critical fields |
Key constraints | Duplicates and broken relationships | Zero tolerance for identity keys | Halt or quarantine |
Domain rules | Invalid codes and out-of-set values | Use finite allowed-value lists | Reject or route to remediation |
Range checks | Outliers and impossible values | Define business-specific bounds | Warn on soft limits, quarantine on hard limits |
Effective dating | Late or misdated events | Validate against expected windows | Quarantine and reprocess if needed |
For teams that want a broader control set, digna's data validation rules and continuous quality guide is a useful companion to these record-level checks.
Timeliness Monitoring and Expected Delivery Windows
A pipeline can be green and still deliver stale data. That is what breaks morning dashboards, not a failed job alert. Timeliness needs to be treated as an SLA, with an expected delivery window tied to when the business uses the dataset.
The control is simple in concept and unforgiving in practice. Compare expected arrival with actual arrival, then label the run early, late, missing, or partial. A sales feed that must land before an 8:00 AM revenue review has a narrow window, while an afternoon reporting feed can tolerate a longer one. Use the business cutoff, not the schedule in the orchestration tool, as the reference point.
The cleanest way to set that window is to learn from prior run patterns, source commit cadence, and consumption time. If the team checks dashboards at the start of the day, a ten-minute slip can matter. If the data is only used after lunch, the same delay may be noise. digna's timeliness metrics guide gives a useful frame for setting those windows and measuring them consistently.
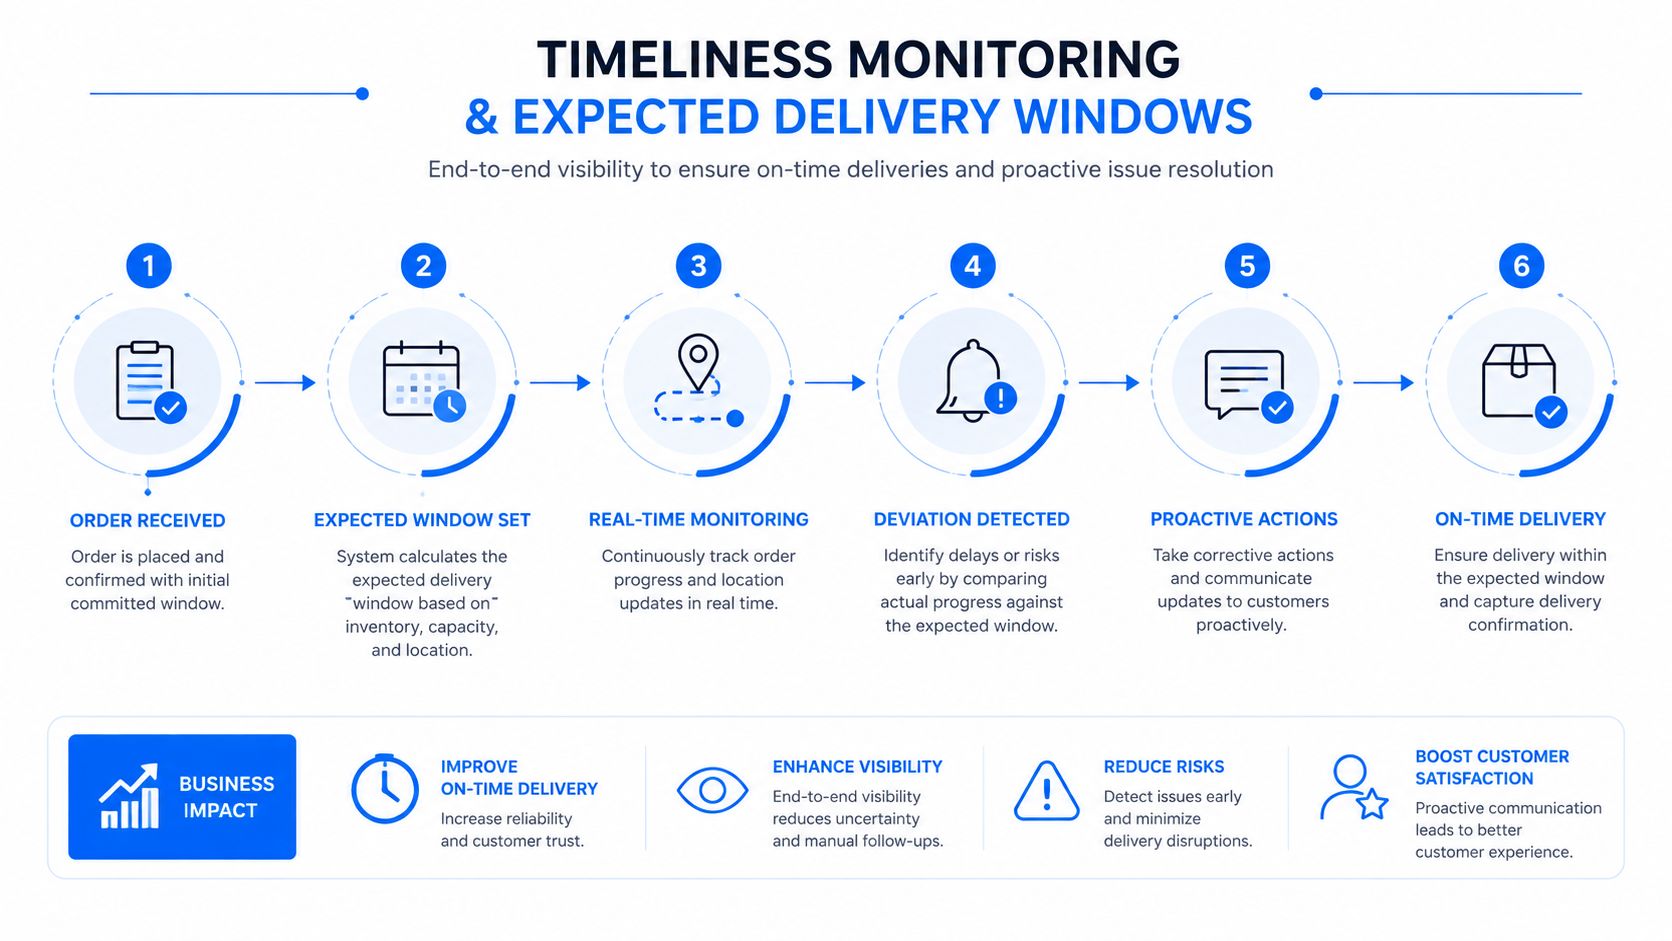
Monitor more than the final timestamp. Heartbeat checks show whether the source is still producing data. Watermarks show how far the pipeline has progressed. Incremental completion markers show whether all partitions arrived, which is often where partial loads hide.
Alert policy should reflect the kind of failure, not just the existence of delay.
Early arrivals: Usually harmless, but useful when they point to an upstream schedule change.
Late arrivals: Alert once the delay crosses the dataset's business window.
Missing loads: Escalate fast if the data is absent before a known consumption deadline.
Partial loads: Treat as high risk when expected file groups or partitions are incomplete.
The useful distinction is between a routine slip and a delay that will break a board meeting or a customer workflow. That decision belongs in the monitoring policy, not in someone's head at 7:50 AM. Timeliness control works when it gives the team time to act, and when it catches silent staleness before anyone trusts the numbers.
Schema Drift and How to Detect It Before Downstream Breaks
Schema drift is silent because the pipeline often keeps running while consumers break around it. Source systems change shape without warning, and the load still looks successful until a dashboard, model, or downstream job starts failing on missing or reshaped fields. That is why schema drift belongs in the same control layer as validation and timeliness monitoring, not in an after-the-fact cleanup queue. The practical definition of drift is the unannounced or gradual change of a source structure over time relative to the pipeline schema, which is why it needs active monitoring rather than one-time approval (schema-drift definition).
The useful way to think about drift is by type. Additive drift brings in new columns. Subtractive drift removes fields consumers expect. Mutative drift changes type, precision, or nullability. Those are different failure modes, so they need different responses. A change that is safe for ingestion can still break a downstream semantic layer or a model feature set.
Schema drift explained lays out the operational problem clearly. If the structure changes and nobody notices until consumption, the cost shows up later as bad joins, failed casts, or silent data loss.
Detect drift at the boundary
Contract checks should run as data crosses the ingestion boundary. Versioned schema registries help when upstream systems evolve deliberately. Diff jobs that compare DDL snapshots catch changes that slip past code review. Inference checks can flag unexpected columns even when the producer never announced them.
The mechanics matter. Validation against the declared structure should cover column presence, type, constraints, and ordering for flat files, plus primary-key, foreign-key, and uniqueness checks where those rules apply. Those checks are not glamorous, but they stop a lot of pain before it spreads into downstream tables and reports.
Respond without turning every change into an outage
Drift Type | Example Change | Detection Method | Recommended Response |
|---|---|---|---|
Additive | New field added to a payload | Schema diff, inference, contract check | Allow nullable addition, then update downstream models |
Subtractive | Existing column removed | Boundary validation, snapshot diff | Block or route to compatibility layer |
Mutative | Type or precision changes | Type validation, registry comparison | Quarantine, map carefully, and version the contract |
Strict-fail policies sound safe until they create more incidents than they prevent. I have seen teams reject harmless additive changes and then spend the next sprint manually unblocking consumers. Backward-compatible evolution usually works better. Nullable additions, dual-write transitions, and replayable downstream loads are safer than pretending schemas never change.
Design for drift, and the controls stay useful longer. Assume the schema is fixed, and the next upstream release will prove otherwise.
Building a Layered ETL Quality Stack in Practice
A green ETL run can still ship bad data. That usually happens because one control is doing too much, while the actual failure sits one layer away. A useful quality stack separates those jobs. Row-level checks run inline during extraction or transformation. Aggregation-level anomaly detection runs at load boundaries. Freshness and lineage checks run after commit, once you can confirm the dataset arrived and trace how it moved.
That split matters in practice. Static rules are good at catching known bad patterns. Behavioral monitoring catches drift, delays, and subtle shifts that fixed rules miss.
How the stack usually matures
The first version should be lightweight. Start with non-blocking probes at each stage transition, so the team can see what changed before deciding whether to stop the load. As signal improves, promote the checks that catch real defects into orchestration gates. Keep the rest as alerts or quarantine paths.
A common failure mode is treating every issue as a rule-writing problem. Teams end up with brittle logic that blocks harmless change and still misses meaningful drift. The stronger pattern is layered control, where distribution profiling, arrival-window alerting, and lineage-aware schema contracts each cover a different slice of risk. The exact tools vary. The design principle does not.
One industry case makes that trade-off clear. An implementation described in ITSV material replaced thousands of static validation rules with profiling, timeliness alerting, and schema contracts, which cut alert noise and surfaced revenue-affecting drift earlier. That result is less about the specific stack and more about fit. Hard gates should handle failures that break consumers. Everything else should inform operators without turning routine variation into an outage.
Who owns what in the stack
Data engineers: Own pipeline boundaries, schema contracts, and failure routing.
Analytics engineers: Own model-facing expectations, distribution checks, and semantic validation.
Governance teams: Own standards, severity policy, and escalation paths.
Business owners: Own the meaning of the alert, especially when a row is technically valid but commercially wrong.
Build the control stack the same way you build the pipeline, with ownership, testing, and rollback paths.
digna fits this model because it runs in the customer's own environment and combines anomaly detection, timeliness monitoring, record-level validation, schema tracking, and platform metrics. The point is not the vendor label. The point is that the checks stay close to the data, and the operating model stays inside the environment where the pipeline runs.
Treat the stack as a product surface, not a one-time project. Profile each dataset, assign each failure mode to a single owner, wire alerts to the team that can act, and retire controls once another layer covers the same gap more cleanly. Quality holds up when the stack is maintained with discipline, not when rule count keeps rising.
Common Misconceptions and a Practical Quality Checklist
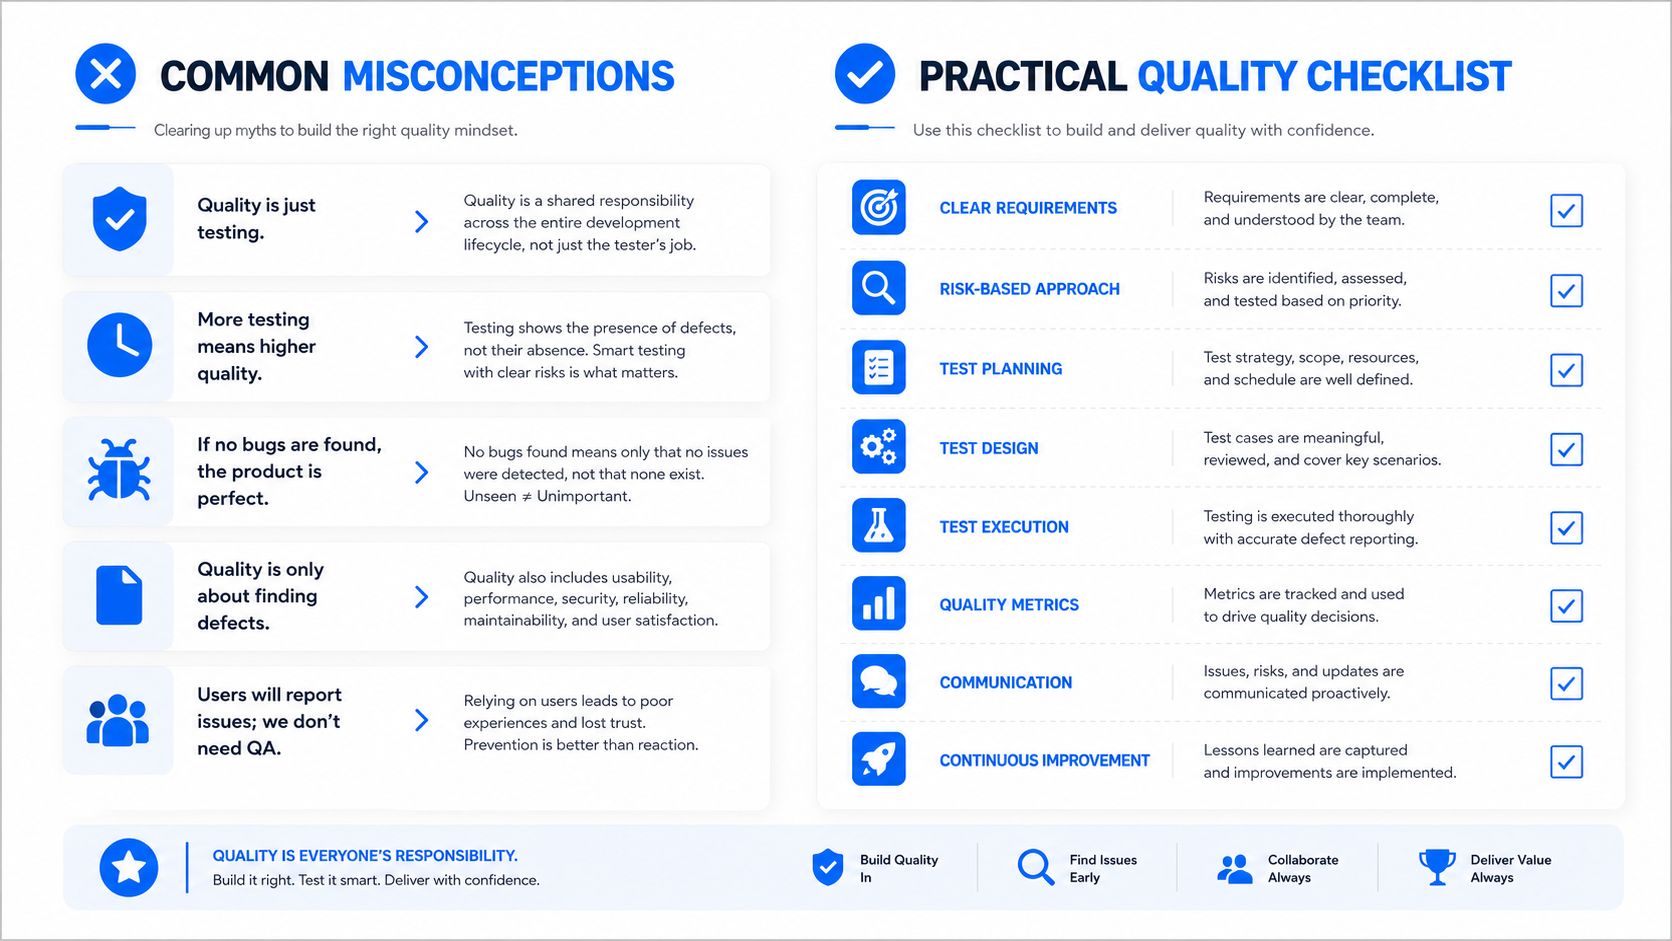
The first misconception is that more rules automatically mean better quality. In reality, piling on static checks usually creates alert fatigue, brittle pipelines, and a long tail of rules nobody trusts. The second misconception is that a green pipeline means trustworthy data. It doesn't, because the job can succeed while the payload is stale, shifted, or structurally wrong. The third is that schema drift is a one-time migration problem. It isn't, it's continuous.
Those mistakes disappear once you separate the job of each control. Rules measure the expected. Anomalies catch the unexpected. Drift detection watches structure as it changes over time. If the team mixes those jobs together, the result is noisy monitoring and slow incident response.
A checklist you can apply this week
Profile the source first: Learn the field shapes, null patterns, and distributions before writing rules.
Replace static thresholds with rolling baselines: Use observed behavior when the dataset is naturally variable.
Alert on absence, not just presence: Missing data is often the first sign of a broken load.
Version every schema: Treat structural change as a managed event, not a surprise.
Assign a human owner to every alert: Alerts without ownership become background noise.
The most durable programs don't chase perfect rules. They build observability, set clear accountability, and let the control model evolve as the pipeline evolves. That's the difference between a system that looks clean and one that stays reliable when source behavior changes.
If you're hardening ETL data quality across warehouses, lakes, and streaming pipelines, start with controls that watch data behavior, not just task status. digna helps teams monitor anomalies, schema drift, timeliness, and validation inside their own environment, so the checks stay close to the data and the ownership stays clear. Visit digna to see how that approach fits your stack.