ETL Data Pipeline Architecture and Reliability Guide
|
7
minute de lecture

A 2026 benchmark found that 97% of senior data and technology leaders say pipeline failures have slowed analytics or AI initiatives, with average monthly business exposure of about $3 million (StorageNewsletter's coverage of the benchmark). That changes how I evaluate an ETL data pipeline. The question isn't whether a job completed. It's whether the pipeline delivered trustworthy data, on time, with enough evidence to explain what happened when something changed.
An ETL pipeline is often treated as plumbing. In an enterprise, it behaves more like a production service. It has dependencies, service expectations, failure modes, recovery procedures, and consumers who may make financial, operational, or regulatory decisions from its output. Reliability work therefore isn't maintenance around the edges. It's part of the data product.
Table of Contents
Why ETL Pipelines Still Matter in 2026
ETL remains foundational
Understanding Core ETL Architecture Components
Extract from the source edge
Transform into a trusted shape
Load with control
Choosing Between ETL and ELT Approaches
Common Pipeline Failures and Maintenance Burdens
What conventional monitoring misses
Maintenance is an economic constraint
Building Reliability with Quality Controls
Start at ingestion
Validate records and relationships
Monitor delivery and recovery
How Data Observability Transforms Operations
Implementing Observability in Your Environment
Make incidents collaborative
Why ETL Pipelines Still Matter in 2026
The business cost of a pipeline incident rarely appears in the scheduler. A failed task may look like one red status, but the consequences can include stale dashboards, delayed reconciliations, interrupted model training, manual investigation, and decisions made from incomplete information. The benchmark cited above found that pipeline failures are already slowing analytics and AI programs across senior leadership teams, which makes observability a business priority rather than a dashboard feature.
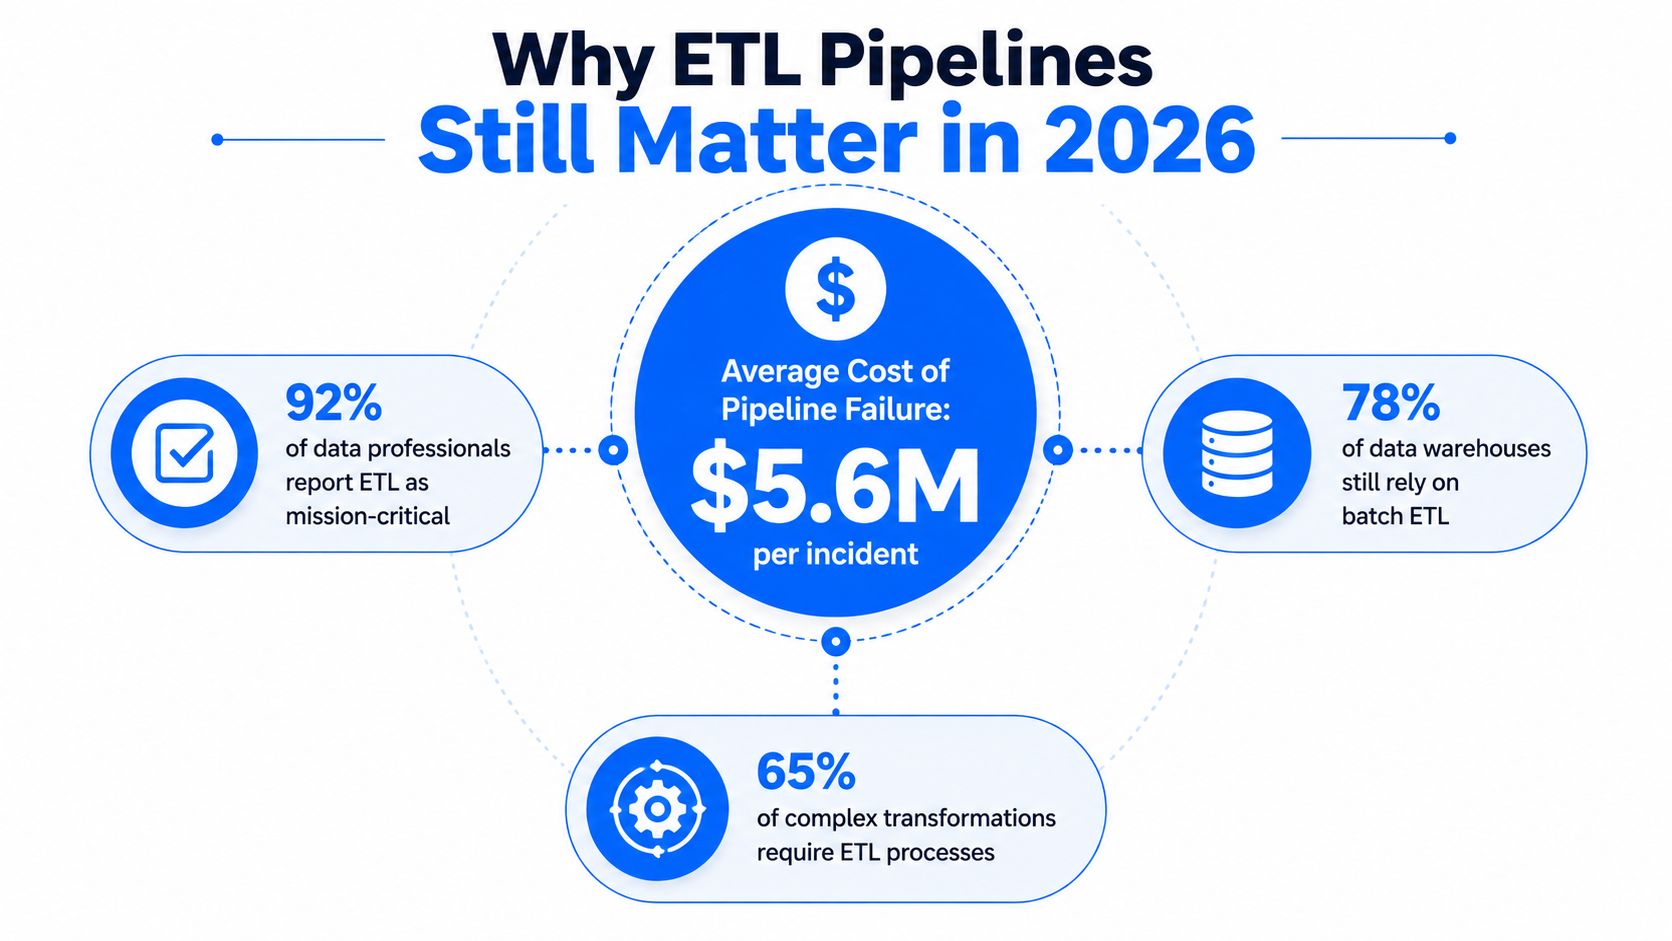
The image includes claims that aren't part of the verified data available for this article, including the stated failure cost and the percentages in its surrounding stat bubbles. Those figures shouldn't be used as evidence. The verified benchmark supports a different, still urgent conclusion: pipeline failures create about $3 million in average monthly business exposure for the organizations represented in the report (StorageNewsletter).
ETL remains foundational
ETL became a core enterprise data pattern in the early 1990s, as data warehouses moved into mainstream analytics. Dedicated integration products emerged in that era, including Prism Solutions, founded in 1988, Informatica, founded in 1993, and DataStage in the same period. By 1995, the Data Warehousing Institute had been founded, reflecting how quickly warehouse-driven data movement became a distinct enterprise software category (historical data warehouse overview).
The pattern persists because many organizations still need transformations to be controlled, reproducible, and auditable before data reaches analytical systems. Finance, healthcare, telecommunications, and public-sector environments often can't treat raw source data as immediately trustworthy. They need defined mappings, validation evidence, reconciliation logic, access controls, and repeatable runs.
ELT and streaming have expanded the design space, but they haven't eliminated ETL. A modern platform may use change data capture for one source, batch ETL for a regulated ledger, ELT for exploratory warehouse models, and streaming for time-sensitive events. The sensible architecture is the one that matches data risk, latency requirements, compute location, governance obligations, and recovery capability.
For implementation detail, teams can use digna's data pipeline best practices alongside their existing orchestration and governance standards. The practical objective is simple: make pipeline behavior visible in business terms before a missed load becomes an analytics incident.
Understanding Core ETL Architecture Components
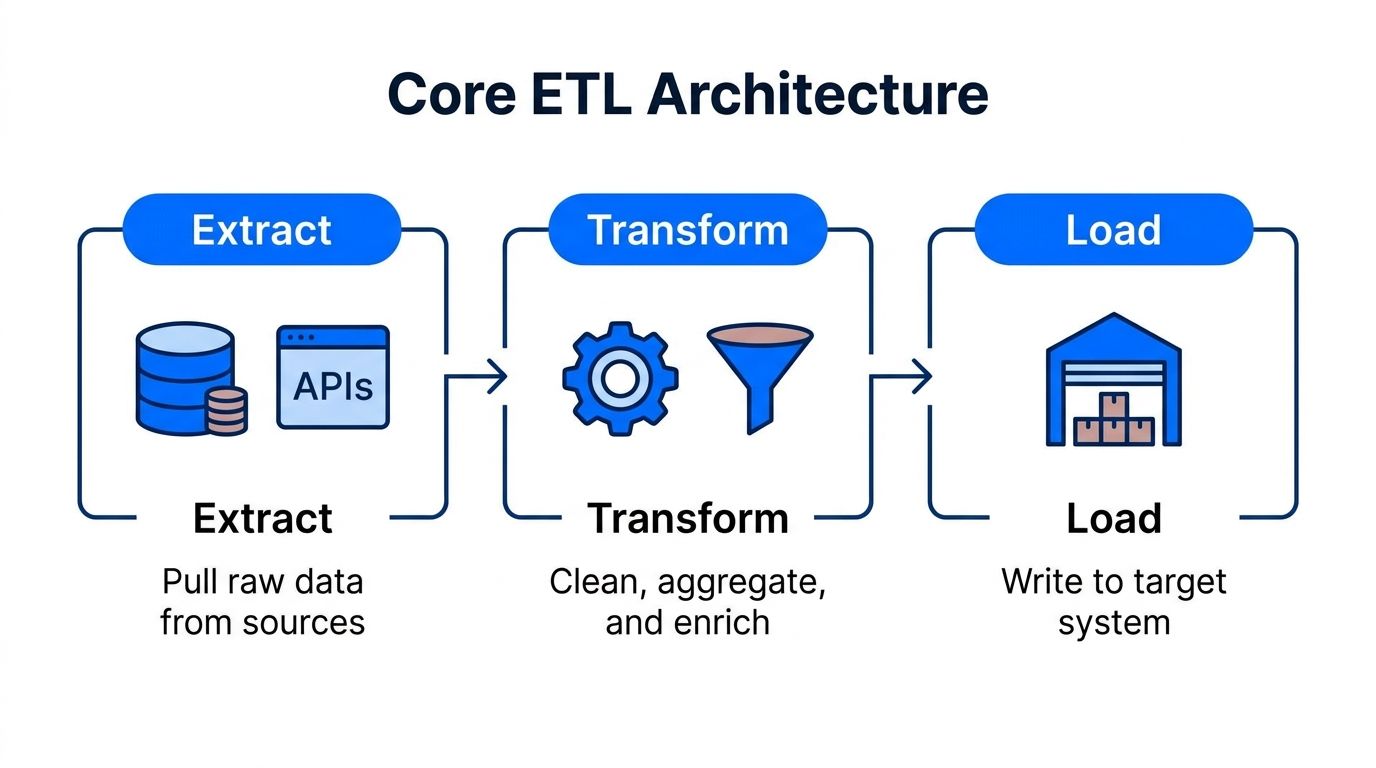
An ETL data pipeline has three defining movements: extract, transform, and load. In production, those stages usually sit inside a larger control structure that handles staging, checkpoints, dependencies, retries, validation, and operational evidence.
Extract from the source edge
Extraction pulls data from operational databases, APIs, files, SaaS applications, or other systems. The hard part isn't merely connecting to each source. It's preserving enough context to know what was extracted, when it was extracted, which source version was used, and whether the source returned a complete response.
A resilient extractor handles incremental boundaries carefully. It records a checkpoint, such as the latest accepted update marker, and avoids advancing that checkpoint until the downstream write has succeeded. If the run stops midway, the pipeline can resume or replay from a known position instead of guessing what was processed.
A staging area provides another useful boundary. Raw extracts can be retained before transformation, allowing engineers to inspect source behavior, replay transformations, and separate source availability problems from transformation defects.
Transform into a trusted shape
Transformation is where the pipeline standardizes formats, applies business rules, removes unusable records, reconciles entities, and creates analytical structures. A customer identifier might need normalization across systems. Timestamps may need a common interpretation. Transaction records may require duplicate handling and referential checks before they can support reporting.
Keep transformation logic modular. A single monolithic script makes it difficult to isolate a broken mapping or identify which rule changed the output. Version-controlled components, explicit inputs and outputs, and testable functions make review and rollback more practical.
Load with control
Loading writes validated results into a warehouse, lake, operational store, or another target. A reliable loader distinguishes between a completed write and a partially completed write. It uses idempotent behavior where possible, records rows accepted and rejected, and makes the final publication step explicit.
Orchestration should coordinate dependencies rather than launch tasks on a schedule. For teams designing the source side of this architecture, digna's data ingestion pipeline guidance offers a useful reference point. The key design principle is to treat every stage as an observable contract, not as an opaque handoff.
Choosing Between ETL and ELT Approaches
ETL and ELT differ mainly in where transformation happens. ETL transforms data before loading it into the target. ELT loads raw data first, then uses the target warehouse or lakehouse to transform it.
Neither approach wins universally. ETL can be the better choice when sensitive or invalid records must be filtered before they enter a shared analytical store, when the target has limited compute, or when a controlled pre-load representation is required for compliance. ELT can be more flexible when teams need to retain raw history, iterate on models, and use scalable warehouse compute for transformations.
The decision also depends on failure recovery. ETL may reduce the amount of unsuitable data reaching the target, but a transformation defect can force upstream reprocessing. ELT preserves raw data for later modeling, but it shifts more responsibility into warehouse governance, access control, testing, and compute management.
A useful decision matrix looks like this:
Factor | Choose ETL When | Choose ELT When |
|---|---|---|
Compliance | Sensitive data must be transformed or restricted before loading | Raw data can be retained under strong access controls |
Data quality | Pre-load validation must block unsuitable records | Warehouse tests can govern models after ingestion |
Compute location | External processing is available or the target has constrained compute | The warehouse or lakehouse supplies suitable transformation capacity |
Reprocessing | The pre-load contract is stable and tightly controlled | Teams need to revisit raw data with changing business logic |
Governance | A curated target is required before broad access | Raw and modeled zones can be separated and governed |
Team skills | Engineers are strongest in integration tools and procedural transformations | Analysts and engineers are comfortable with SQL-based warehouse modeling |
Architecture | Legacy databases or regulated batch workflows dominate | Cloud-native storage and elastic warehouse processing are central |
Operating model | The organization values strict release gates before publication | The organization needs rapid experimentation with traceable models |
Hybrid designs are common for good reason. A team may use ETL to tokenize sensitive fields and enforce source-level contracts, then use ELT for downstream dimensional modeling. That arrangement preserves control at the edge without sacrificing analytical flexibility.
Use digna's explanation of ingesting data to clarify the ingestion boundary before selecting a transformation pattern. The most important decision isn't the label. It's whether the architecture makes data risk, cost, lineage, and recovery visible to the people responsible for the outcome.
Common Pipeline Failures and Maintenance Burdens
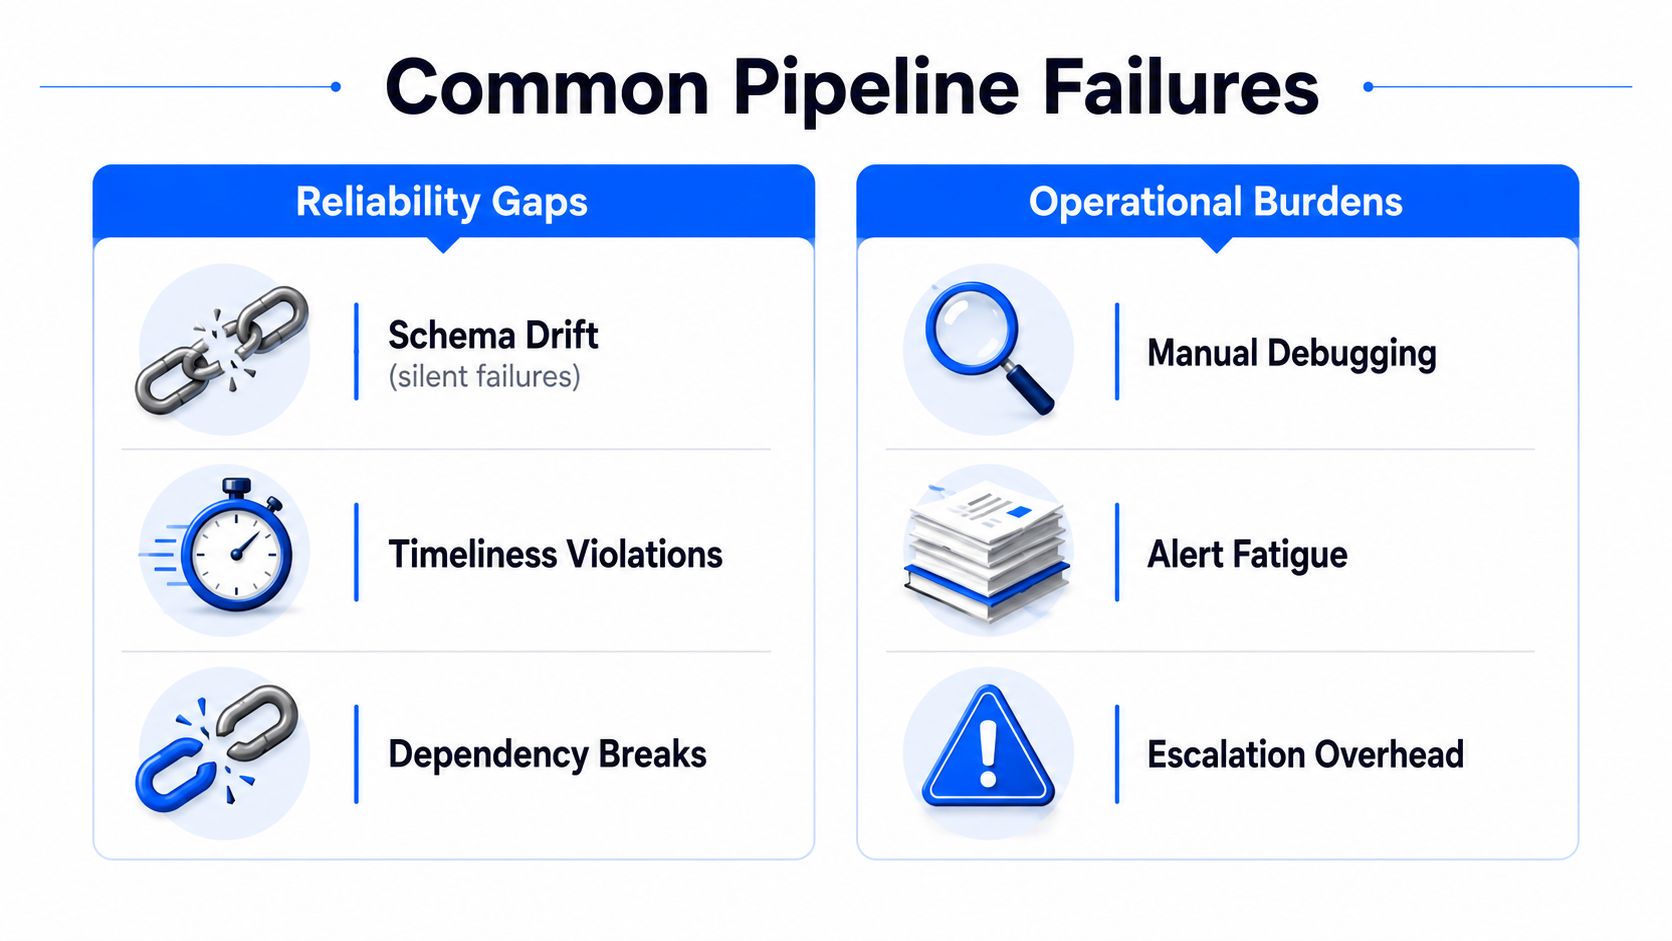
A green scheduler status conceals far more than it reveals about pipeline correctness. An ETL job may finish after ingesting an incomplete file, accepting a changed column type, loading stale records, or producing a technically valid result that misstates revenue, inventory, or customer activity.
Schema drift is a common source of silent failure. Suppose a source changes customer_id from an integer to a string, or renames order_status while the extraction still reports success. The transformation may reject every row, coerce values incorrectly, or publish an output whose meaning has changed. Compare incoming metadata with a versioned baseline on every run, classify the change, and quarantine mismatches before full-load execution. Schema drift incident guidance provides useful context for handling these events.
What conventional monitoring misses
Counting failed jobs captures explicit execution errors, while trustworthy operations require broader signals:
Throughput: Compare expected movement with actual rows or bytes processed.
Freshness: Confirm that the latest records arrived within the agreed service window.
Availability: Track whether the pipeline and its dependencies are usable when consumers need them.
Recovery time: Measure how long teams take to restore trustworthy delivery.
Error behavior: Watch rejected rows, retries, dead-letter growth, and recurring partial failures.
Timeliness checks should combine source timestamps such as created_at or updated_at with heartbeat signals and schedule-versus-availability comparisons. These controls can expose delayed ingestion before a downstream report visibly fails (timeliness monitoring guidance).
Maintenance is an economic constraint
Legacy and DIY pipelines break more often than fully managed ELT systems, and data engineers can spend 53% of their time on pipeline maintenance, according to the late-2025 survey discussed in TechTarget's reporting. Managed ELT does not remove reliability work. Teams still need contracts, ownership, recovery procedures, and tests. The operating choice should account for labor, downtime, and the cost of investigating misleading outputs.
Observability changes that calculation when it connects symptoms to impact and likely cause. Captapi's guide to resilient systems offers a broader treatment of resilience testing and failure behavior. Alerts should identify affected datasets, urgency, and the next action rather than create another queue of unexplained noise.
A focused discussion of early detection appears in digna's analysis of why data pipelines fail in production. The practical objective is a shorter path from source change to safe operational decision, turning pipeline visibility from maintenance overhead into an asset for dependable data delivery.
Building Reliability with Quality Controls
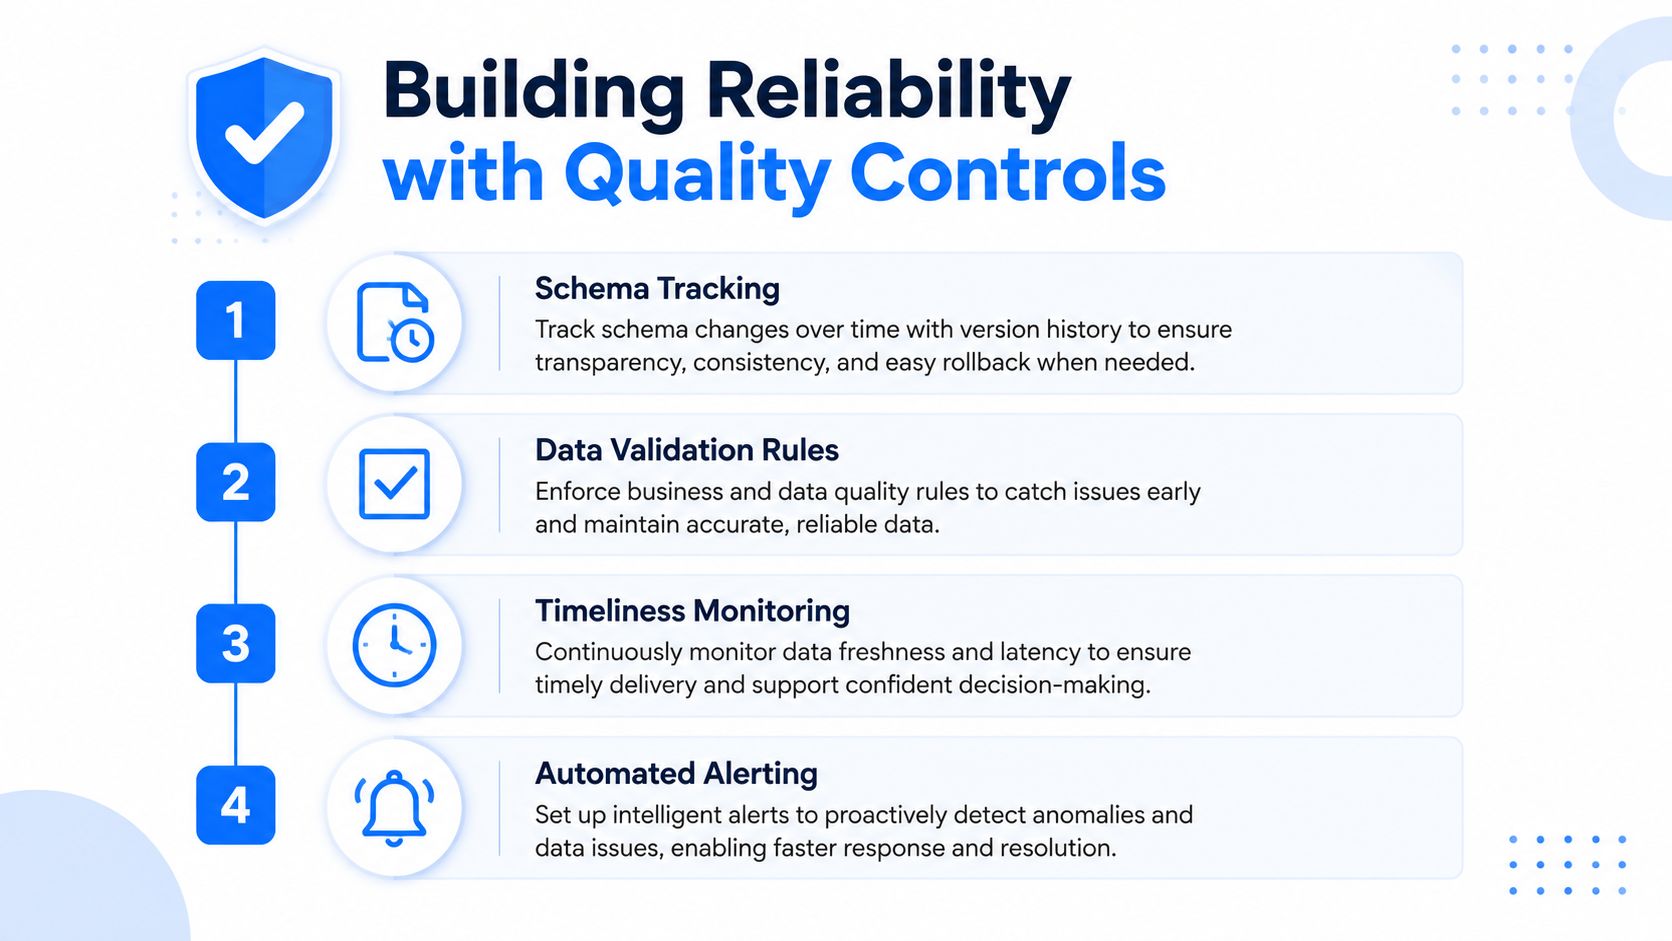
Reliability depends on controls placed throughout the pipeline. Schema tracking catches structural changes, validation tests data meaning, timeliness monitoring identifies delivery problems, and operational metrics reveal declining execution quality even when jobs still complete. Together, these controls limit the hidden cost of failures, including reprocessing, manual investigation, delayed decisions, and loss of confidence in downstream outputs.
Start at ingestion
Handle schema drift at the source boundary, before a changed structure reaches transformations and downstream readers. Establish a versioned baseline for each important source, compare incoming metadata on every run, and classify changes by risk.
A compatible field addition may require review without causing an outage. A removed field, incompatible type change, or renamed business key should usually stop or quarantine the affected flow until an owner explicitly re-certifies it. Canary runs and schema registries let teams test compatibility before publishing the full load.
Validate records and relationships
Business rules turn quality expectations into decisions that systems can test. Enterprise controls may include row-count variance bands of ±30%, an email null-rate limit of less than 5%, and a referential-integrity rule requiring every order.customer_id to exist in the customer table (ETL quality-control examples).
These thresholds are not universal defaults. They are explicit contracts that data owners should approve, document, and review when source behavior changes. Record-level validation also creates audit evidence by showing which rule failed and which records were affected. Academic work on business-rule verification for data quality supports assessing quality against stated rules. For implementation guidance, see digna's analysis of data validation rules and continuous data quality.
Monitor delivery and recovery
A pipeline can pass every content test and still miss its business deadline. Define freshness expectations from source timestamps, expected arrival patterns, and downstream service requirements. Alert on missing, late, or early delivery when those events indicate an upstream or scheduling problem.
Track rows in, rows out, rejected rows, duration, error count, and freshness for each stage. Expert guidance recommends targeting error rates under 0.1%, treating rates above 5% as a systemic failure signal, maintaining 99.9% availability, and restoring service in under 30 minutes (ETL benchmarking guidance).
Operational rule: An alert should identify the dataset, violated contract, likely dependency, business owner, and next safe action.
These controls form one operating loop. Detection without quarantine lets bad data spread. Validation without timeliness leaves consumers with stale outputs. Metrics without ownership produce charts but not recovery. Observability connects each signal to a prioritized response, reducing maintenance work while making dependable data delivery a managed operational capability.
How Data Observability Transforms Operations
Traditional monitoring asks whether a task ran. Data observability asks whether the data behaved as expected, whether consumers received it on time, and which change explains the deviation.
Consider a financial-services pipeline that receives transaction data from several operational systems. A source team adds a field and changes a type without coordinating with the data platform team. A scheduler may report success for extraction, while a downstream model drops values or changes its aggregation without notification. Schema tracking can identify the structural change at ingestion, quarantine the affected flow, and give engineers evidence before a reporting cycle depends on the output.
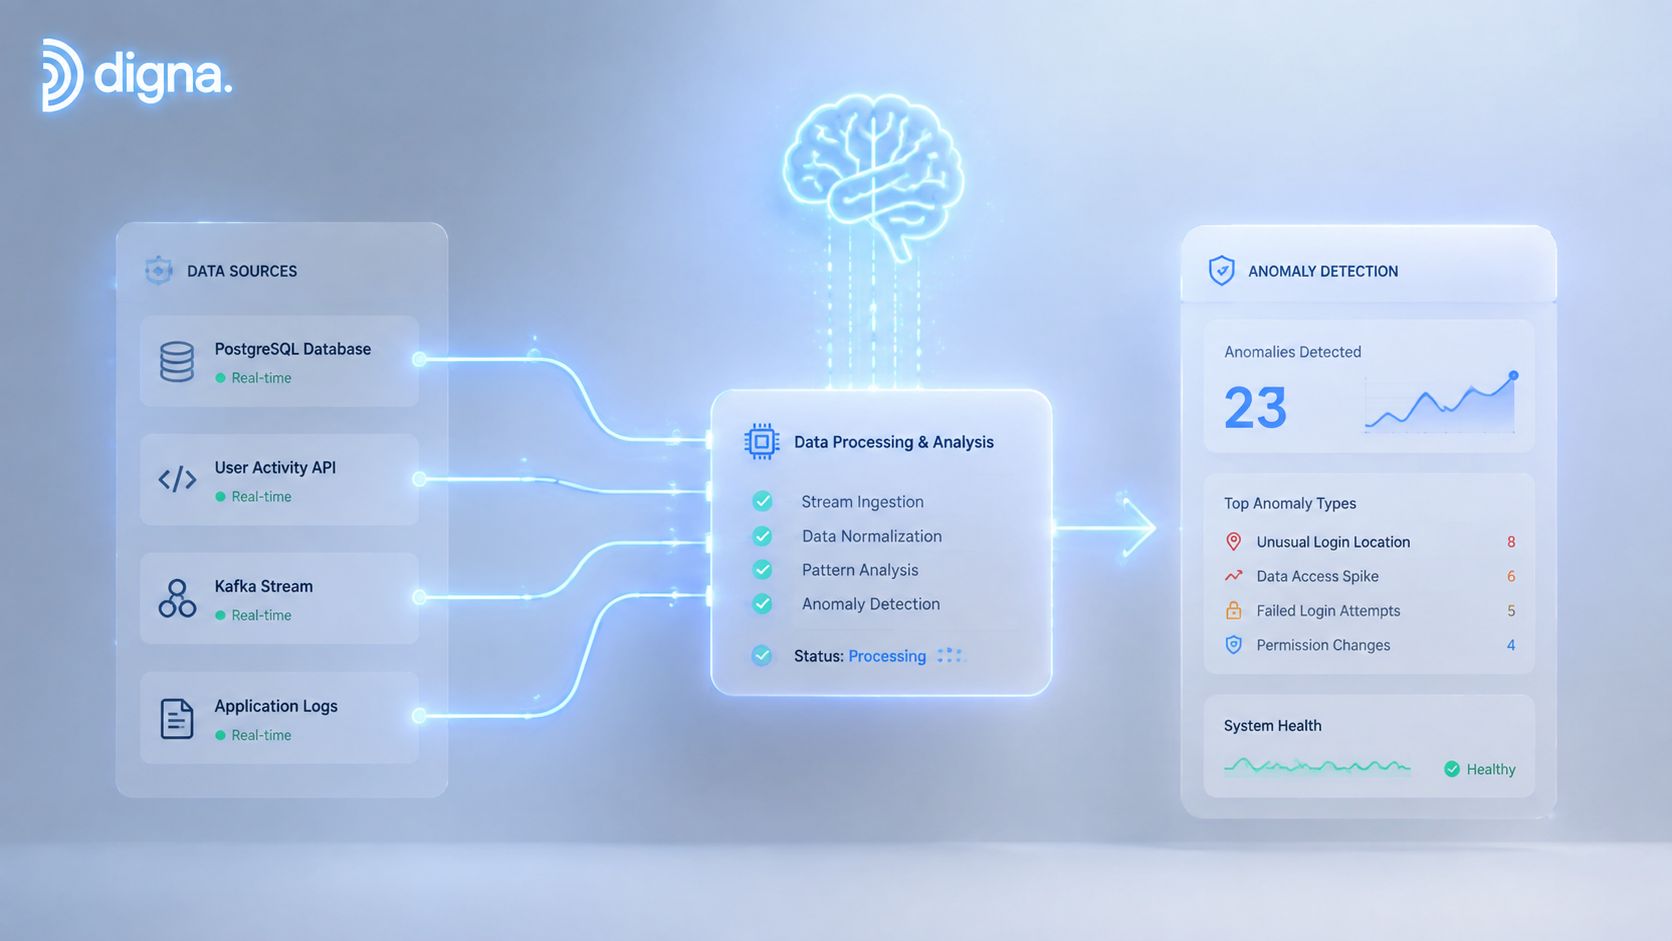
Healthcare pipelines create a different pressure. A dataset may arrive with a familiar schema but an unusual completeness pattern, missing a meaningful portion of expected records. Baseline anomaly detection can flag the behavioral shift, while validation checks can test required relationships and business rules. Timeliness monitoring then distinguishes a delayed feed from a feed that arrived on schedule but contains abnormal content.
Telecommunications teams often manage high-volume operational and customer data across heterogeneous systems. A useful observability layer should connect platform behavior with data behavior, so engineers can separate a workload problem, a source outage, a schema change, and a quality failure. For teams that operate both data platforms and reliability engineering practices, resources on infrastructure monitoring for SREs provide relevant context for thinking about signals, dependencies, and incident response.
digna can serve as one option in this category. It runs inside the customer's environment, performs checks in-database, monitors anomalies, timeliness, validation rules, schema changes, and platform metrics, and supports private-cloud or on-premises deployment. Its modular structure allows a team to start with one monitoring capability and expand across critical tables and pipelines, while a shared interface gives engineers, analysts, and stakeholders a common view of incidents and trends.
The strategic shift is measurable in workflow, even when the data itself stays in place. Engineers spend less time proving that a failure occurred and more time deciding whether to block, replay, remediate, or communicate the impact.
Implementing Observability in Your Environment
Start with the datasets that have clear business consequences. Map their sources, owners, downstream consumers, expected delivery behavior, key fields, and recovery dependencies. Don't begin by instrumenting every table. A narrow first scope produces clearer ownership and exposes gaps in contracts.
Next, establish a baseline for each selected dataset. Capture normal volume, arrival behavior, schema shape, null patterns, and validation outcomes. Configure alerts for deviations that require action, and route them to the team that can change the source, pipeline, or target. An alert that reaches nobody capable of remediation is only documentation of failure.
Add controls without replacing the existing scheduler. Airflow, dbt, Informatica, Talend, and Spark can continue orchestrating transformations while an observability layer evaluates behavior around them. Begin in a monitoring mode if blocking loads would create unnecessary risk, then promote high-confidence checks to quarantine or release gates.
Make incidents collaborative
Define an incident record that includes the violated expectation, affected data, first detection time, current status, owner, remediation, and follow-up action. Review recurring failures by business impact, not by alert count. A late low-impact dataset may rank below a subtle schema change in a regulatory feed, even if the latter produced no scheduler error.
Measure whether the practice is reducing time to detection, investigation effort, recurrence, stale delivery, and rejected data. Keep the review tied to business outcomes, such as dependable reporting and safer AI inputs. Observability becomes a strategic asset when leaders can see which reliability investments protect decisions and which pipeline changes create new exposure.
digna provides in-environment data observability for ETL pipelines, including anomaly detection, schema tracking, timeliness monitoring, record-level validation, and platform metrics. Visit digna to evaluate how its modular deployment model can help your team detect pipeline risk earlier and turn reliability work into an accountable operating practice.