Data Quality Testing: A Practical Guide
|
0
minuto de lectura

In a 2026 industry survey, 68% of respondents said detecting a data incident took four hours or more, compared with 62% in 2022. The average time to resolve an incident also rose by 166%, reaching 15 hours per incident (Monte Carlo's data quality survey). Those figures change the way data quality testing should be evaluated. The question isn't only whether a rule can identify an invalid value. It's how quickly your team can discover a failure, understand its scope, and stop unreliable data from reaching dashboards, models, and operational systems.
Static SQL tests still have a place. They're precise, reviewable, and useful for stable business rules. But periodic checks leave gaps between executions, and hand-maintained rules rarely keep pace with changing schemas, delivery schedules, and data behavior. Effective data quality testing combines deterministic validation with continuous observability, so teams monitor both correctness and the time it takes to detect and recover from failure.
Table of Contents
The Rising Cost of Delayed Data Incidents
A data incident becomes expensive when detection arrives after the data has already been used. A broken dashboard, questioned KPI, or contaminated model can trigger an investigation across pipelines and consumers. Engineers then reconstruct the change, identify affected datasets, and decide which outputs require a rebuild.
68% of respondents reported detection times of four hours or more, up from 62% in 2022, while average resolution time increased by 166% to 15 hours per incident (Monte Carlo's survey findings). These figures describe exposure time, not just testing performance. During that interval, unreliable information can move through reports, extracts, applications, and machine learning workflows.
MTTD and MTTR belong in the quality conversation
Traditional data quality testing checks whether records meet conditions such as non-null fields, valid types, or acceptable ranges. Those assertions measure correctness at the time they run. They do not show how long the organization remained unaware that the condition had failed.
Mean time to detect, or MTTD, measures the delay before a team knows an incident exists. Mean time to recover, or MTTR, measures how long it takes to restore trustworthy data or a reliable pipeline. A suite can produce accurate pass or fail results and still expose the business to avoidable risk if alerts arrive late.
Practical rule: Treat every quality check as an operational signal. Record when the condition changed, when the system detected it, who received the alert, and when the affected data became usable again.
Scheduled tests leave blind intervals. A source can stop loading, add a column, change a type, or produce an unfamiliar distribution between checks. Continuous observability narrows that interval by evaluating freshness, schema, values, and platform signals as data moves, rather than waiting for the next test run.
Incident priority should reflect business impact. A delayed executive KPI, a regulatory feed failure, and an unused staging table should not receive identical urgency. Lineage, ownership, and downstream usage help route attention to failures that can affect decisions or critical consumers. Teams can also use a tool to quantify the operational cost of data downtime when deciding which controls and alert paths deserve investment.
The operational objective is clear: correctness remains necessary, while detection latency determines how far a failure travels. Data quality testing delivers more value when it gives engineers timely evidence, usable context, and a direct path from anomaly to root cause.
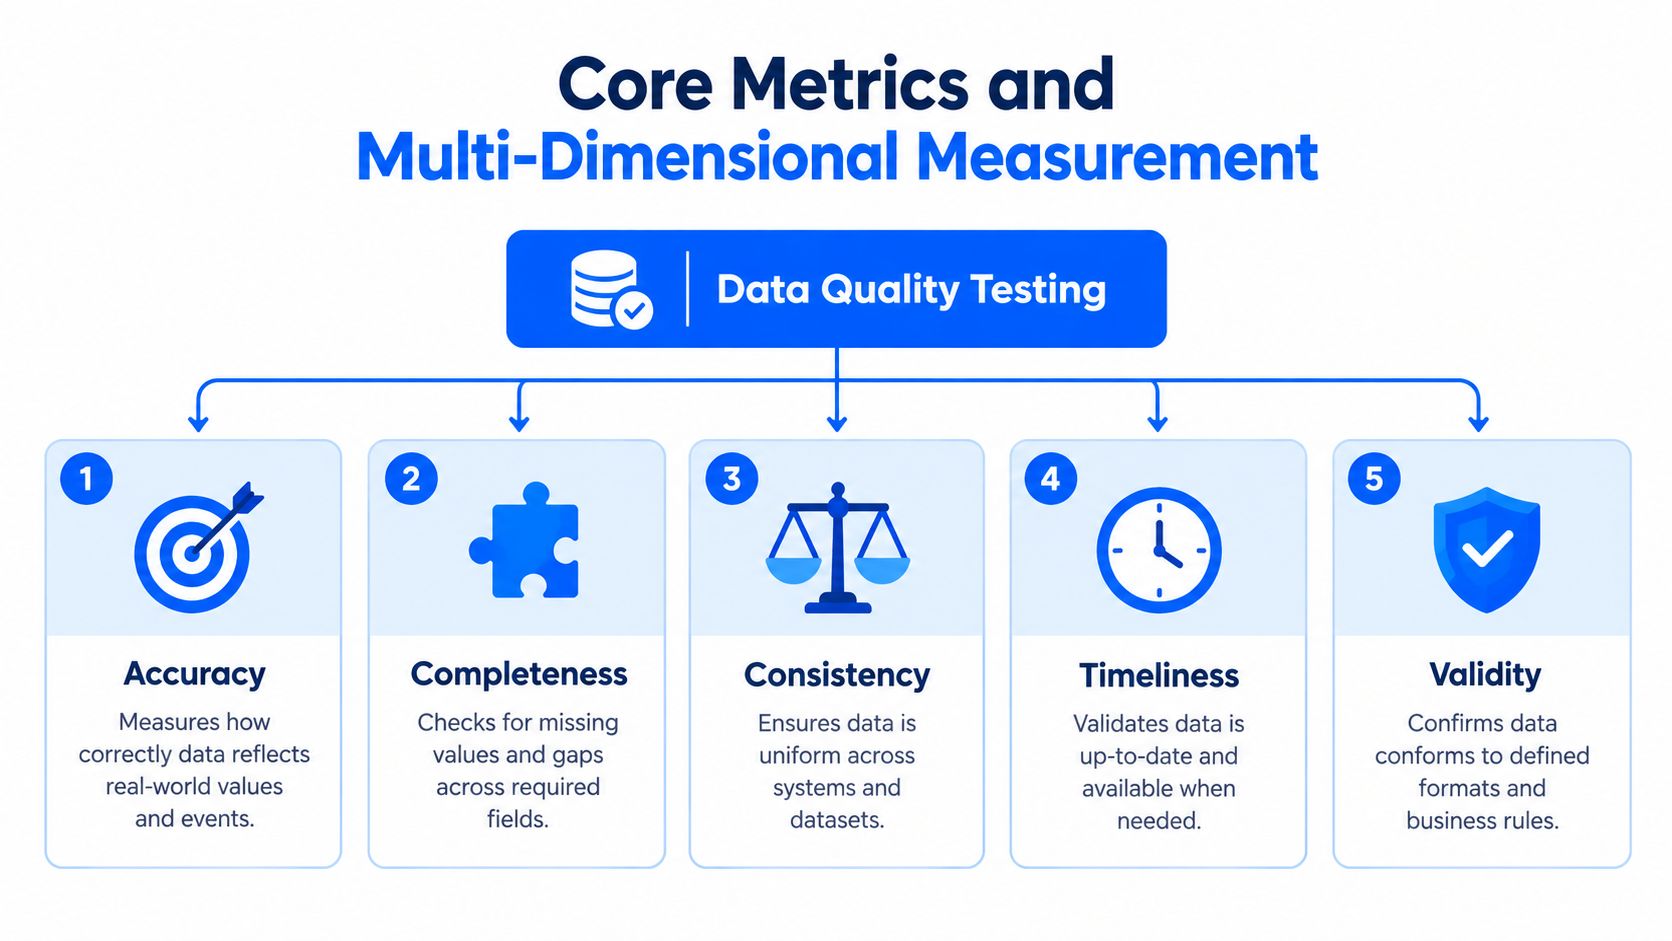
Core Metrics and Multi-Dimensional Measurement
A reliable quality program needs more than a single dashboard percentage. Profiling establishes statistical baselines, while data quality dimensions show whether a dataset remains suitable for its intended use. The operational question is how quickly a meaningful deviation becomes visible, not only whether a scheduled assertion eventually fails.
Start with the shape of the data
Profile a dataset before deciding which controls to enforce. Useful outputs include:
Volume and structure: Row and column counts expose missing loads, unexpected growth, and structural changes.
Missingness: Null percentages reveal whether required fields are becoming less complete.
Cardinality: Distinct and duplicate counts identify repetition, broken uniqueness, and identity problems.
Distribution: Minimum, maximum, mean, median, standard deviation, skewness, and frequency patterns show whether values still match their expected behavior.
The OpenMetadata data quality standard includes these profiling measures alongside operational indicators such as test pass or fail rate and mean time to detect and resolve issues. The combination connects two different views. Profiling describes what changed in the data, while operational measures show whether the team detected and handled that change quickly enough.
Test more than content
Schema and completeness checks can pass while a dataset remains unsuitable for a model or business process. Values may have valid types and few nulls, yet come from an untrustworthy source, represent outdated conditions, or reflect an imbalanced population.
An ETSI framework summary reports 18 metrics spanning fundamental quality, usability, fairness, and privacy. The ETSI framework coverage is a TelecomTV summary rather than the framework publication itself. Its coverage includes completeness, accuracy, consistency, lineage, traceability, timeliness, label quality, and bias. Together, these dimensions define quality through content, context, and governance.
A layered measurement design should ask:
Is the data present and structurally valid?
Does it accurately represent the intended events or entities?
Does it remain consistent across systems and transformations?
Did it arrive within the business window?
Can the team trace its origin, transformations, labels, and permitted uses?
Does it support fair and privacy-conscious analytics or model development?
Thresholds depend on purpose. A finance dataset may require strict reconciliation and traceability. An exploratory dataset may tolerate incomplete fields but still need freshness and lineage. Apply only the checks that can invalidate the intended use, then monitor those signals continuously so quality failures surface before downstream decisions rely on them.
Rule-Based Testing Versus Continuous Observability
Hand-written rules provide control. A SQL assertion can express an exact expectation, such as requiring a key to be unique or a status value to belong to an approved list. That determinism is valuable for contractual business logic, regulatory controls, and transformations whose expected behavior is known.
The problem appears when teams use static rules as their only line of defense. Each new source, table, column, and exception creates more maintenance work. Thresholds become stale, test coverage remains concentrated on the most visible datasets, and engineers spend time updating checks instead of investigating meaningful changes.
The distinction is easier to evaluate side by side:
Dimension | Rule-Based Testing | Continuous Observability |
|---|---|---|
Primary mechanism | Explicit SQL assertions and fixed conditions | Telemetry, profiling, baselines, and anomaly detection |
Best fit | Stable business rules and contractual constraints | Changing pipelines and unknown failure modes |
Strength | Transparent and deterministic | Broad coverage with less manual threshold management |
Weakness | Maintenance grows as systems change | Alerts require context and may need investigation |
Typical signal | Pass or fail against a defined rule | Deviation from expected behavior over time |
Incident response | Often starts after a failed check | Can surface freshness, schema, and distribution changes earlier |
Use each approach where it has leverage
Deterministic rules should guard invariants. Examples include referential integrity, permitted code lists, reconciliation logic, and required-field constraints. These checks explain exactly what failed and why, which makes them appropriate for release gates and audit evidence.
Observability handles behavior that's difficult to encode exhaustively. Baseline learning can identify unusual volumes, missing loads, schema drift, or value distributions without requiring an engineer to predict every valid variation. The operational research cited in warehouse and data quality monitoring analysis connects monitoring of volume, schema, and value anomalies with lower MTTD and MTTR because telemetry surfaces failures closer to when they occur.
Static rules tell you whether a known condition failed. Observability helps reveal that the system is behaving differently before you know which condition to write.
That doesn't make automated anomaly detection a replacement for engineering judgment. A seasonal change can look abnormal, and a legitimate schema addition can trigger an alert. Teams still need ownership, lineage, incident context, and suppression workflows. The practical pattern is to combine explicit checks for known obligations with adaptive monitoring for unknown changes.
Engineers who work across software and data reliability may also benefit from reviewing quality assurance work, particularly where test design, defect triage, and release discipline overlap with data pipeline operations. For a focused treatment of the hybrid model, see data validation rules and continuous data quality.
Aligning Technical Checks with Business Context
A pipeline can report a high test pass rate and still undermine a business decision. The failure usually starts with a mismatch between what engineers measure and what stakeholders mean by “good data.”
Finance may define a valid revenue record through posting status, accounting period, currency treatment, and reconciliation. Marketing may care about consent, identity resolution, attribution, and campaign freshness. Operations may prioritize delivery timeliness, inventory availability, or complete event coverage. The same underlying dataset can satisfy one team's definition while failing another's.
Assign checks to decisions, not just tables
Begin with the business question and work backward to the data conditions that make the answer trustworthy. For each important KPI or analytical product, document:
The consumer: Identify the team or process that relies on the output.
The definition: Record how terms such as “active customer,” “net revenue,” or “on-time delivery” are calculated.
The failure consequence: Describe what becomes wrong if the data is late, incomplete, duplicated, or misclassified.
The evidence: Specify which tests, lineage records, reconciliations, and incident logs prove that the output remains fit for use.
This creates a quality contract with a purpose. It also prevents teams from celebrating a metric that excludes the cases stakeholders care about.
Make changing definitions visible
Business definitions change, and pipeline schemas change with them. A new source column may alter a join, a renamed field may break a downstream model, and a revised KPI definition may require historical backfills. Metadata-driven lineage helps identify which consumers depend on a field or transformation, while warehouse-native validation keeps checks close to the data they protect.
Quality dashboards should expose scope, not just status. A passing score needs a visible metric definition, population, time window, and exclusion policy. Otherwise, teams may compare incomparable results or mistake narrow coverage for overall reliability.
A quality score is useful only when its audience understands what it includes, what it excludes, and which decision it protects.
The strongest programs let stakeholders participate in prioritization without asking them to write SQL. Data engineers implement controls, analysts validate definitions, and business owners approve the conditions that matter. That division of responsibility turns data quality testing from an engineering checklist into an accountable operating practice.
The Governance Gap in Test Data Management
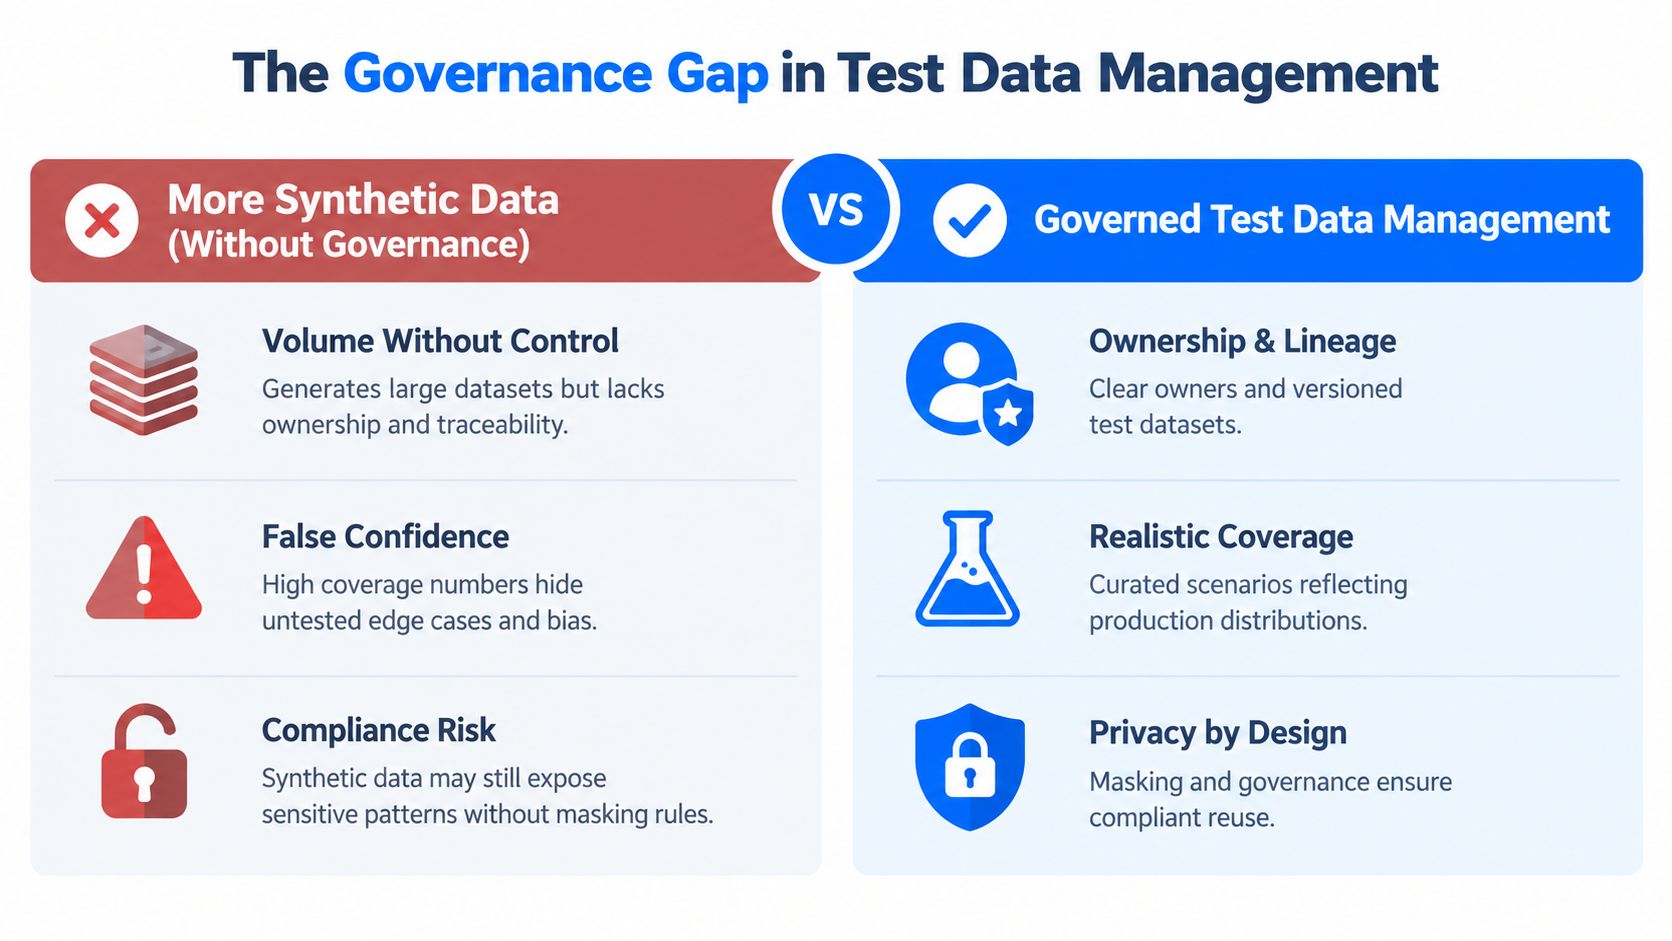
Synthetic test data can expand scenario coverage, but volume alone doesn't create trustworthy testing. Teams need to know who owns each dataset, which production characteristics it represents, how it was generated, and whether it can be reused safely.
The 2025 to 2026 World Quality Report summary reports that 95% of organizations use AI for test data generation, while only 10% have fully integrated AI-driven test data management and nearly 50% lack centralized ownership (World Quality Report summary). The same source reports that 35% rely on synthetic data for more than a quarter of their test data. Together, these findings describe a governance problem, not merely a generation problem.
More data can hide less coverage
Ungoverned synthetic data often looks productive because it produces many records quickly. Yet generated volume may omit rare combinations, realistic distributions, invalid transitions, or the edge cases that cause production failures. A test suite can therefore appear broad while remaining weak where actual risk is concentrated.
Governed test data management needs a clear operating model:
Ownership: Assign responsibility for dataset creation, approval, maintenance, and retirement.
Traceability: Record source characteristics, generation logic, transformations, versions, and intended test scenarios.
Policy enforcement: Apply masking, access, retention, and reuse controls consistently.
Coverage review: Compare synthetic scenarios with production behavior and known failure modes.
Integration: Connect test data workflows to delivery pipelines, quality results, and incident remediation.
Privacy also requires more than labeling data “synthetic.” Generated records can reproduce sensitive patterns or resemble real distributions closely enough to create exposure if teams skip masking and access controls. Governance must cover the entire lifecycle, from creation through storage, sharing, execution, and deletion.
The contrarian conclusion is practical: more synthetic data doesn't automatically mean better testing. Without centralized ownership and traceability, it can add fragmentation, false confidence, and blind spots. Teams should optimize for representative scenarios and accountable reuse, not record volume.
Building a Layered Testing Framework for ETL
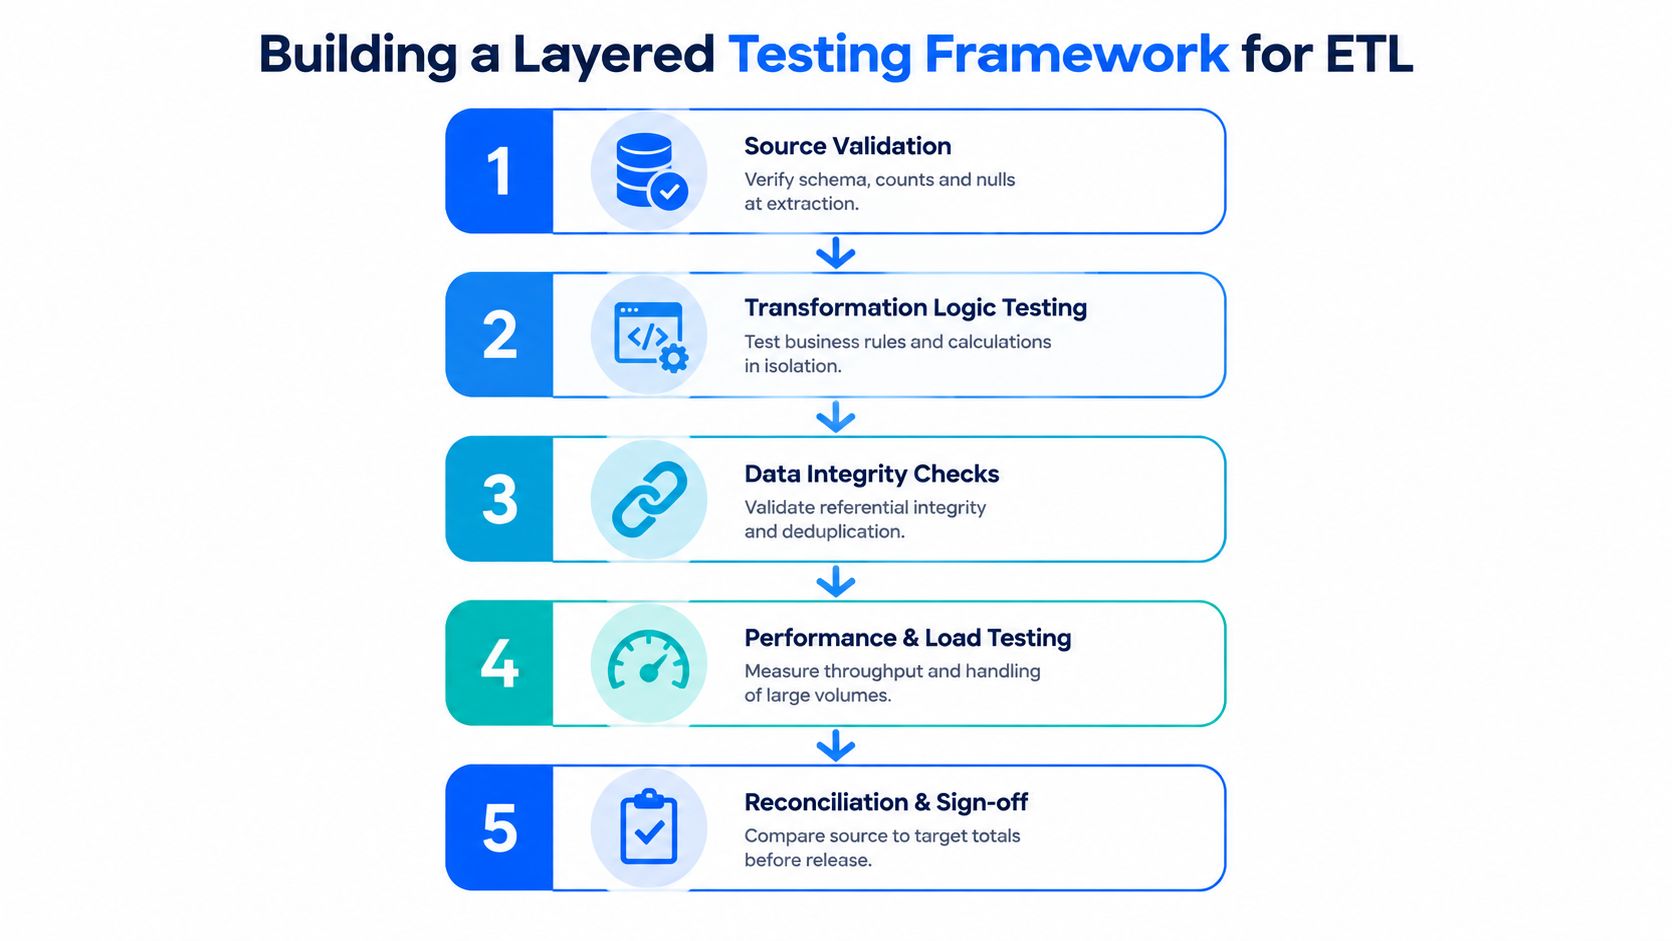
An ETL job should remain unverified until it passes freshness, schema, and record-level checks. Running those controls in sequence gives engineers a fast way to distinguish delivery failures from structural changes and content-level defects.
Start with delivery and structure
Freshness comes first. Confirm that the expected load arrived within the dataset's business window. A technically valid table that contains yesterday's data may still be unusable for an operational decision. Timeliness alerts should trigger when delivery delay crosses that defined window, rather than relying on a generic schedule that ignores business context.
Schema checks come next. Monitor for added columns, removed columns, and data type modifications. Some changes are compatible and intentional, while others break transformations or alter downstream meaning without warning. The alert should include the affected object, change type, owner, and downstream dependencies.
Record-level validation follows. Test null presence, exact values, thresholds, ranges, reference lists, duplicates, relationships, and business rules. Keep these checks close to the transformation or target layer where the relevant semantics are available.
For implementation, use a release gate that records each layer independently:
Source validation: Confirm expected structure, volume, and required fields before transformation.
Transformation logic: Test calculations, mappings, filters, and business rules in isolation.
Integrity validation: Check referential relationships, uniqueness, deduplication, and reconciliation.
Performance observation: Monitor execution behavior, throughput, and handling of the workload.
Release sign-off: Compare source and target evidence, then record the decision and any approved exceptions.
Calculate correctness where the data lives
SQL-based validation rules can execute natively on the source compute engine, avoiding unnecessary extraction for record checks. Actian's documentation describes a concrete correctness calculation based on the percentage of records where is_valid = 1 (record-level data quality validation). The useful pattern isn't the label itself. It's the ability to calculate a transparent record-level result close to the source and retain the failed-record evidence for remediation.
For an overview of ETL concepts applied to testing workflows, see what ETL means in software testing. The implementation detail that matters most is failure handling. A failed freshness check should stop or quarantine downstream publication, while a small number of invalid records may route to remediation depending on the dataset's risk and business policy.
Scaling Quality with In-Database Observability
Continuous data quality testing becomes difficult when every metric requires data movement, separate infrastructure, and a different interface. In-database observability changes the architecture by computing and analyzing quality signals inside the customer's existing environment.
That design reduces unnecessary movement and keeps access controls aligned with the systems that already protect production data. It also lets engineers monitor warehouse tables, lake assets, and pipeline outputs without creating a parallel copy solely for quality analysis. For teams with strict security or governance requirements, the distinction is important: the platform analyzes data where it resides rather than requiring production records to leave the environment.
Combine statistics, rules, and operational context
A practical observability layer should unite several forms of evidence:
Statistical baselines: Learn normal volume, distributions, and volatility for each dataset.
Deterministic validation: Enforce business rules and record-level constraints.
Timeliness monitoring: Detect late, missing, or unexpectedly early deliveries.
Schema tracking: Identify added or removed columns and type changes.
Lineage and ownership: Connect incidents to affected consumers and responsible teams.
Shared status: Give engineers, analysts, and business stakeholders a common view of quality.
The in-database data quality execution approach is useful when teams need these controls without exporting sensitive production data. The trade-off is that observability still needs thoughtful configuration. Baselines can produce noisy alerts if teams ignore seasonality, ownership is unclear, or consumers can't see why an incident matters.
The durable operating model treats data quality as a service level for information. Teams define what must be correct, what must arrive on time, and which changes require review. Monitoring then measures not only whether the condition failed, but also how quickly people detected and resolved it.
Data quality testing isn't a one-time migration task. It's a continuous practice that protects analytics, reporting, and AI systems from silent changes and delayed response.
digna provides in-database anomaly detection, record-level validation, timeliness monitoring, and schema tracking inside your own data environment. Visit digna to evaluate how its modular observability platform can help your team detect quality failures earlier and connect technical incidents to the datasets and decisions they affect.