Data Analytics Events Explained from Tracking to Trust
|
7
minuto de lectura

You've got a dashboard that looks calm, the team's still shipping, and yet one morning the numbers don't quite line up with what sales, product, and support are seeing. That's the quiet danger of data analytics events. The code may still fire, but if the event meaning drifts, the dashboard can keep telling a story that no longer matches reality.

That's why reliable events aren't just a tracking problem. They're a data contract problem, and the contract has to hold up across engineers, analysts, and the business. If the event model is vague, every downstream funnel, attribution model, and feature pipeline inherits that ambiguity. If the model is clear, the rest of the stack gets easier to trust. See the related idea of reliable data as valid data for the bigger quality mindset behind that trust.
Key idea: an event is only useful when its meaning stays stable enough for people and systems to rely on it.
The practical path is simple, even if the details take discipline. First, understand what an event really is. Then design the model so it scales with product change. After that, remove the common failure modes that corrupt data. Finally, keep validating the stream as a living contract, not a one-time checklist.
Table of Contents
Introduction Why Analytics Events Make or Break Trust
What Data Analytics Events Really Are and How They Work
The three parts that matter
From raw interaction to analytics pipeline
Designing an Event Model That Scales With Your Product
Start with categories, then name the event cleanly
Decide which fields are required
Common Pitfalls That Corrupt Event Data and How to Avoid Them
Healthy versus unhealthy patterns
Watch for timing and timezone mistakes
Validating Event Quality With Contracts and Observable Signals
Five signals that reveal different kinds of trouble
Baselines beat fixed thresholds for bursty traffic
Putting Event Observability Into Practice With digna
Building Reliable Analytics Events for the Long Term
Introduction Why Analytics Events Make or Break Trust
A dashboard can look healthy while the event stream underneath has already started to drift. A product manager sees the signup graph. An analyst sees the same graph. A data engineer checks the pipeline and notices nothing broken. The trap is that the system can be technically “up” while the event meaning has shifted just enough to distort decisions.
That's why data analytics events sit at the foundation of almost every metric people care about. They feed funnels, retention views, experimentation readouts, marketing attribution, operational alerts, and ML features. When the event definition is fuzzy, each team fills in the blanks differently, and those differences don't always show up until someone asks why two reports disagree.
The field itself has deep roots. The IEEE International Conference on Data Science and Advanced Analytics (IEEE DSAA) describes itself as the premier data science forum, with joint support from IEEE, ACM, ASA, and CCF as described in the analytics events ecosystem overview. That kind of institutional backing is a strong signal that analytics events aren't a side topic, they're part of the core professional infrastructure of the field.
The other shift is practical. Event attendance ratios in professional settings also show how often real-world participation differs from the number on the registration list. In a 2026 benchmark, in-person events typically convert about 60% to 70% of RSVPs into actual attendees, live virtual events convert about 40% to 50% of registrations into attendance, and in-person professional and academic conferences often see a 30% to 40% no-show rate source. That same pattern matters in analytics work, because teams also need to plan for drop-off between intent and actual data behavior.
What Data Analytics Events Really Are and How They Work
A useful way to think about an event is as a receipt for an action. A receipt says what happened, when it happened, and enough context to understand it later. Without that context, a receipt is just a scrap of paper. In analytics, a raw click, view, submit, or error becomes useful only after it's turned into structured event data.
The three parts that matter
Every solid event needs three ingredients. Action tells you what happened, like a page view, button click, or form submission. Context tells you where and how it happened, like page, device, user ID, or app version. Time tells you when it happened, which matters because timing often changes the meaning of the event.
Practical rule: if you can't explain the action, context, and time in plain language, the event is still too loose to trust.
That structure is why event-driven analytics works across product, marketing, and operations. A marketer can look at campaign traffic. A product analyst can inspect a funnel. An engineer can trace an error path. They're not asking the same question, but they're all reading the same underlying signal.
From raw interaction to analytics pipeline
The journey usually starts with a raw interaction in an app or service. That interaction gets captured as an event, sent through a stream or collection layer, and then landed in a warehouse or lakehouse where analysts and models can use it. The important part isn't just the movement, it's the consistency of meaning at each step.
People often confuse events with entities or sessions. An entity is the thing you care about, like a user or account. A session is a bounded period of activity. An event is a single observed fact. If those blur together, teams start overloading fields, and the model becomes hard to extend.
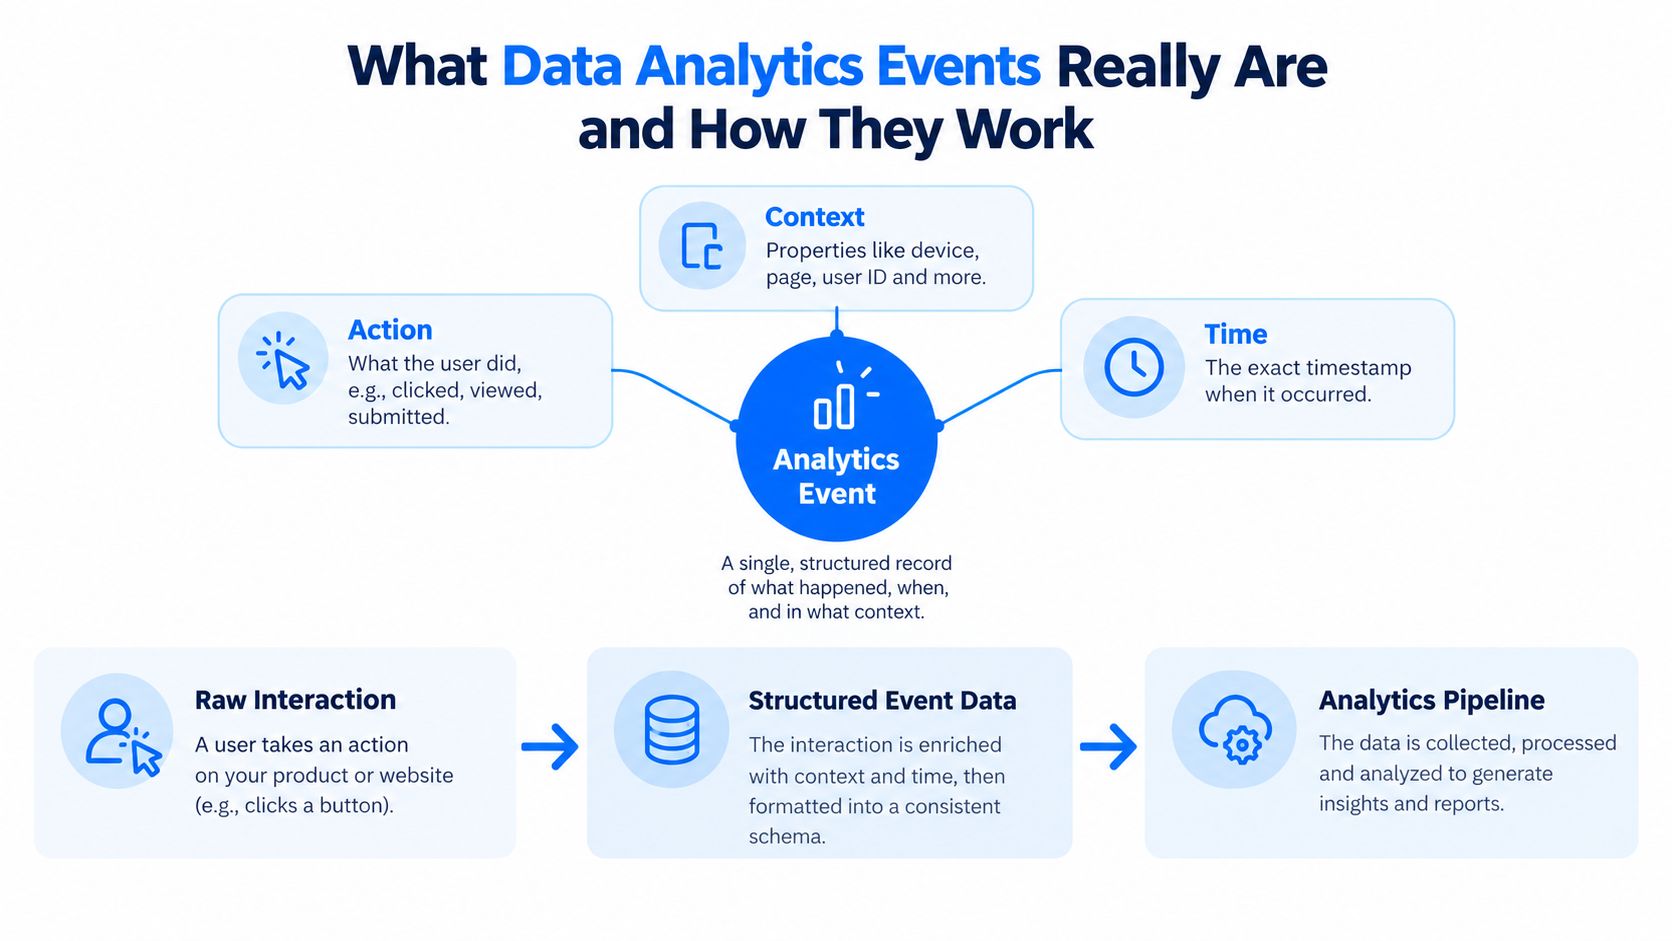
When the semantics stay stable, downstream work gets easier. Event data can support dashboards, experiments, recommendation features, and operational monitoring without each team inventing its own version of the truth.
Designing an Event Model That Scales With Your Product
A scalable event model starts with restraint. Teams often want to instrument everything at once, then end up with a crowded catalog of near-duplicate events that nobody can explain six months later. A better model keeps the taxonomy small, names things clearly, and separates what happened from the details around it.
Start with categories, then name the event cleanly
A durable taxonomy usually begins with broad categories such as user actions and system events. From there, the naming convention should stay consistent, often in a verb_noun style like user_signed_up or invoice_failed. That pattern helps both humans and machines read the event without guessing what part is the action and what part is the subject.
The next decision is whether a detail belongs in a new event or a property. If the core action is the same, but one attribute changes, keep it as a property. If the action itself changes in meaning, create a new event. That separation prevents the model from turning into a long list of special cases.
Decide which fields are required
Every event should have a short list of required fields that make the record usable. Identity, timestamp, and core context usually belong here. Optional properties can add color, but they shouldn't be required for basic interpretation, because that makes instrumentation brittle.
Identity resolution also needs deliberate thought. A user may appear as anonymous first, then authenticated later. If the model can't connect those states cleanly, funnel analysis and lifecycle reporting become noisy. The same event may still be technically valid while being analytically incomplete.
For teams that want a warehouse-first structure, the idea connects closely to the discipline of fact and dimension tables. Events act as the facts, while the contextual fields help analysts slice them in stable ways.

Good event models make future questions easier to answer, not harder to ask.
Documentation matters as much as naming. Engineers need the implementation details, and analysts need plain-English definitions. If both groups can read the same contract, product changes stop creating surprise interpretations.
Common Pitfalls That Corrupt Event Data and How to Avoid Them
Most event problems don't look dramatic at first. The pipeline still runs. The dashboard still refreshes. The issue is that the data becomes less honest over time, and the corruption tends to show up in analysis before it shows up in alerts.
Healthy versus unhealthy patterns
Unhealthy pattern | Why it hurts | Healthier pattern |
|---|---|---|
Inconsistent naming | Split metrics, broken joins, confused readers | Standardized naming across teams |
Missing properties | Analysts lose context and default to guesses | Required fields for critical context |
Overloaded properties | One field means too many things | Single-purpose events and clear properties |
Duplicate firing | Funnels overcount, attribution gets noisy | Deduplication at capture or ingestion |
Implicit defaults | Silent coercion hides real behavior | Explicit values and documented rules |
The hardest problem is usually not bad intent, it's drift. A producer changes a field name, drops a property, or starts sending a different shape without telling the downstream team. That's why schema drift breaks data pipelines so often, and why the event catalog needs active ownership.
Watch for timing and timezone mistakes
Timing errors are easy to miss because the event still arrives. It just arrives in the wrong bucket, on the wrong day, or with the wrong time zone assumption. For operational metrics and cohort analysis, that can bend the story without breaking the query.
Duplicate events create a different kind of damage. A user clicks once, but the platform records it twice. A funnel step looks stronger than it is. A model feature gets inflated. The fix is usually not more dashboards, it's clearer capture rules and validation logic.
Practical rule: if a field can mean two different things, split it before the ambiguity spreads.
The safest review habit is to trace each event from producer to dashboard and ask one question at every hop, “Does this still mean the same thing?” If the answer changes, the contract needs work before more consumers rely on it.
Validating Event Quality With Contracts and Observable Signals
A data analytics event should behave like a contract with a pulse. The agreement is set before anyone ships, then the pipeline keeps checking whether real events still match it in production. That contract mindset is what the data contracts guide is built around.
Five signals that reveal different kinds of trouble
Modern observability usually tracks freshness, quality, volume, schema, and lineage as outlined in the observability model. Freshness asks whether data arrived when expected. Quality asks whether values and types still make sense. Volume checks whether the count looks normal. Schema checks whether the structure changed. Lineage shows where the data came from and how it moved.
Each signal points to a different failure mode. Freshness catches late or missing deliveries before dashboards drift, which is why delivery windows should match how the business uses the data as described in timeliness guidance. Schema monitoring catches added fields, removed fields, renamed fields, and type changes, which is exactly what schema drift monitoring is meant to surface as described in the schema monitoring overview.
Baselines beat fixed thresholds for bursty traffic
Event traffic rarely stays flat. Launches, campaigns, and business cycles all shift the shape of the stream. Rolling, seasonality-aware baselines work better than fixed thresholds for many event streams because they compare current behavior with a like-for-like period instead of assuming every day should look identical as recommended in event drift detection practices.
Contract validation should happen as early as possible, ideally at ingestion. Additive changes can be safe when they preserve backward compatibility. Breaking changes should be quarantined. Raw fields should stay available when coercion would erase meaning. That discipline reduces silent breakage and keeps alert noise from spreading through the team as described in event-stream contract guidance.
Signal | What it answers | What failure it can reveal |
|---|---|---|
Freshness | Did it arrive on time? | Late loads, missed deliveries |
Quality | Is the data valid? | Bad types, invalid values |
Volume | Is the count expected? | Missing batches, duplicate floods |
Schema | Did structure change? | Added, removed, renamed fields |
Lineage | Where did it come from? | Unclear source, hidden transformation |
The goal is not more rules. It is making event behavior visible enough that analysts and engineers can trust the data without reading every log line.
Putting Event Observability Into Practice With digna
Operationalizing event quality means treating the pipeline like a live system, not a static asset. Teams need a way to watch delivery timing, detect structural change, and surface unusual behavior without wiring a separate rule for every dataset.
digna does this by running inside the customer's own environment and computing checks in-database, so the data stays in place. Its module set includes timeliness, schema tracking, data validation, and data anomalies, with a shared dashboard for engineers, analysts, and governance stakeholders. That setup matters because the same event stream often has to serve reporting, alerting, and model inputs at once.
For teams who want a broader operational reference, the data observability overview shows how those pieces fit together in production environments. The core idea is simple. Timeliness checks verify expected delivery windows. Schema tracking catches added or removed fields and type changes. Anomaly detection can learn normal behavior and surface deviations without hand-built rules.
That mix is especially useful when product teams ship often. A change that looks harmless in a pull request can still shift event shape, delay a feed, or alter downstream counts. Monitoring catches the effect where it matters, on the actual data path.
If you're comparing operational tooling for event-heavy systems, polybacktest prediction market tools is a useful adjacent reference for how observability thinking shows up in other event-driven workflows. The general lesson carries over cleanly, because event data becomes trustworthy when quality is measured continuously, not assumed after deployment.
Building Reliable Analytics Events for the Long Term
Reliable events don't happen by accident. They come from a chain of decisions, from the first definition of an action to the checks that keep that definition honest over time. If one link is weak, the whole analytics stack feels it.
The simplest way to prioritize is to ask three questions. Which events drive the most important decisions? Which ones are most likely to drift as the product changes? Which ones lack a clear owner? Fix those first, because those are the events most likely to create quiet analytical damage.
Ownership matters as much as tooling. Engineers need to know who approves schema changes. Analysts need to know which definitions are stable. Governance teams need visibility into what changed and when. When those roles are clear, event quality stops being everyone's problem and becomes a managed process.
The long-term win is not just cleaner dashboards. It's faster analysis, less rework, and more confidence when teams use analytics to guide product and AI systems. If your event catalog still feels fragile, audit the definitions, tighten the contracts, and put observability on the critical path before the next silent drift lands in production.
If you want a practical way to make event data easier to trust, visit digna and review how its in-database validation, schema tracking, timeliness monitoring, and anomaly detection fit into one operational workflow. It's built for teams that need reliable analytics events to stay reliable as products, pipelines, and consumers keep changing.


