Real Time Data Monitoring
|
0
min. Lesezeit

A dashboard looked fine on Friday. By Monday morning, the executive team had already discussed the numbers, sales had reprioritized accounts, and finance had reused the same dataset for a forecast. Then someone noticed the weekend load had stalled. The charts were “green” because the BI tool was healthy. The data underneath it was not.
That's the gap many teams are sitting in right now. They have infrastructure monitoring, pipeline logs, warehouse query history, and maybe a few row-count checks. But they still miss the failures that matter most: late-arriving data, silent schema changes, drift in key fields, and records that technically landed but shouldn't be trusted. Real time data monitoring only starts to pay off when it covers the data itself, not just the systems around it.
The practical shift is this: stop treating monitoring as an ops-only concern. Treat it as a control layer across ingestion, transformation, storage, and delivery. The teams that do this well catch stale reports before a leadership meeting, stop bad features from reaching customer-facing dashboards, and avoid exporting sensitive data just to observe it.
Table of Contents
Why Real Time Monitoring Is No Longer Optional
Real time data monitoring became a business requirement the moment teams started making daily decisions from live dashboards instead of static reports. If a critical report goes stale over a weekend and nobody notices, the failure isn't just technical. Leaders act on the wrong picture, analysts waste hours reconciling numbers, and trust in the data platform drops.
What changed is scale and expectation. The data observability market is projected to grow from USD 1.7 billion in 2025 to USD 9.7 billion by 2034 at a CAGR of 21.3%, which points to a broad shift toward proactive data health management, not occasional troubleshooting, according to Fortune Business Insights on the data observability market.
That growth makes sense from a practitioner's perspective. Teams typically already monitor compute, storage, API uptime, and orchestrator status. But those controls don't answer the questions stakeholders care about:
Did the sales data arrive when it was supposed to?
Did yesterday's schema change break downstream models?
Did a source system start sending values outside the normal pattern?
Did the dashboard refresh with incomplete records?
Real time monitoring that only tells you the pipeline ran is incomplete. A successful job can still publish bad data.
Many teams conflate observability with simple health checks. They aren't the same. A warehouse can be up, a dbt job can finish, and a dashboard can still be wrong because the data arrived late, changed shape, or drifted unnoticed. That distinction is central when comparing data observability vs data quality.
The real cost is trust erosion
The hardest failures to recover from aren't the loud ones. It's the quiet ones. Broken jobs get attention. Silent data issues linger long enough to spread into executive reporting, reverse ETL syncs, and model features.
A mature real time data monitoring approach exists to surface those issues before users find them first. That's why this is no longer optional. It protects decisions, not just pipelines.
Core Architectures for Capturing Data in Motion
Some teams hear “real time” and immediately jump to Kafka, Flink, and a full streaming stack. Sometimes that's right. Often it's not. The architecture should follow the decision window you're trying to support.
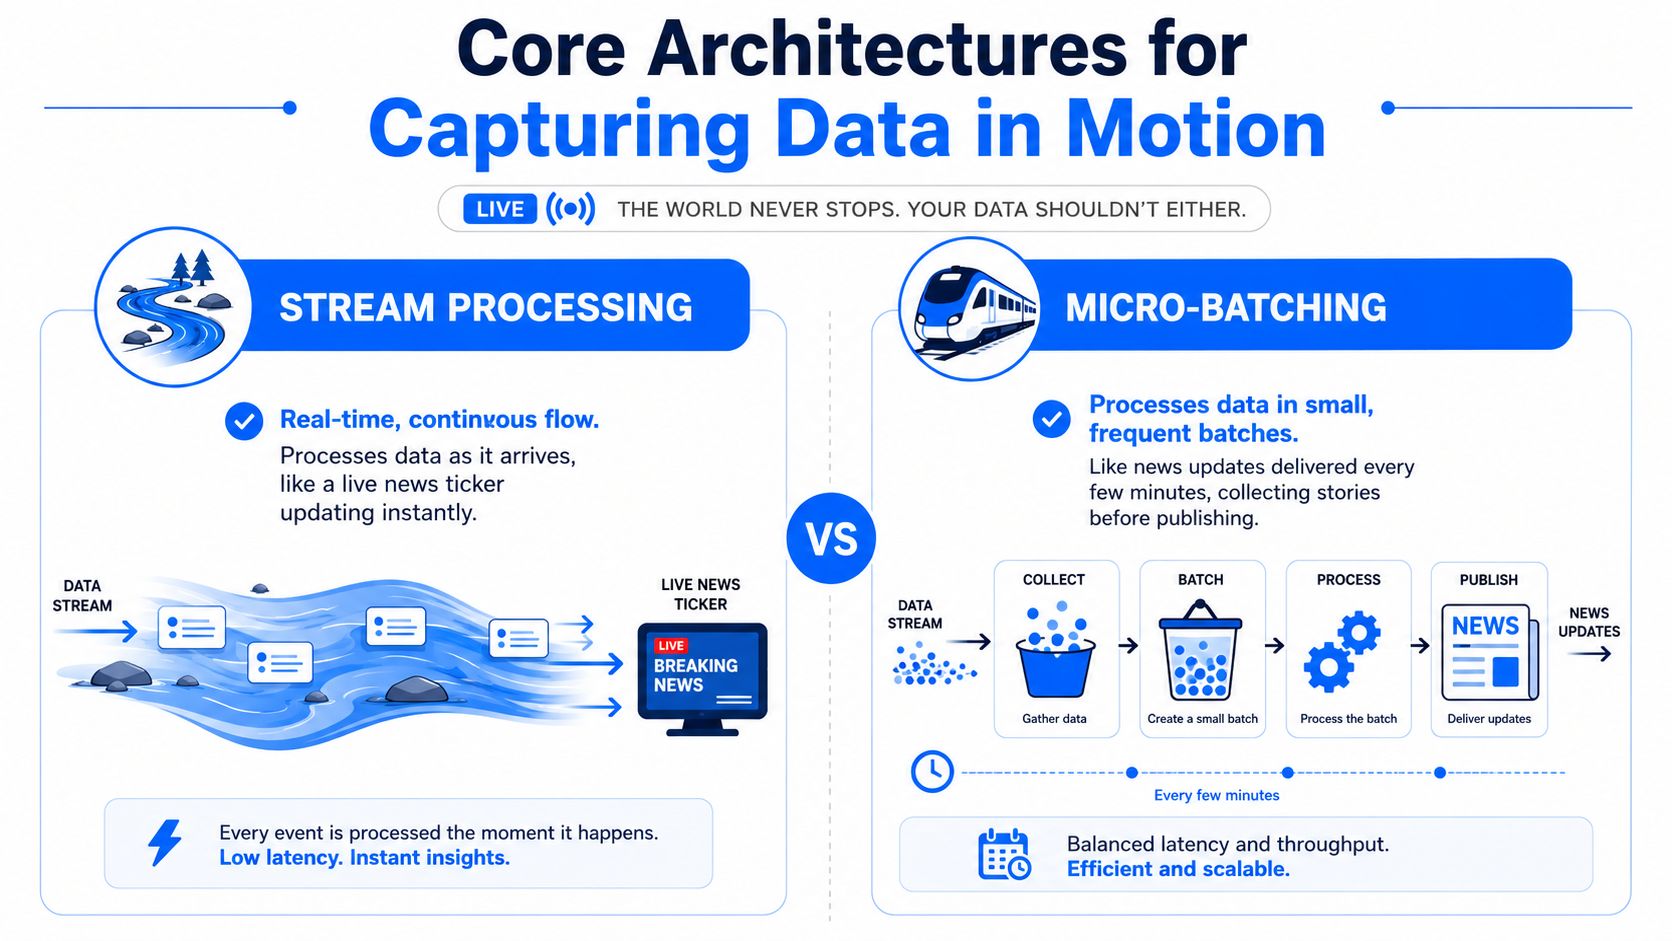
Streaming and micro-batching solve different problems
A simple way to explain the trade-off is a live news feed versus scheduled bulletins.
Stream processing behaves like the live feed. Events are processed as they arrive. Micro-batching behaves like frequent news updates. The system collects events over a short interval, then processes them together. Both can be useful. They just optimize for different things.
A short comparison makes the trade-off clearer:
Approach | Best fit | Strength | Main cost |
|---|---|---|---|
Streaming | Fraud detection, industrial alerts, operational control loops | Lowest latency | Higher operational complexity |
Micro-batching | Dashboards, operational analytics, many business workflows | Simpler and cheaper to run | Accepts small delay |
The technical definition matters here. Real-time data processing delivers output with latency measured in seconds or milliseconds, distinguishing true real-time under one second from near real-time in seconds to minutes. Stream processing layers such as Apache Flink compute aggregates on the fly to detect anomalies instantly, as described in Splunk's overview of real-time data.
That distinction prevents a lot of architecture mistakes. Don't build a sub-second system for a dashboard nobody checks more than a few times per day. And don't rely on five-minute micro-batches for a use case where every second matters.
In-database monitoring changes the security model
There's another architectural choice that is often underestimated. Where does the monitoring logic run?
Traditional SaaS monitoring tools often pull metadata, samples, or raw data into a vendor-controlled environment. That can work for some cases, but it adds data movement, increases review overhead for security teams, and can be hard to justify in regulated environments.
An in-database design changes the equation:
Data stays resident in your warehouse, lake, private cloud, or on-prem environment.
Metrics are computed close to the data, which reduces movement and often simplifies latency.
Security reviews are cleaner because you're not creating another external copy path.
Privacy-sensitive tables remain under your control, even while being monitored.
Practical rule: If your monitoring tool needs broad access to export production data, treat that as an architecture decision, not a feature checkbox.
This matters even more when you're dealing with structural changes. Schema drift tends to break downstream consumers unnoticed, especially when producers add columns, change types, or alter nested payloads without coordination. A useful primer on that failure mode is this explanation of schema drift and pipeline breakage.
What works in practice is matching architecture to urgency, then keeping monitoring close to the data. What doesn't work is copying large volumes into a separate monitoring estate and hoping that more tooling will compensate for more distance.
The Six Pillars of Real Time Data Health
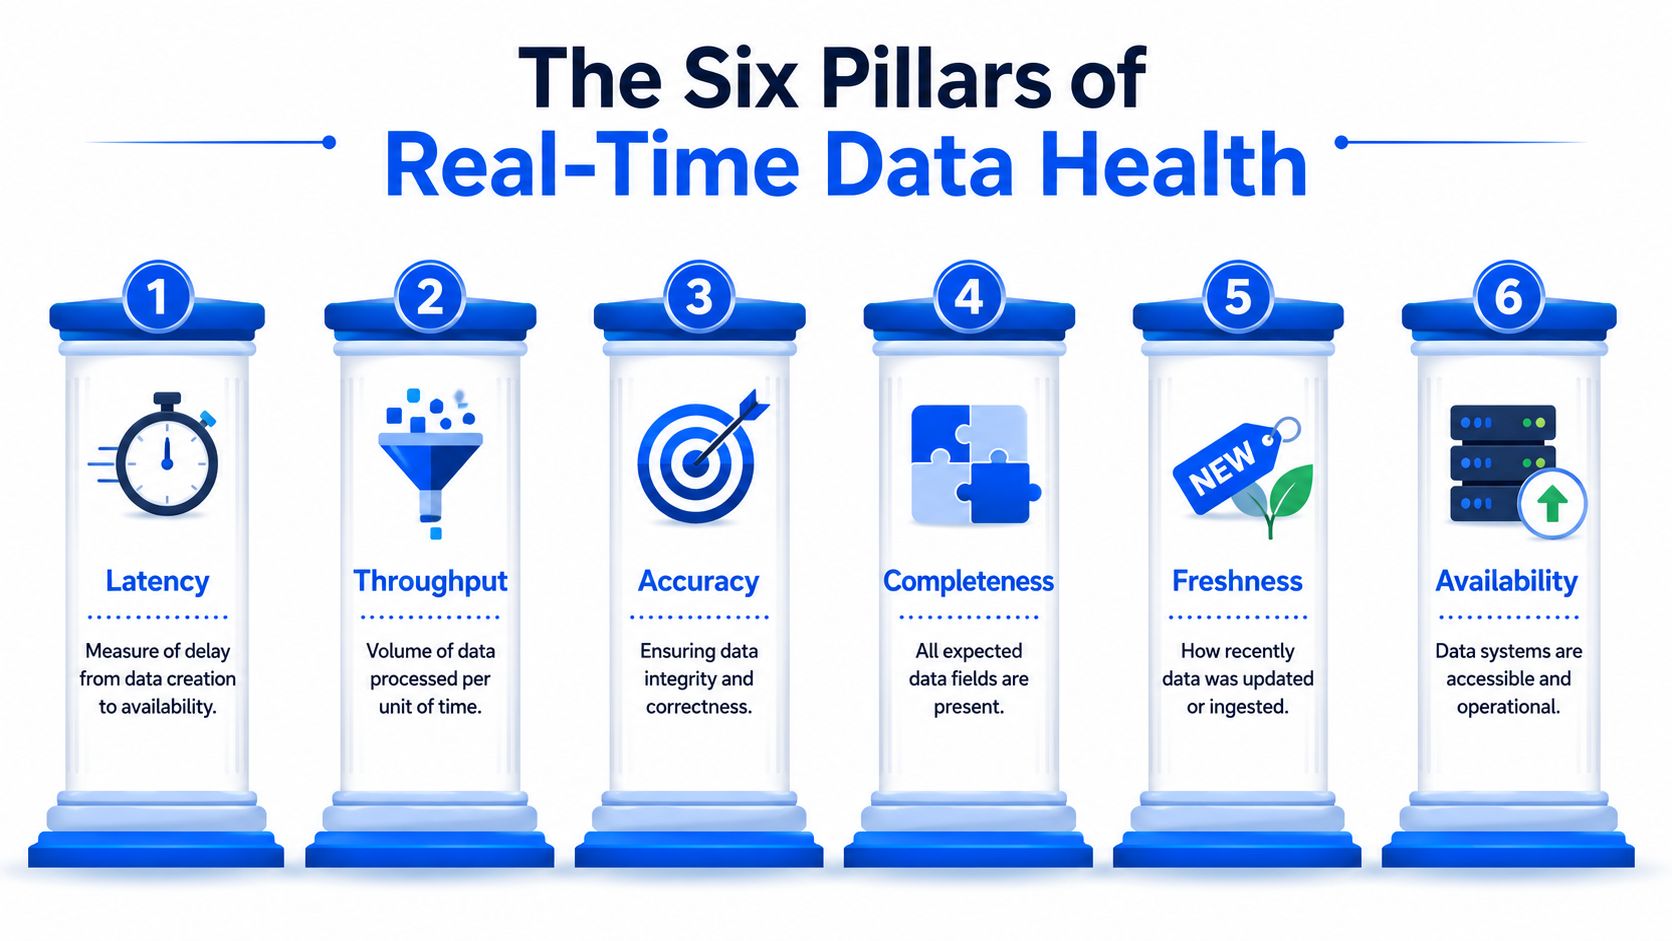
Monitoring gets fuzzy when teams don't agree on what “healthy” means. The fix is to define a small set of signals that reflect how data behaves in motion. For operational work, I treat real time data monitoring as six pillars: latency, throughput, accuracy, completeness, freshness, and availability.
What healthy signals look like
Think of these pillars as different failure detectors, not interchangeable metrics.
Latency is the delay between event creation and usable availability. In practice, this tells you whether your pipeline is keeping up with the business process it supports.
Throughput is the volume processed over time. Drops can signal ingestion failures, throttling, source outages, or blocked consumers.
Accuracy asks whether values are correct. A row can arrive on time and still be wrong.
Completeness checks whether expected records or fields are present. Partial loads often look successful until a downstream model or dashboard reveals gaps.
Freshness measures how old the data is when someone consumes it. This is what business users usually mean when they ask whether a dashboard is current.
Availability tells you whether the monitored data system can be queried or served.
A quick way to remember the difference is this:
Pillar | Practical question |
|---|---|
Latency | How long did it take to arrive? |
Throughput | Are we processing enough of it? |
Accuracy | Are the values right? |
Completeness | Did anything go missing? |
Freshness | How old is what users see? |
Availability | Can teams access it at all? |
Where silent failures usually start
The difficult part isn't defining these pillars. It's recognizing their failure patterns early enough to act.
Timeliness and freshness get confused all the time. A feed may arrive exactly on schedule but contain old source records. Or it may contain current data but land late enough to miss a reporting cutoff. Those are different incidents and need different owners.
Anomaly signals are another common blind spot. A metric can remain within static thresholds while still deviating from its normal daily or weekly pattern. That's why learned baselines usually outperform hand-written thresholds once the environment gets complex.
Then there's schema drift, which often begins outside the data team. An application team ships a change, the raw ingestion still “works,” and only later do transformations, semantic models, or ML features start failing or producing nonsense.
A healthy real-time pipeline is not the same as a healthy real-time dataset.
For teams that want a broader framework around these controls, data quality dimensions and how to measure them at scale is a useful reference point. The main operational lesson is simpler: measure enough dimensions to catch silent failures, but not so many that nobody can tell which alert matters.
Designing Alerts and SLAs That People Actually Use
Most alerting systems fail for a boring reason. They generate too much noise, too little context, or both. Engineers mute them, stakeholders stop trusting them, and the only alerts that get attention are the ones that arrive after users have already noticed the issue.

Static thresholds create noise
A static rule like “alert if volume drops by 10%” sounds sensible until you apply it to real production data. Weekends look different from weekdays. End-of-month behaves differently from mid-month. Product launches, backfills, and customer seasonality distort normal patterns.
That's why static thresholds age badly. They don't adapt, so teams end up with one of two bad outcomes:
Too sensitive, which creates alert fatigue.
Too loose, which misses the incidents that matter.
What works better is to anchor alerting to expected behavior and business deadlines. If a revenue feed is due before finance closes reporting, the alert should reference that dependency. If a patient monitoring stream must remain current for clinical workflows, the alert should reflect the operational risk of late, missing, or suspicious data.
Good alerting starts with business impact
Healthcare makes this obvious. In the U.S. alone, the number of people using Remote Patient Monitoring systems is projected to grow to 70.6 million by the end of 2025, which raises the stakes for timely and trustworthy live health data, according to HealthArc's remote patient monitoring statistics. In that setting, false positives waste clinical attention, and missed alerts can be worse.
That same design logic applies outside healthcare. An SLA should answer three questions:
What business process depends on this dataset?
When does the data need to be correct and available?
Who owns the response when it isn't?
Don't define SLAs around what is easy to measure. Define them around the latest point at which bad data becomes expensive.
A good alert includes the affected dataset, what changed, when it started, expected versus actual behavior, likely downstream impact, and who should respond first. It should also suppress duplicates and group related failures. Nobody needs ten alerts for one root cause.
Integrating Monitoring Into Your Data Pipelines
If monitoring lives in a separate dashboard that nobody checks, it's not integrated. It's decoration. Real time data monitoring becomes operational when it sits inside the path data already travels.
Put checks where data changes state
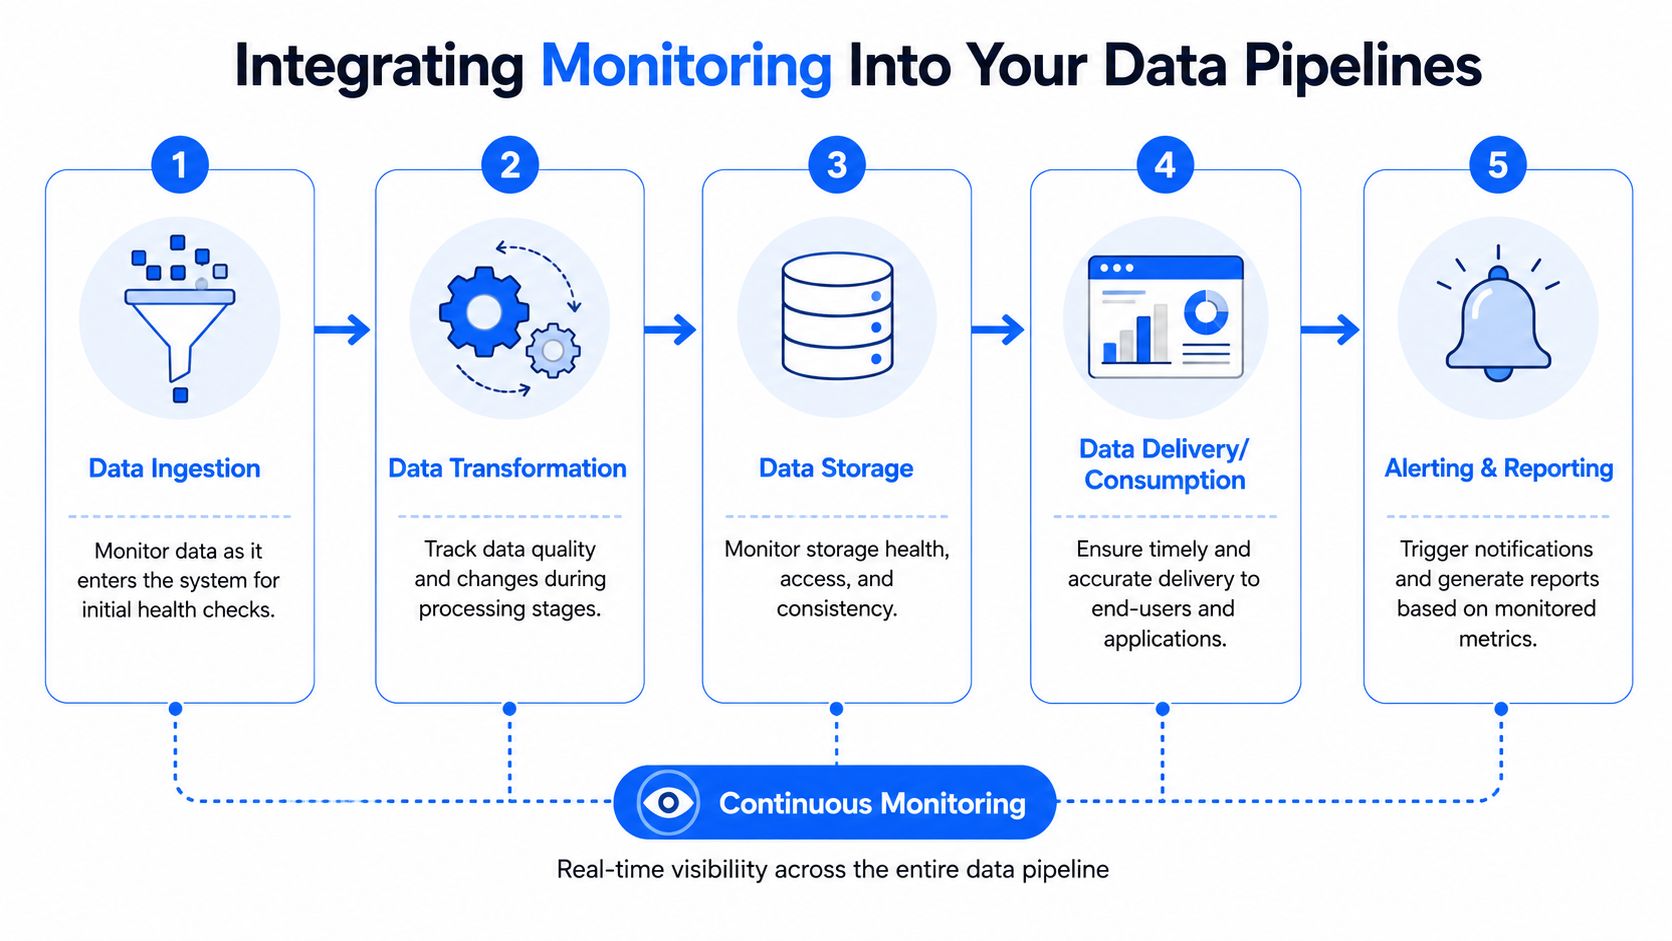
In a modern stack, there are four places where data changes meaning. Those are the places worth monitoring.
At ingestion you check arrival patterns, source continuity, duplicate bursts, and raw schema changes.
After transformation you validate business rules, null behavior, joins, referential assumptions, and abnormal aggregates.
At storage and serving layers you verify freshness, publish timing, and whether tables or views reflect the expected update cycle.
Before consumption you gate high-risk outputs feeding BI dashboards, APIs, reverse ETL jobs, or model features.
That layout matters because different incidents belong to different owners. A malformed raw event usually points upstream. A broken transformation belongs to the data team. A stale dashboard extract may sit with BI or serving infrastructure. Good monitoring shortens the handoff.
Make monitoring part of orchestration
The cleanest pattern is to make monitoring executable, not observational. Airflow, Dagster, dbt Cloud, or other orchestrators should trigger checks as part of the run, not after someone remembers to inspect a console.
A practical pattern looks like this:
Ingest data and record arrival metadata.
Run structural checks before transformation continues.
Execute transformation jobs with embedded quality assertions.
Calculate monitoring metrics inside the warehouse or lake.
Block, warn, or publish based on severity and downstream risk.
This creates a control point before bad data reaches reporting layers. It also improves incident handling because the failed stage is already known.
What doesn't work is relying entirely on generic system telemetry. CPU, memory, pod status, and task runtime can tell you whether infrastructure is under stress. They can't tell you whether a late source file made your executive dashboard stale or whether a field type change broke a model feature without notice. The monitoring signal has to travel with the data lifecycle itself.
How to Choose Your Real Time Monitoring Solution
A pipeline can be green across every infrastructure dashboard and still ship bad data for hours. That is the selection problem. Many monitoring tools are strong at telling you whether jobs ran, containers stayed up, or queries finished. Fewer can tell you whether the data arrived late, changed shape, or drifted far enough from normal behavior to break a downstream decision.

Questions that separate claims from capability
Start with the failure modes you need to catch. If your main risk is late-arriving events, detection latency and freshness checks matter more than a polished anomaly chart. If your team supports customer-facing models or operational APIs, schema drift and distribution change usually deserve the first budget and engineering attention.
Evaluation area | What to ask |
|---|---|
Real-time behavior | What detection and alerting latency can it sustain in our environment during normal load and incident conditions? |
Coverage | Does it monitor freshness, data quality, schema change, and distribution drift, or mainly system telemetry? |
Integration | Does it fit our warehouse, lake, streaming layer, orchestrator, and alerting stack without heavy custom engineering? |
Actionability | Can it route alerts by dataset owner, dependency, and business priority? |
Security | Where are metrics computed, what data leaves our environment, and what access model does the tool require? |
Operability | Can the data team run it as part of normal pipeline ownership, or will it become another platform to maintain? |
Ask every vendor to demonstrate detection on a real failure, not a slide. I usually want to see three tests: a delayed feed, a column type change, and a realistic quality issue such as null spikes or duplicate records. Those cases expose the gap between system monitoring and data monitoring faster than any feature checklist.
Latency claims need context. As noted by Symestic on real-time data monitoring in manufacturing, some environments measure success in milliseconds because the monitored process demands it. Analytics teams often work with looser windows, but the same rule applies. Define the maximum delay your business can tolerate for each critical dataset, then verify the tool against that target under production-like conditions.
Privacy-safe deployment should shape the decision
Architecture matters as much as feature coverage. A tool that detects drift accurately but requires broad data export to a vendor environment may create approval delays, extra controls, and a second data movement path your team now has to secure and maintain.
The stronger pattern is to run monitoring where the data already lives. Metric computation, rule evaluation, and baseline learning happen in the warehouse, lakehouse, or private runtime. That reduces exposure, keeps sensitive records in place, and usually makes governance reviews easier because the monitoring layer is not copying production data into yet another SaaS store.
This trade-off gets overlooked in many buying guides. They compare dashboards, alert channels, and anomaly models, but skip the operational cost of moving data out just to observe it. For regulated teams, or any team trying to reduce blast radius, in-database monitoring is often the cleaner design.
digna is one example of this approach. It covers anomaly detection, timeliness checks, schema tracking, and record-level validation while executing analysis inside customer-controlled environments rather than exporting production data.
Build versus buy follows the same logic. Building gives full control, but it also means owning metric definitions, drift logic, alert routing, historical storage, triage workflows, and access controls. Buying only helps if the product removes that engineering burden while still fitting your security model and your data architecture.
Best Practices for Scaling and Governance
The technical rollout is the easy part compared with keeping monitoring useful after the first wave of setup. Teams lose momentum when ownership is vague, alerts pile up, and nobody closes the loop with upstream producers.
Operational habits that keep monitoring useful
A few habits make a disproportionate difference:
Assign data owners clearly. Every critical dataset needs a named owner for quality decisions and an escalation path for incidents.
Separate severity from noise. Not every anomaly deserves a page. Tie severity to business impact and downstream blast radius.
Review recurring incidents. If the same alert fires repeatedly, fix the source or adjust the control. Don't normalize the pain.
Version your expectations. Schemas, schedules, and business rules change. Governance needs a change process, not tribal knowledge.
Keep evidence close to the data. Metric history, validation results, and incident context should be easy to inspect where engineers already work.
The broader goal is cultural. Monitoring should move the team from reactive debugging to managed reliability. That only happens when controls are embedded in the pipeline, owners know what they're accountable for, and the organization treats data quality as an operational discipline rather than a cleanup task.
Real time data monitoring works when it closes the gap between system health and data truth. That's the standard worth building toward.
If your team wants real time data monitoring that covers timeliness, anomalies, schema changes, and record-level validation without exporting production data, digna is worth evaluating. It runs analysis inside customer-controlled environments, which fits teams that need modern observability with a privacy-safe architecture.


