Data Quality Platform Essentials for Enterprise Data Stacks
|
6
min read

Your board deck looks fine until the finance dashboard opens and half the numbers don't match the warehouse. BI starts chasing a phantom schema change, data engineers dig through late loads, and leadership asks why yesterday's “trusted” report now looks unreliable. That's the moment a data quality platform stops being a nice-to-have and becomes part of the operating model, because broken data doesn't stay in one place, it spreads into reports, models, and decisions.
A good platform gives teams a way to notice problems early, prove what changed, and keep the mess from travelling downstream. In Europe, that pressure is growing on both the public and private side, from metadata controls in open data to private-cloud requirements in regulated sectors. If you've ever had to explain why a dashboard changed overnight, you already know why this matters. For a compact starting point, see what counts as data quality in practice.
Introduction to Data Quality Platform
The easiest way to understand a data quality platform is to think about a production line with inspection points. Raw material comes in, checks happen at each stage, and anything bent, missing, or out of spec gets flagged before it leaves the factory. Data pipelines work the same way, except the “product” is a report, a model input, or a regulated submission.
When the pipeline is healthy, teams move quickly because they trust what they see. When it's not, every consumer becomes a detective. Finance questions the ledger, analysts question the dashboard, and engineers question the ingestion job, even when the underlying issue is a late file, a renamed field, or a duplicated record.
That's why the category now sits between data engineering, governance, observability, and analytics. It's not just about catching bad values. It's about preserving confidence in the chain from source system to warehouse to BI layer, so the business can act without second-guessing every chart.
Practical rule: if a broken table can reach a board report before anyone notices, your monitoring is too shallow.
A strong platform gives you a repeatable way to detect, explain, and act on quality issues. It should help you keep data moving, keep users informed, and keep audit trails intact when something changes. For the underlying concept in more depth, the internal overview on data quality dimensions helps connect the idea of quality to the signals you can measure.
Understanding Key Concepts
A useful mental model starts with three layers. First, the platform watches the data itself. Second, it watches the shape of the data, meaning fields, types, headers, and metadata. Third, it watches behaviour over time, such as whether a feed arrived when it should and whether a metric drifted away from its usual pattern.
Metadata is the label on the box
If the label is wrong, even perfect contents can create confusion. That is why metadata hygiene matters so much in public data and enterprise catalogues. The European Union has been improving open-data metadata quality through the MQA tool, a structured dashboard introduced by data.europa.eu to assess DCAT-AP compliance, machine readability, and licensing clarity across national and regional data portals.
That matters because people often treat metadata as admin work, then wonder why downstream users cannot discover, trust, or reuse the dataset. In practice, metadata quality is the first gatekeeper for discoverability and governance. If the portal cannot describe the asset cleanly, the rest of the pipeline starts with weak footing.
Quality is more than correctness
Engineers sometimes reduce quality to valid versus invalid rows, but that misses the operational picture. A row can be technically valid and still arrive too late, duplicate yesterday's feed, or break a dashboard by shifting schema unexpectedly. A platform has to watch for all of those conditions, not just malformed values.
That is why observability belongs in the definition. A system that only checks one rule set is like a factory inspector who measures bolt size but ignores whether the parts arrived on time or whether the blueprint changed. Good quality tooling combines static validation with trend awareness and delivery checks, so teams can see both hard failures and subtle drift.
The most useful platforms also help users trace cause and effect. They do not just say “something changed”. They show whether the change is new, recurring, or part of a longer trend, which is what turns noisy alerts into decision support. For a related explanation of how teams measure quality across dimensions, see the platform view of data quality dimensions.
Exploring Key Capabilities
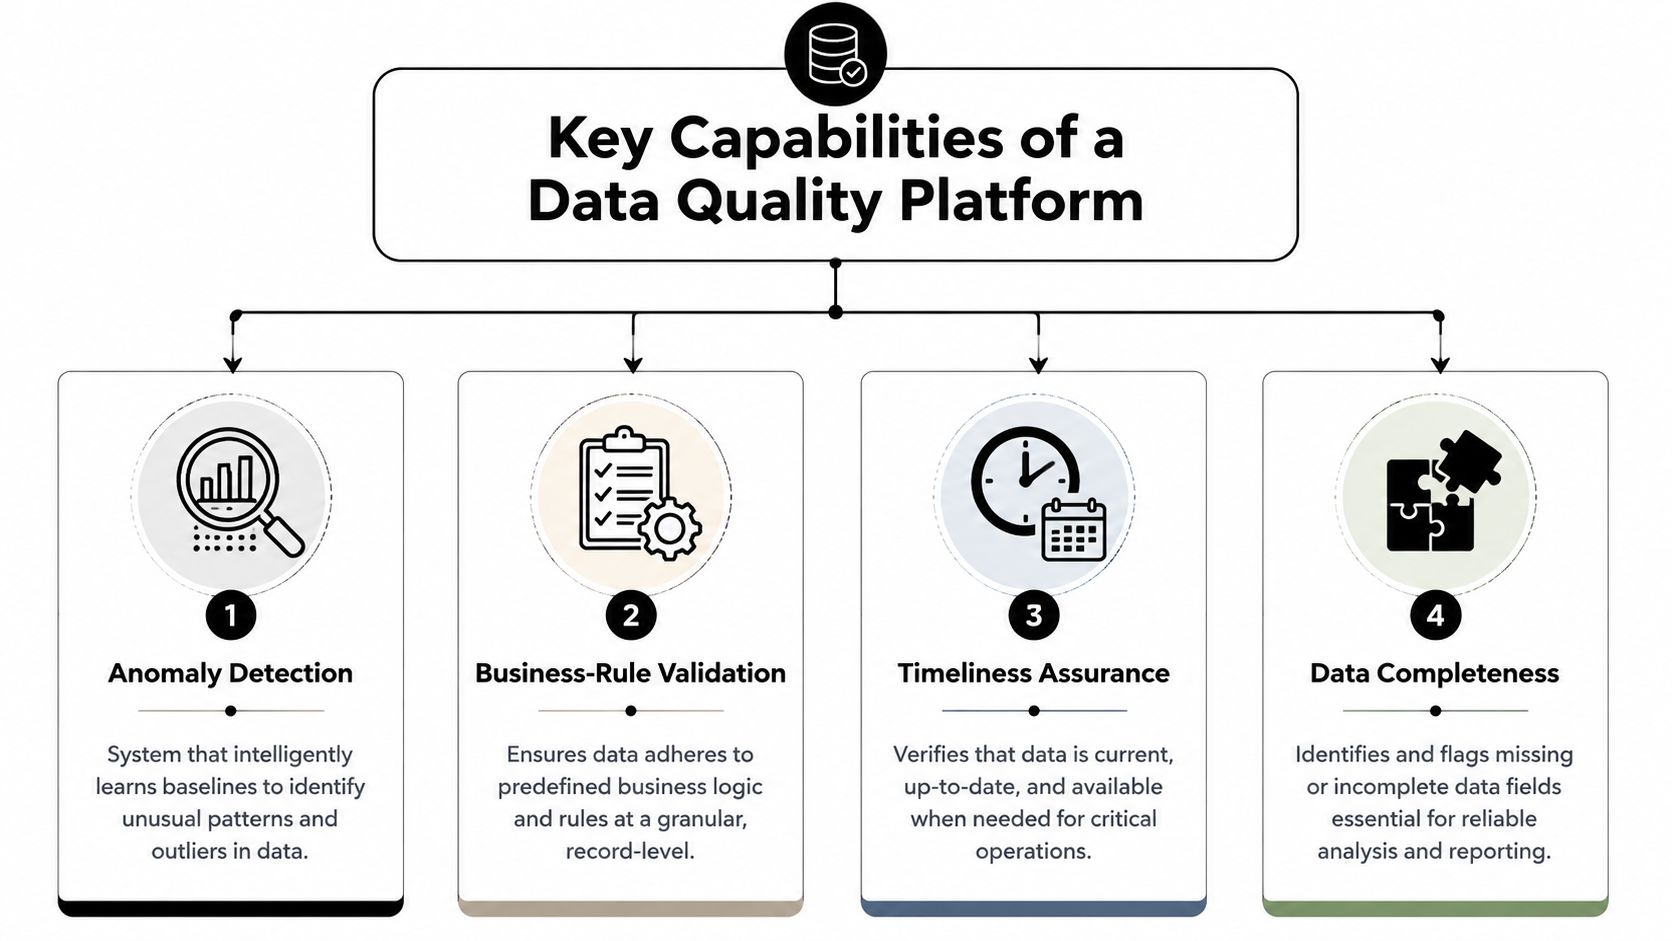
A serious platform usually earns its place through four capabilities, and each one solves a different failure mode. If you mix them up, you end up with gaps that look small in a demo and expensive in production.
Anomaly detection that learns normal behaviour
The strongest anomaly tools don't depend on rigid thresholds alone. According to digna's technical explanation, Data Anomalies automatically learns the behavioural baseline of each monitored dataset and flags deviations as they appear. That matters when your data is seasonal, bursty, or shaped by business cycles that would make static rules noisy.
digna also says its Data Anomalies module detects unexpected changes in data quality and business or operational KPIs without manual thresholds or rules, and it calculates and monitors metrics such as Sum, Min, and value counts across every column and three types of data. In plain terms, that means the platform isn't waiting for you to tell it exactly what “bad” looks like every time.
Business-rule validation at record level
The platform allows teams to move from broad monitoring to concrete enforcement. If a customer record must include a region code, or an invoice must match a policy condition before it reaches finance, the platform needs to check that rule row by row. That's how regulated teams keep logic consistent across domains without relying on manual review.
Timeliness and delivery-schedule monitoring
Late data can be just as damaging as wrong data. A feed that arrives after the report deadline creates a false sense of completeness, and the dashboard still looks “clean” even though it's out of date. The right platform watches arrival patterns and schedule adherence so users know whether the pipeline is current.
Schema-drift tracking and completeness signals
Schema drift shows up when fields are added, removed, or reshaped in ways that break downstream systems. Completeness, meanwhile, catches missing pieces that make analysis unreliable even when the table still loads. The best monitoring surfaces both, because BI developers and ML engineers need different warnings from the same pipeline.
According to digna's platform overview, the system automatically calculates data metrics in-database, learns baselines, analyzes trends, monitors arrival schedules, calculates expected delivery time, and flags schema drift from a single UI, while keeping analysis inside the customer's database. For a closer look at monitoring workflows, see digna's monitoring tools overview.
Alert fatigue usually means the platform is checking symptoms, not patterns. If the same team ignores every message, the problem is probably the design of the checks, not the people receiving them.
Comparing Architecture Patterns
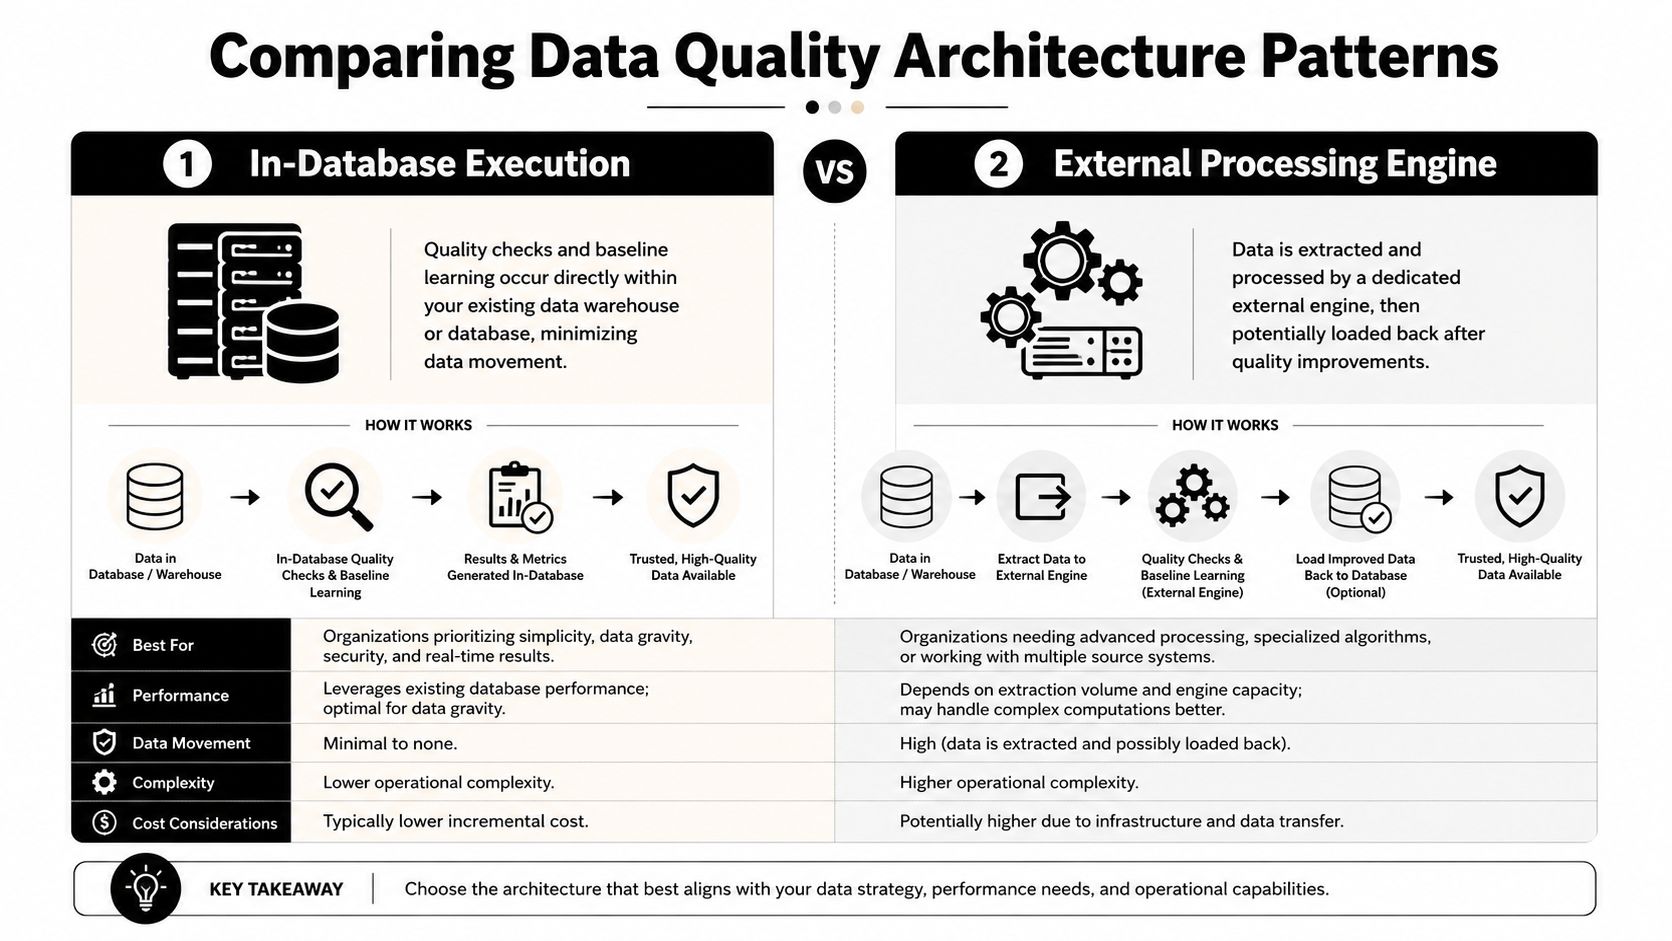
Architecture changes everything. Two platforms can promise similar checks, then behave very differently once they meet real data volumes, security controls, and operational constraints.
In-database execution
In this model, checks and baseline learning happen where the data already lives. That lowers movement, reduces duplicated copies, and keeps analysis inside the customer environment. It also makes a lot of sense when teams care about residency, performance isolation, and tighter control over who can see production data.
digna's platform overview says its analysis stays inside the customer's database and that it is designed for enterprise data warehouses, lakes, and pipelines. It also states that the system calculates metrics in-database, which is exactly the kind of design that appeals to teams trying to avoid unnecessary extraction. For an architectural deep dive, the page on in-database data quality platforms is worth a look.
External processing engines
An external engine pulls data out, processes it elsewhere, then often sends results back. That can work well in some stacks, especially when the surrounding ecosystem already expects separate compute layers. The trade-off is obvious, though, because data movement introduces more places for access control, latency, and vendor interaction to become sticking points.
How to think about the trade-off
If your organisation values maximum isolation, fewer copies, and tighter control, in-database execution is usually easier to defend. If your team prefers a separate processing tier and doesn't mind the extra movement, an external engine can still fit, but it needs more scrutiny around privacy and operations.
European buyers often care about that distinction for a reason. The market conversation around data quality tools still leans heavily toward SaaS workflows, while a Gartner reviews overview of augmented data quality solutions highlights the persistent need for private-cloud and on-premise deployment in regulated settings. The architectural question is not abstract. It affects who can touch the data, where processing happens, and how much proof you can give auditors.
Choosing the Right Platform

Selection works best when you separate the “nice demo” from the “will survive audit week” question. A platform might show slick dashboards, but the true test is whether it fits your operating constraints, especially in Europe where privacy, residency, and governance often matter as much as feature count.
Start with the checks that match your risk
If your biggest pain is broken feeds, prioritise timeliness and delivery monitoring. If your finance or reporting teams need proof that rows still match after transformations, prioritise reconciliation and record-level validation. That gap matters because, as noted in the earlier section, many tools talk about anomaly detection and schema drift but don't answer the row-level proof question across source, warehouse, and BI layers.
Then test the architecture against your policy
A second underserved angle is privacy-preserving deployment in controlled environments. Buyers in ES often ask whether a platform can run in private cloud or on-premises without vendor access, especially in regulated sectors, but most public content about data quality platforms still centres on SaaS-style workflows and generic alerting. If your security team wants no-data-exfiltration or strict residency controls, that criterion needs to sit at the top of the shortlist, not buried in a footer.
Use a practical vendor checklist
In-Database Execution: confirm the platform can run checks where your data lives, because that reduces unnecessary movement.
Scalability and Performance: ask how it behaves when pipelines grow or many checks run at once.
Integration Capabilities: verify that it fits your warehouse, lake, BI, and orchestration stack without awkward workarounds.
User Experience: make sure data stewards and engineers can both use it without constant hand-holding.
Cost-Effectiveness: compare the full operating burden, not just licence fees.
Vendor Support and Community: check documentation quality, response times, and whether you'll be left solving edge cases alone.
digna's documentation says the platform runs fully on-premises or in private cloud, requires no rule writing, and continuously monitors delivery quality with AI-based detection of silent data errors such as missing, duplicated, or corrupted records. That makes it one candidate for teams that want controlled deployment and operational monitoring in the same system, though it should still be evaluated alongside other options in the same category. For a broader comparison lens, this platform comparison overview can help structure vendor conversations.
Real World Examples

A mid-sized European bank preparing for a regulatory audit often discovers that its core banking system and wealth management platform do not describe the same customer relationship in the same way. One system may show an account as active while another still carries an outdated closure status, or the balances may reconcile at a report level but not at the individual record level. A data quality platform with reconciliation checks lets the team compare those records across silos before the mismatch reaches audit packs, where even a small inconsistency can trigger questions from compliance reviewers and slow down sign-off. The useful part is not only that the numbers look right, but that the underlying rows can be traced from source to report without silent drift.
A telecom operator usually runs into a different pattern. Customer usage events may flow from network switches into a billing store, then into a customer analytics warehouse, and one delayed batch can make a healthy day look like a broken one. If the platform sees a sudden drop in call-detail records or a spike in duplicated usage rows, the team can separate a late arrival from a true processing fault and respond before billing disputes start to build. That kind of monitoring works best when timeliness checks and anomaly detection are read together, like two lights on the same control panel rather than separate alarms.
A public-sector agency often cares about control boundaries more than speed. It may need to validate citizen records, schema changes, and missing fields while keeping production data inside its own environment, especially where privacy rules and internal approvals limit how far records can travel. In that setting, in-database execution is attractive because the checks run next to the data instead of copying sensitive rows into a separate vendor-controlled process. For European enterprises, that deployment style matters when the goal is to meet control requirements without giving up practical monitoring on the live dataset.
The strongest implementation stories usually combine record-level reconciliation, control over where processing happens, and a clear view of who has to defend the result. That combination matters more than any single feature on a product sheet.
Conclusion and Next Steps
A data quality platform is really a trust layer. It protects pipelines from silent failures, helps teams prove what changed, and gives business users a reason to believe the dashboard in front of them. The core choices are straightforward once you separate them: anomaly detection versus rule validation, timeliness versus schema drift, and in-database execution versus external processing.
The next move is to test the platform against real conditions, not slideware. Use one broken feed, one critical report, and one regulated dataset, then check whether the platform can detect the issue, explain it clearly, and keep the data inside the environment your security team expects. If it can't do that, it's not ready for the centre of your stack.
A solid pilot also forces alignment between engineers, governance, and business stakeholders. They need to agree on what “quality” means, who gets alerted, and what proof is required before a metric is trusted again. Once that's defined, the platform stops being another tool and becomes part of how your organisation keeps its promises to customers, auditors, and decision-makers.
Book a demo to see how digna consolidates data quality monitoring, validation, and observability in one platform, reducing tool sprawl while improving coverage and effectiveness.


