Data Quality Machine Learning: Build Robust ML Systems
|
6
min read

Your model looked fine last month. The validation curves were clean, the demo impressed stakeholders, and the pipeline passed every unit test your team had. Then production started behaving like a badly haunted house. Recommendations drifted into nonsense. Fraud scores became oddly flat. A dashboard that usually updates before the morning stand-up started showing yesterday's truth with today's timestamp.
That kind of failure rarely starts with the model itself. It starts with data arriving late, arriving malformed, or arriving with just enough silent damage to avoid a hard crash. The worst incidents aren't loud. They're subtle enough to survive the first round of checks and expensive enough to poison trust before anyone spots the pattern.
Data quality for machine learning stops being a preprocessing chore and becomes an operational discipline. Training-time cleaning helps, but production ML lives or dies on what happens after deployment, inside the pipelines, tables, feature views, and schedules that keep the model fed. For teams working in regulated European environments, that challenge gets sharper. You need stronger monitoring, tighter governance, and often less freedom to move data around just to inspect it.
The Ghost in the Machine Learning Model
A common incident goes like this. A ranking model starts underperforming on live traffic, but nothing obvious is broken. No failed jobs. No missing table. No alert from the serving layer. The team opens notebooks, compares recent predictions, checks feature importance, and starts blaming retraining cadence.
Hours later, someone notices one upstream source changed how it populates a single field. Not enough to trigger a schema failure. Just enough to shift the meaning of a feature that the model treated as stable. The pipeline kept running. The model kept scoring. Business users kept losing confidence.
That's the ghost in production ML. It isn't dramatic corruption. It's quiet degradation.
I've seen teams treat this as a model problem when it's really an observability problem. They retrain too early, tweak thresholds too often, and add ad hoc checks that calm nerves for a week and create maintenance debt for a year. The model becomes the suspect because it's visible. The input damage stays hidden because the data layer isn't instrumented well enough.
Broken models often come from healthy code reading unhealthy data.
This shows up across domains. In credit risk, one stale load can make a fresh prediction look statistically plausible but operationally useless. In healthcare analytics, late updates can leave a model working from an incomplete patient state. In property and underwriting workflows, the same issue appears when feature inputs change shape or freshness without anyone noticing. If you're comparing tooling in that world, PropLab's guide to AI tools is useful because it exposes how quickly AI systems become operational software, not just experiments.
Why one-off cleaning fails
A lot of teams still behave as if data quality ends when training begins. Clean the historical set. Fix nulls. Remove duplicates. Ship the model. That logic belongs in a lab, not a platform.
Production systems need something closer to an immune system:
Continuous sensing: Watch inputs after deployment, not just before training.
Behaviour awareness: Know what “normal” arrival, volume, and distribution look like.
Fast isolation: Distinguish model issues from upstream data issues quickly.
Operational ownership: Route data incidents to the people who can fix them.
When those pieces are missing, model decay looks mysterious. When they're present, most “AI failures” become ordinary engineering work.
The Four Horsemen of Model Decay
A model doesn't usually fail for one grand reason. It weakens through a handful of repeat offenders. Learn their signatures and you'll diagnose issues faster than teams who stare only at model metrics.
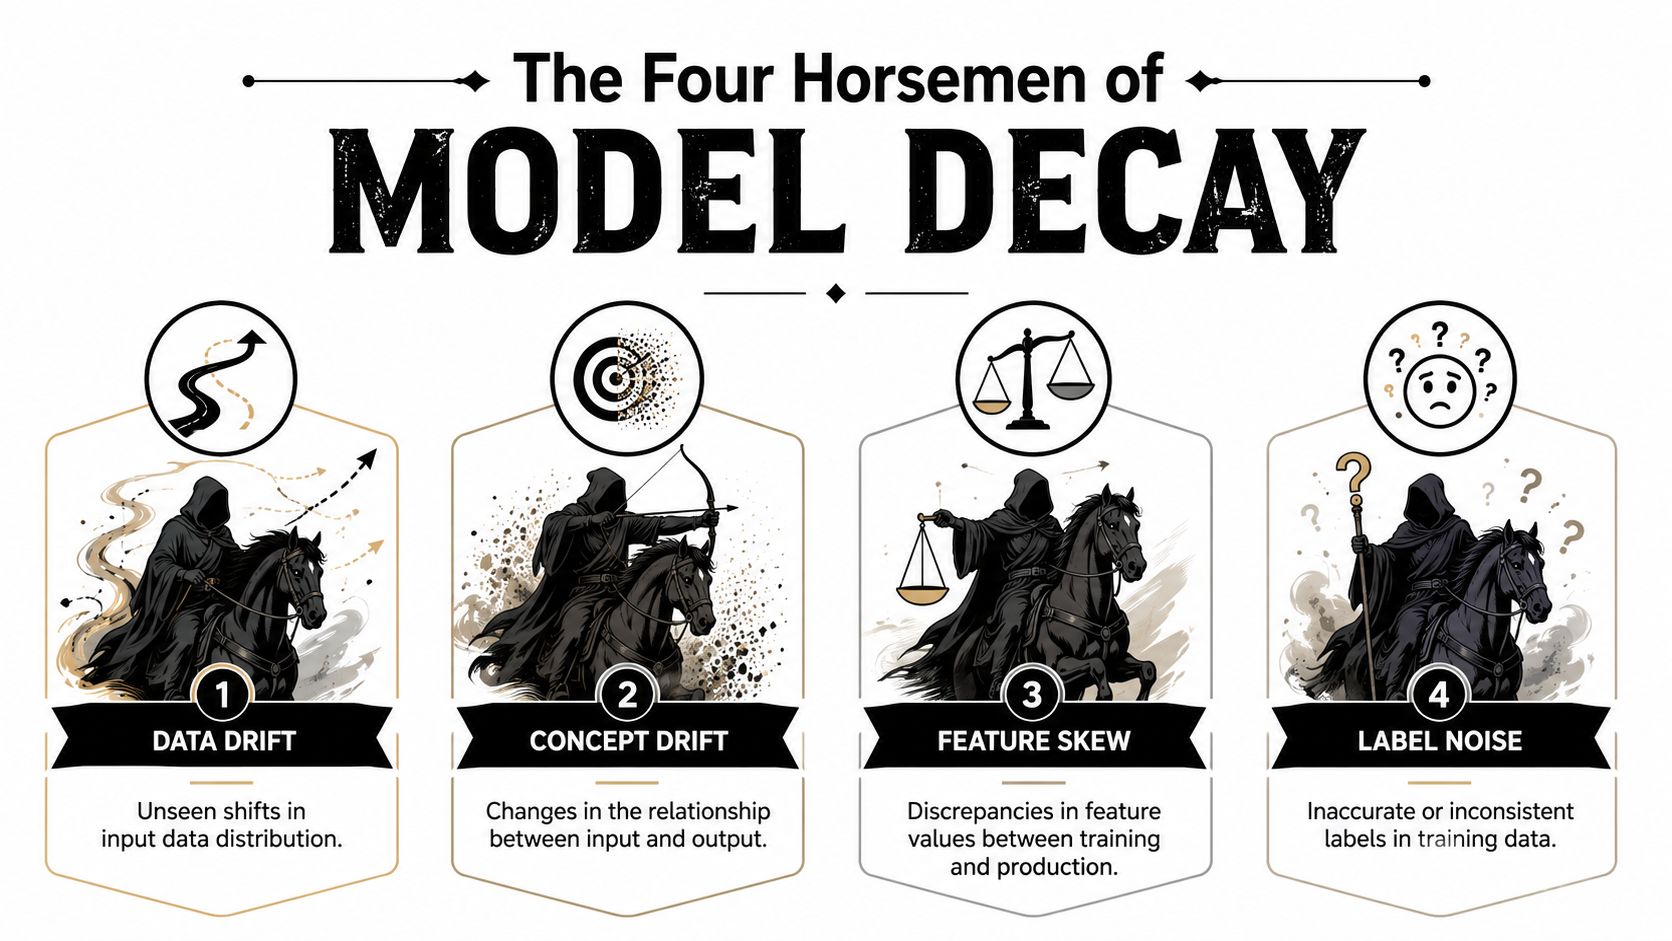
Data drift and concept drift
Data drift is the river changing course while your model still uses last year's map. The distribution of inputs shifts over time. Maybe customer behaviour changed, maybe a collection method changed, maybe a source system now rounds values differently. The model still receives data of the right shape, but the statistical ground underneath it has moved.
Concept drift is nastier. The relationship between inputs and outcomes changes. The model may see familiar-looking features, yet the world those features describe now behaves differently. A fraud signal that once mattered may fade. A demand feature may reverse direction after a policy change.
The practical mistake is treating both as retraining problems only. Sometimes retraining helps. Sometimes it just teaches the model to adapt to broken upstream logic faster.
If your team is working through practical monitoring patterns, data drift detection should sit next to model monitoring, not beneath it.
Missingness and feature skew
Missing values deserve more respect than they usually get. In the European Union, 43% of machine learning practitioners report missing critical values as their predominant data quality challenge, which directly undermines reliability and pushes teams towards imputation or supplementary collection, according to EU practitioner survey findings on missing critical values.
That matters because missingness is rarely random in production. A batch may arrive partially complete because one source lags. A specific region may drop out because of a connector issue. A field may start defaulting to blank after a form update. If you only count NULLs globally, you'll miss the underlying problem.
Feature skew is another quiet saboteur. Training values and production values diverge, even when the schema still matches. The model learned on one distribution and now scores another. That's how a valid feature becomes a misleading one.
Label noise and schema changes
Label noise poisons training slowly. If your ground truth is inconsistent, late, manually corrected in some systems but not others, or joined incorrectly, the model learns the wrong lesson with great confidence. This one often hides behind “the model never generalised well” when the actual issue is that the labels never represented reality consistently.
Schema changes are the digital version of swapping the blueprint mid-build. Added columns are manageable. Removed columns and type changes are less forgiving. Renamed values, changed encodings, and silent coercions are worse because the pipeline may continue running while semantics break.
A simple rule helps:
Practical rule: If a change can alter the meaning, timing, or completeness of a feature, treat it like a production incident even if no job failed.
Teams that catch these four early stay calm. Teams that don't spend their week re-litigating whether the model is “still good”.
Measuring Your Data's Fitness for ML
You can't productionise data quality machine learning with a handful of NULL checks and a dashboard full of row counts. ML-ready data needs a wider definition of fitness, and European standards give that definition real shape.
A 2025 study by Gómez Plaza et al. describes inherent data quality properties for machine learning as accuracy, completeness, consistency, credibility, and currentness, and notes that organisations must explicitly document measures for detecting and mitigating missing data, duplication, outliers, bias, and drift in regulated contexts, as detailed in this analysis of European ML data cleaning standards. The same work states that the European standard requires precise quality measures for detection and mitigation of missing data, data duplication, and bias, drift and scaling, which makes data quality part of audit readiness, not just engineering hygiene.
Measure more than freshness and volume
Organizations often start with freshness, volume, and schema validity. That's a decent start, but it's not enough for ML inputs.
A stronger metric set includes:
Distribution stability: Track whether numeric and categorical features still resemble their learned baseline.
Completeness by slice: Check missingness by customer segment, source, geography, or channel, not only across the full table.
Cardinality shifts: Watch for exploding or collapsing unique values in IDs, categories, and free-text derived features.
Currentness: Verify that records aren't merely present, but recent enough to represent the process the model is trying to predict.
Credibility checks: Flag impossible combinations, suspicious defaults, or feature values that are technically valid but operationally absurd.
For teams choosing metrics and implementation patterns, data quality metrics for production systems is a sensible place to compare what should be measured automatically versus enforced as explicit rules.
Turn quality dimensions into executable tests
The jump from policy to practice happens when each quality dimension becomes a machine-enforced test. That means every important table, feature set, or feed gets a measurable contract.
A practical setup looks like this:
Quality dimension | What to test in practice | Typical failure signal |
|---|---|---|
Accuracy | Cross-field validity and reference conformity | Values pass type checks but violate business logic |
Completeness | NULLs, blanks, partial records, missing partitions | Sudden gaps in critical features |
Consistency | Stable formats, units, and categorical encodings | Same concept represented differently across sources |
Credibility | Plausibility ranges and domain constraints | Data is present but not believable |
Currentness | Arrival timing and recency of records | Stale features feeding a live model |
The useful shift here is mental. Don't ask, “Is this table clean?” Ask, “Is this input fit for the model decision it supports?” A feature can be acceptable for BI and still be unacceptable for ML.
Data quality for machine learning is about preserving meaning, not just preventing crashes.
Automated Anomaly Detection Techniques
Manual thresholds work for a while. Then the estate grows. One table becomes fifty. Fifty becomes five hundred. Someone creates a new market-specific pipeline. Another team adds a feature store. Your lovingly maintained list of hard-coded checks turns into a museum of assumptions.
That's where statistical monitoring and machine learning need to work together.
Why static rules break first
Rule-based monitoring is useful when the failure mode is known and stable. “This column must not be NULL.” “This record must satisfy a business constraint.” “This field must remain one of these accepted values.” Those are excellent validation checks.
They're weak at spotting emergent behaviour. If row volume gradually changes over weeks, a fixed threshold may stay silent until it's too late. If a category starts drifting in proportion but not in absolute count, simple limits won't catch it. If data starts arriving later in a pattern that varies by weekday, brittle rules create either alert fatigue or blind spots.
What adaptive detection adds
Adaptive anomaly detection learns baseline behaviour from the data itself. Instead of forcing an engineer to predict every failure mode in advance, the system models what normal looks like and flags deviations worth inspection. That includes spikes, drops, trend breaks, unusual correlations, and timing changes.
This is especially relevant for large estates with mixed workloads. A retail feature feed, a finance scoring input, and a public-sector reporting table won't behave the same way. They shouldn't share the same static thresholds either.
A 2026 research paper proposes an unsupervised machine learning framework for structural anomaly detection in European regional statistics, showing that AI can identify structurally atypical profiles without manual rule maintenance and describing the method as “fully reproducible, scalable, and compatible with existing validation workflows” in the paper on structural anomaly detection for European statistics. That's the important pattern. Automation becomes useful when it scales without becoming opaque.
One practical option in this category is AI anomaly detection techniques for data operations. Systems built this way learn normal behaviour directly on configured data assets, then detect unexpected changes without requiring teams to handcraft every alert condition.
Use both rules and learned baselines
The mature setup isn't rules versus AI. It's both.
Use record-level validation when the business knows exactly what must hold true. Use baseline learning when the system needs to detect deviations in behaviour, structure, or timing that nobody can enumerate in advance.
A durable split looks like this:
Use explicit rules for contractual fields, compliance logic, and domain constraints.
Use learned baselines for drift, freshness changes, volume anomalies, and unusual feature behaviour.
Use analyst review for ambiguous anomalies where context decides severity.
The fastest way to drown a monitoring programme is to make humans maintain every threshold by hand.
Good anomaly detection doesn't replace engineering judgement. It preserves it for the cases that deserve a person's attention.
Designing a Full-Stack Data Observability Pipeline
Detection alone doesn't save production. Lots of teams can detect. Fewer can route, explain, and resolve without a Slack fire drill involving six people and three guesses.
A reliable pipeline behaves more like a factory line than a security camera. It checks inputs as they enter, tracks how they move, alerts the right owner with context, and feeds lessons from each incident back into the system.
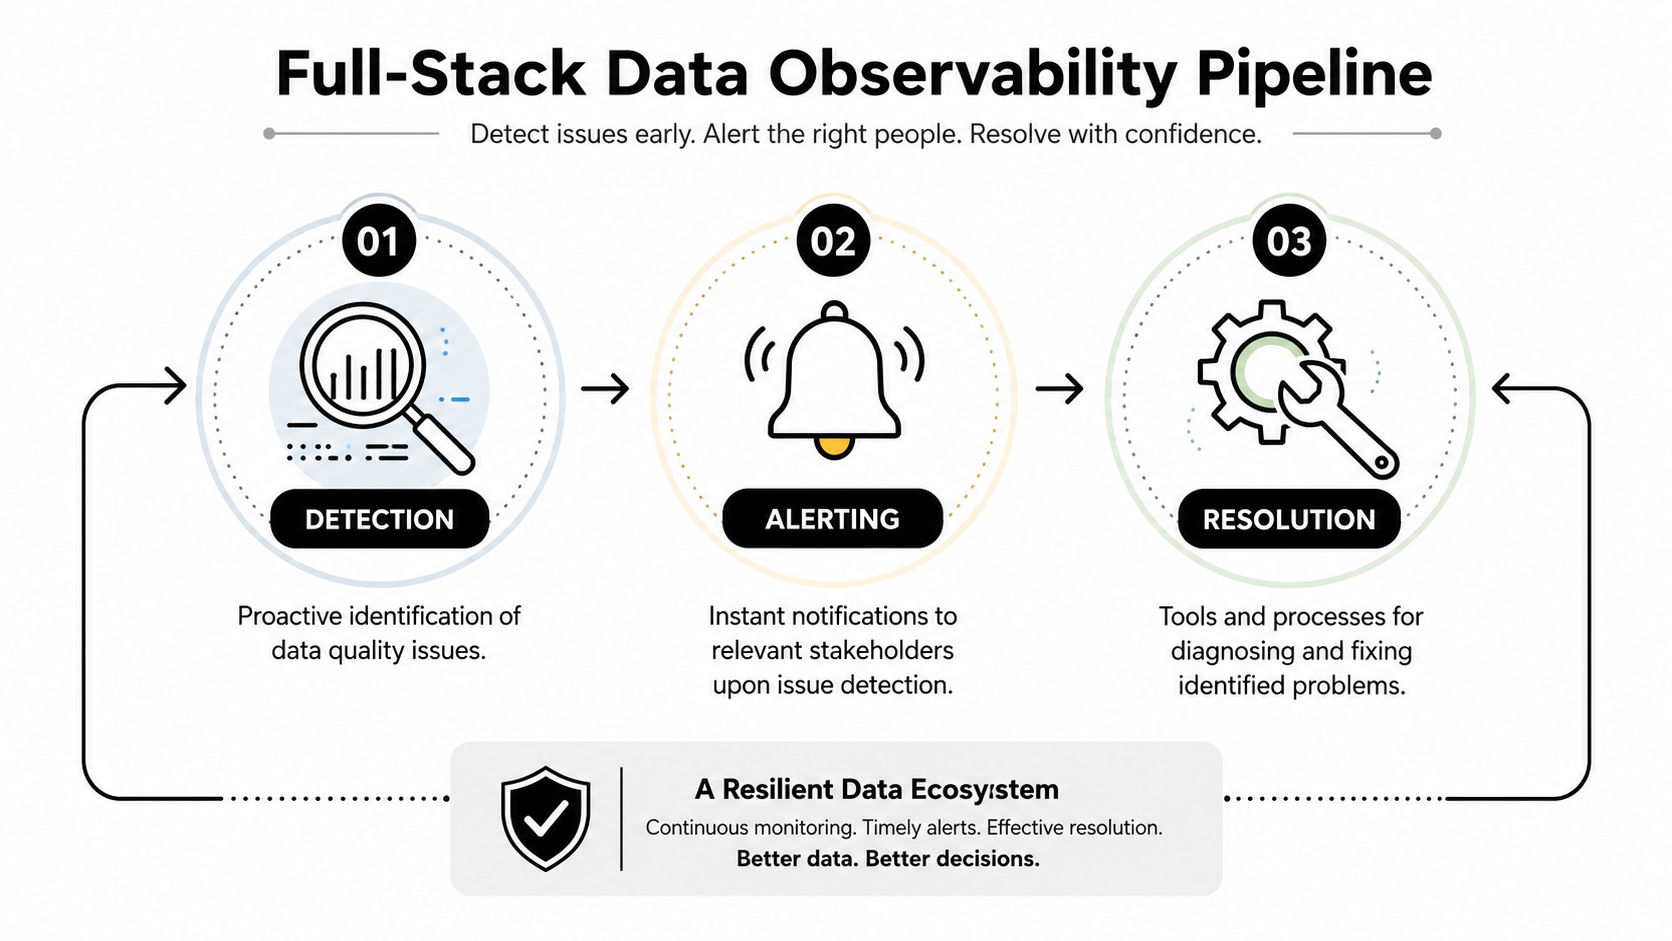
Detection needs context
An alert that says “anomaly detected” is a nuisance, not an operational tool. The detection layer has to answer basic questions immediately:
What changed
Where it changed
When it started
Which downstream assets depend on it
Whether this is a one-off spike or a trend break
That's why lineage and history matter. If a dashboard fails, the team should be able to trace the issue backwards to a source table, a field, or a delayed load. If a model score distribution changes, engineers need to tell whether the root cause sits in ingestion, transformation, feature generation, or serving.
Timeliness is not a cosmetic metric
Late data doesn't just make reports look stale. It changes model behaviour. Most content treats timeliness as a pipeline KPI. That's too shallow for live ML.
Data from the FRA explicitly links under-representation and missing time frames to bias, and recent European discussions have highlighted that most tools still focus on static cleaning rather than dynamic expected-arrival calculations, as summarised in the CEN and CENELEC workshop report on timeliness and bias in AI systems. If one source regularly lands later than the model expects, you don't just get delayed scoring. You can get skewed scoring on incomplete reality.
That's why expected delivery time matters. Learn normal arrival patterns. Compare actual arrival against those patterns. Alert before a stale feature leaks into a decision.
Resolution has to be designed, not improvised
A full-stack observability loop usually includes these components:
Validation gates that stop obviously bad data from moving forward.
Anomaly monitors that spot behavioural changes in live tables and feeds.
Schema tracking that captures structural change before it creates semantic damage.
Context-rich alerting routed to the owning team.
Lineage-assisted diagnosis so responders can trace downstream impact quickly.
Feedback capture so closed incidents improve baselines, rules, and runbooks.
Teams evaluating this operational layer should look at data observability tools for modern pipelines with one question in mind. Does the system help people resolve incidents faster, or does it create more alerts?
Alerting should reduce investigation time, not move it from SQL into email.
When this pipeline is in place, model reliability stops depending on heroics.
The In-Database Advantage for Secure ML
A lot of data quality advice assumes you can ship data out to inspect it. For many European teams, that assumption breaks on first contact with reality.
Finance, healthcare, telecom, and public sector environments often need stronger control over where data stays, who can access it, and how much movement is justified. In those settings, observability architecture becomes a governance decision as much as an engineering one.

A 2024 EU survey on ML practitioners highlights traceability and security as top governance concerns, while standard guidance often points teams towards cloud-based tools that move data, creating a gap for in-database metric computation that respects sovereignty, according to this discussion of governance concerns in ML data quality practice.
Why execution location matters
When monitoring runs outside the database, you introduce extra movement, extra permissions, extra failure points, and extra governance review. You also create a second copy of operational truth, which tends to age badly.
In-database execution changes the trade-off:
Sensitive data stays resident in the customer-controlled environment.
Metric computation happens where the data already lives, which simplifies security boundaries.
Latency drops because the system inspects data close to source.
Operational complexity shrinks because fewer export pipelines need maintenance.
This is particularly useful when you need to detect drift, schema changes, or timeliness issues in on-prem or private-cloud estates where external SaaS access is constrained.
What this looks like in practice
The in-database pattern works best when one platform can compute metrics, learn baselines, track schema, and support validation without pulling production data into a vendor environment. That's the architectural idea behind in-database data quality execution for secure environments. digna, for example, runs analyses inside customer databases, supports private-cloud or on-prem deployment, tracks timeliness and schema changes, and keeps production datasets under customer control.
That architecture isn't just about compliance paperwork. It also makes debugging cleaner. The same teams that own the warehouse or lake can inspect metrics, trace incidents, and validate fixes without introducing a parallel observability stack that sees only exported fragments.
If your ML platform has serious governance requirements, where you run data quality checks may matter as much as which checks you run.
Production Data Quality Checklist
The cleanest way to operationalise data quality machine learning is to make it boring. Define the checks, assign ownership, automate what repeats, and leave humans the judgement calls that need judgement.
Below is a working checklist I'd use to review any production ML setup. It maps practices to platform capabilities because “we should monitor this” isn't useful unless the stack can do it.
ML Data Quality Implementation Checklist
Practice / Check | Required Platform Capability | Why It Matters for ML |
|---|---|---|
Define critical input tables and feature dependencies | Asset inventory plus lineage visibility | You can't protect what nobody has mapped |
Establish data contracts for model inputs | Schema tracking and contract validation | Prevents silent changes in column presence, type, or meaning |
Monitor completeness on high-impact features | Column-level metrics and slice-aware checks | Missing values distort scoring and can bias outputs |
Validate record-level business rules | Rule engine for row validation | Stops technically valid but operationally wrong records |
Track data freshness and recency | Timeliness monitoring | Detects stale inputs before they degrade live predictions |
Learn expected arrival windows | Schedule learning and expected-delivery calculation | Catches late loads that standard freshness checks miss |
Watch distribution changes in features | Statistical baselining and anomaly detection | Surfaces drift before model metrics collapse |
Compare training and production feature behaviour | Feature skew monitoring | Reveals when deployed inputs no longer resemble training assumptions |
Detect structural anomalies automatically | Unsupervised anomaly detection | Scales monitoring across many tables without manual thresholds |
Alert the right team with impact context | Routing, ownership metadata, and incident context | Reduces time wasted on generic alerts |
Trace issues upstream and downstream | Data lineage and dependency mapping | Speeds root-cause analysis and impact assessment |
Review historical trends, not only incidents | Metric history and trend analytics | Helps separate one-off noise from gradual deterioration |
Keep checks inside governed environments where needed | In-database execution | Supports security, traceability, and sovereignty requirements |
Document controls for audit readiness | Test catalogues, validation logs, and rule history | Makes ML input governance defensible in regulated settings |
The checklist teams usually skip
The neglected items are usually the ones that hurt most later:
Expected arrival modelling: Teams know a feed is late only after users complain.
Semantic schema monitoring: They detect missing columns but not changed meaning.
Ownership routing: Alerts go to a shared channel and sit there like abandoned luggage.
Historical trend review: Everyone looks at yesterday. Nobody checks whether the last six weeks are drifting.
A good mental model comes from operational environments that can't afford stale data or missed changes. Teams working on procurement and opportunity pipelines face similar pressure around timeliness and structured feeds, which is why AI for Government Contracting is a useful adjacent example of how quickly workflow value depends on reliable, current inputs.
What works and what doesn't
What works:
A small set of high-value checks first
Shared ownership between data engineering and ML engineering
Separate handling for hard rule failures and soft anomalies
Timeliness treated as model input quality, not just pipeline hygiene
What doesn't:
One giant monitoring rollout with no ownership
Thresholds copied blindly across unlike datasets
Trusting dashboards without tracing upstream arrival patterns
Assuming retraining will fix data defects
The target state isn't perfection. It's fast detection, accurate diagnosis, and fewer surprises in production.
If your team needs to monitor drift, schema changes, record validity, and timeliness without moving sensitive data out of customer-controlled environments, take a look at digna. It's built for in-database data quality and observability, which makes it a practical fit for ML and analytics teams operating in private cloud or on-prem estates.
To put the expected-arrival checks from this checklist into practice, see how digna Timeliness learns delivery patterns and flags late loads before stale features reach a model.
Frequently asked questions
Why does data quality matter for machine learning in production?
Most production ML failures start with data arriving late, malformed, or silently damaged, not with the model itself. In one typical incident, an upstream source changed how it populated a single field, shifting a feature's meaning without triggering any schema failure. The pipeline kept running while business users lost confidence.
What causes machine learning model decay?
The article names four repeat offenders: data drift and concept drift, missingness and feature skew, label noise, and schema changes. Missing values are especially common, with 43% of EU machine learning practitioners reporting missing critical values as their predominant data quality challenge. Knowing these signatures speeds diagnosis beyond watching model metrics.
Which data quality dimensions matter for machine learning?
A 2025 study by Gómez Plaza et al. lists accuracy, completeness, consistency, credibility, and currentness as inherent data quality properties for ML. In practice, teams should also track distribution stability, completeness by slice, cardinality shifts, and plausibility, asking whether an input is fit for the model decision it supports.
Should I use rules or anomaly detection to monitor ML data?
Use both. Explicit rules suit contractual fields, compliance logic, and domain constraints, while learned baselines catch drift, freshness changes, volume anomalies, and unusual feature behaviour that nobody can enumerate in advance. Ambiguous anomalies go to analyst review, where context decides severity, so humans are not left maintaining every threshold by hand.
Why is timeliness important for machine learning models?
Late data changes model behaviour, not just report freshness. If a source regularly lands later than the model expects, you can get skewed scoring on incomplete reality, and the FRA links missing time frames to bias. The remedy is to learn normal arrival patterns and alert before stale features reach a decision.



