Data Quality in Databricks: A Practical 2026 Guide
|
9
min read

Most Databricks teams don't start with a quality strategy. They start with a broken dashboard, a finance review where the numbers don't reconcile, or a machine learning feature table that looked fine until a downstream model drifted for no obvious reason. The painful part is that the pipeline often kept running, which meant the problem showed up in business logic instead of in the job run itself.
That's why data quality in Databricks has to be treated as an operating model, not just a set of checks. If you've ever wished you could catch bad data before it reached a board deck, a compliance report, or a feature store, the issue is usually bigger than one failed task. It's the gap between a platform that can process data and a team that can prove the data is still trustworthy.
Table of Contents
When Quiet Drift Costs More Than Loud Failure
The Quality Lenses That Shape a Databricks Program
Turn the six dimensions into table checks
Where Delta Lake, Unity Catalog, and DLT Each Take Responsibility
Why the boundaries matter
Validation Tools Compared From a Working Engineer's View
What each option really costs
Embedding Quality Checks Into Delta Live Tables Pipelines
A small bronze to silver pattern
Governance, Lineage, and the Operating Model That Holds It Together
Ownership and tiering make alerts actionable
Where digna Fits and Why In-Database Execution Changes the Equation
What runs inside the customer environment matters
Putting It Together and a Realistic Ninety-Day Plan
When Quiet Drift Costs More Than Loud Failure
The worst Databricks incident isn't the one that pages you at 2 a.m. It's the one that finishes successfully while your revenue numbers slowly diverge from the source system, your BI layer keeps refreshing, and nobody notices until a month-end close or a regulator asks why the audit trail doesn't line up. A loud failure is annoying. A silent one becomes institutionalized.
That's the practical problem data quality in Databricks has to solve. A Delta job can keep landing rows, a notebook can still execute, and the dashboard can still render, while the underlying records are already unfit for analytics, ML, or reporting. Teams often discover the issue only after it has propagated into multiple consumers, which makes remediation much harder than catching the source table early.
Practical rule: if the pipeline fails loudly, you usually know where to look. If it drifts quietly, you need observability that watches the data itself.
That's also why manual guardrails age poorly. Databricks itself notes that manual, rule-based data quality does not scale as estates grow, because teams end up monitoring only a small subset of critical tables while most of the estate remains unchecked. Once you've got dozens of datasets, a couple of workspaces, and a mix of streaming and batch loads, you need controls that watch patterns, not just one-off assertions.
For teams that also need clean downstream records in other systems, even something as mundane as address accuracy for mailings becomes a useful reminder that quality is about preventing bad inputs from spreading, not just reacting to failures after the fact. The same logic applies in Databricks, except the blast radius is dashboards, models, and compliance workflows instead of envelope returns.
The Quality Lenses That Shape a Databricks Program
Databricks' quality model starts with the classic six dimensions of data quality, consistency, accuracy, validity, completeness, timeliness, and uniqueness. Those aren't abstract labels. They map cleanly to checks on Delta tables, where consistency catches conflicting values across records, accuracy checks whether values match the source of truth, validity checks whether fields conform to expected types or ranges, completeness looks for missing values, timeliness watches whether the data arrives on schedule, and uniqueness catches duplicate records.
Turn the six dimensions into table checks
The useful move is to translate each dimension into a measurable control. Databricks' own guidance points to monitoring the fraction of null or zero values, the 90th percentile of numerical columns, and changes in categorical distributions over time. That's a strong starting point because it turns a governance concept into something you can attach to a table, a pipeline, or an alert. It also keeps you from overfitting to a single rule that breaks the moment source behavior changes.
The other useful lens is the seven Cs, Collect, Characterize, Clean, Contextualize, Categorize, Correlate, and Catalog. Databricks' public guidance specifically calls out Clean as a place where ETL can address duplication and typos, which is important because many teams wrongly treat cleansing as a one-time ingest concern. The better pattern is to use Characterize to capture metadata like the time the data was created, method of collection, and location or sensor settings, then use Correlate to reconcile the same data point across systems before you expose it to consumers.
Quality work gets easier when producers and consumers agree on the shape of the data before the first row lands.
That's where data contracts fit naturally. Databricks' own data product guidance says quality metrics should be monitored and exposed so expected quality is maintained over time, and it recommends defining contracts upfront with quality metrics, schema definitions, usage policies, and security parameters. In practice, that means quality stops being a post-load audit and becomes part of the product definition itself.
Where Delta Lake, Unity Catalog, and DLT Each Take Responsibility
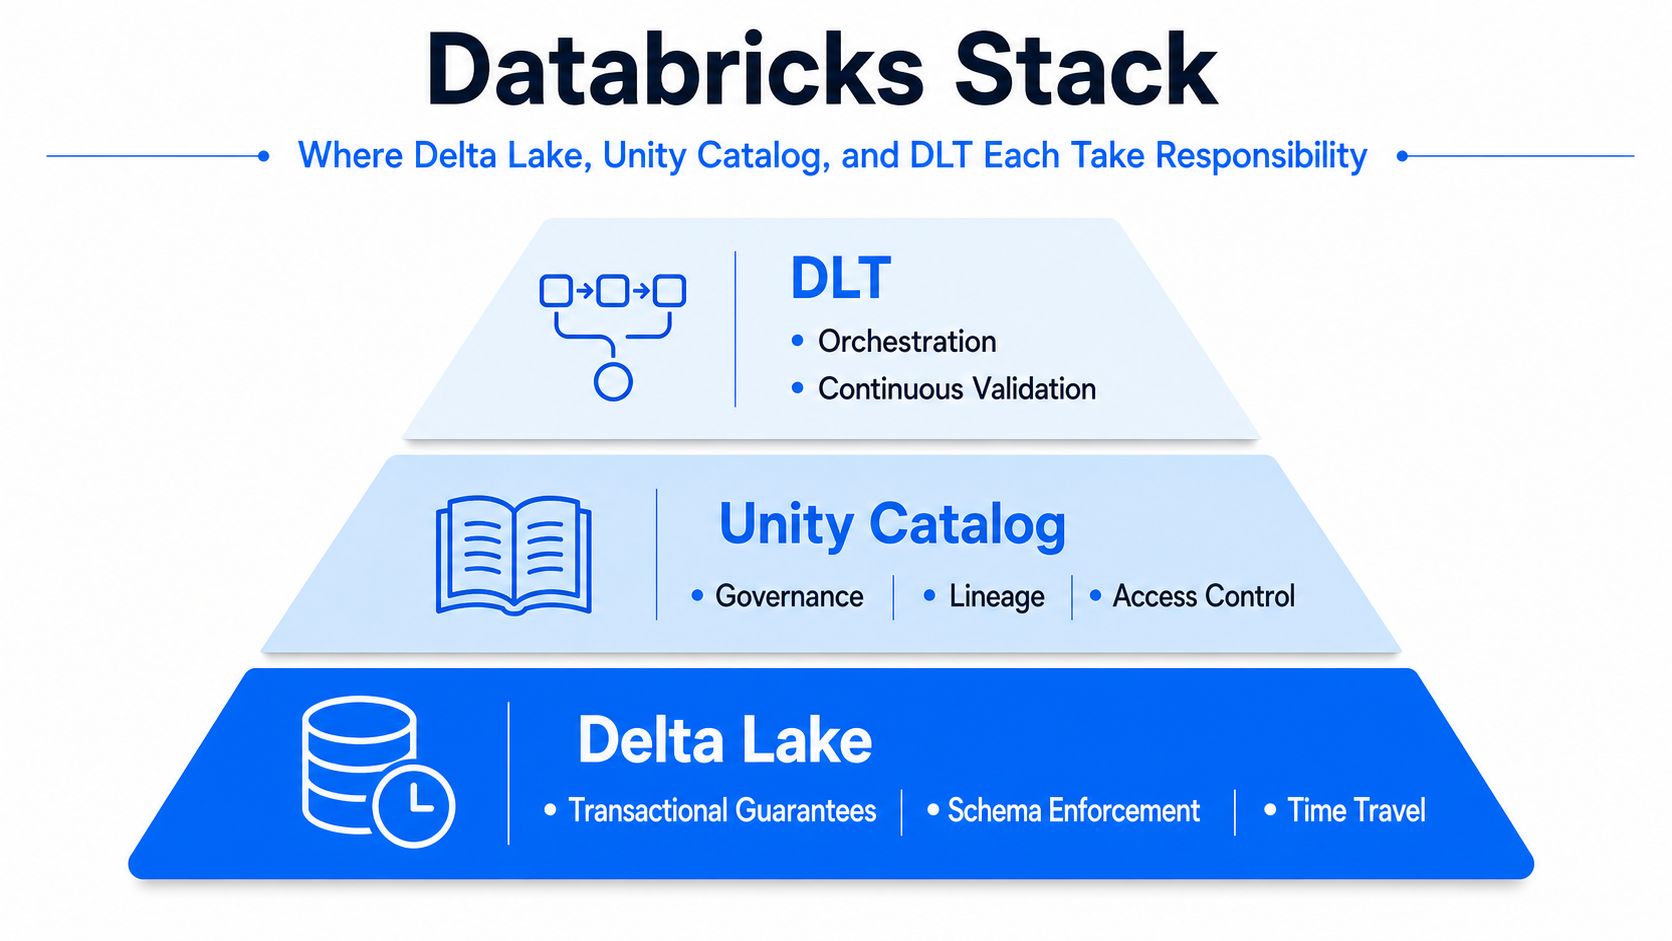
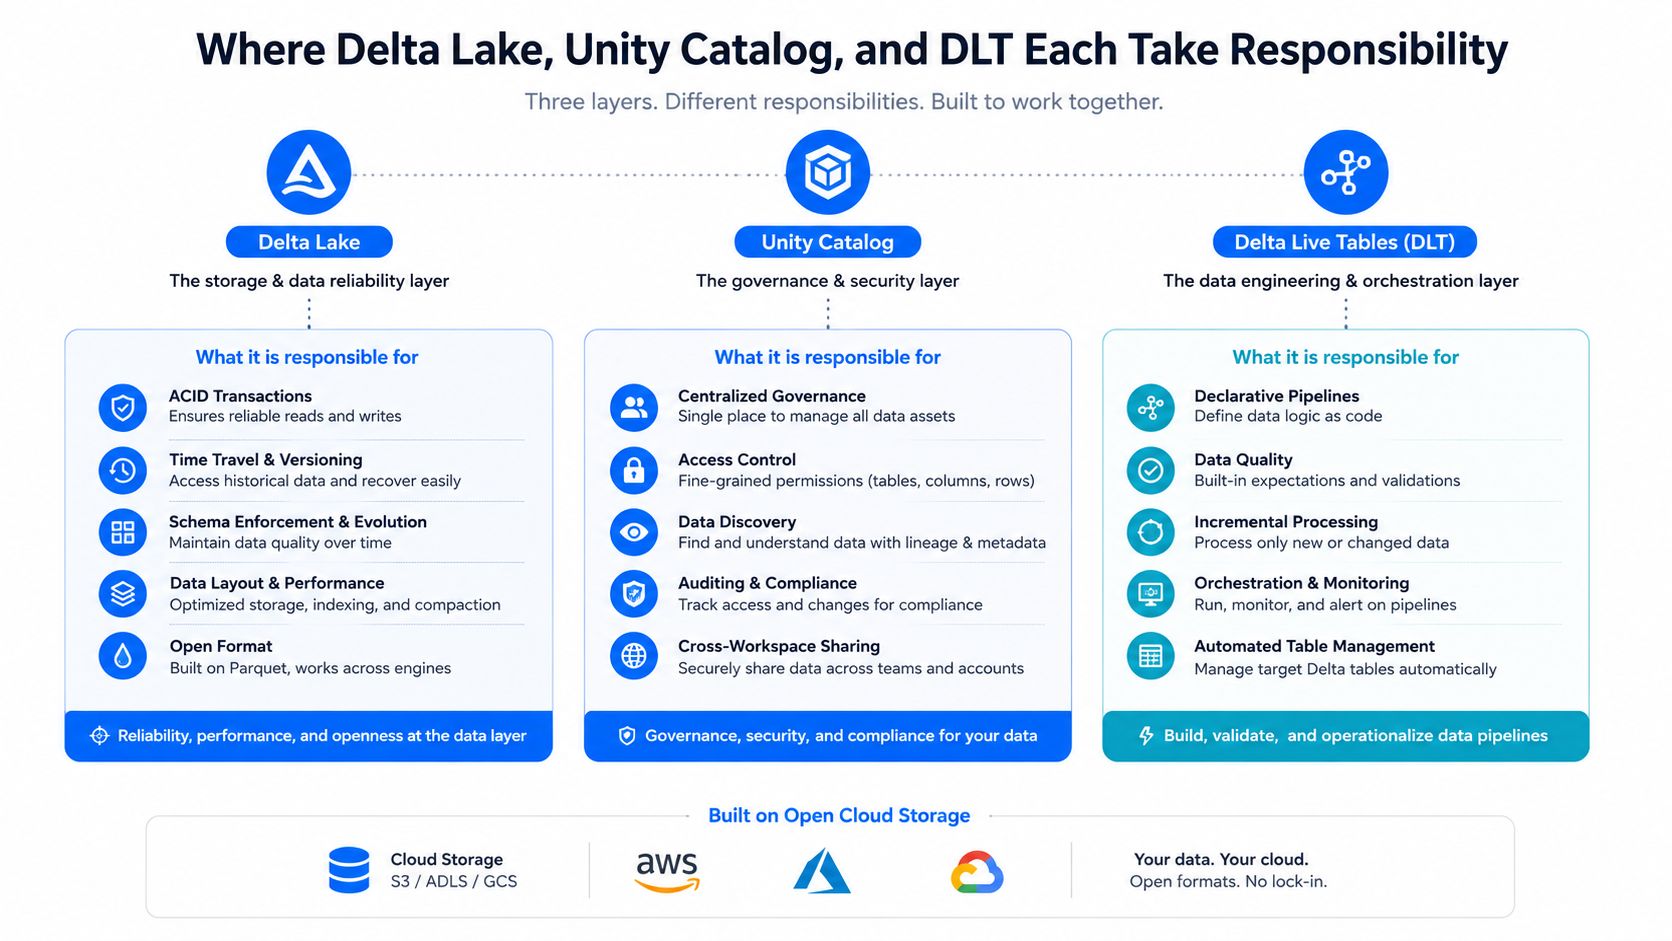
The cleanest Databricks quality programs separate structure, governance, and pipeline behavior. Delta Lake gives you transactional guarantees, schema enforcement, and time travel, which makes row-level validation reproducible instead of ephemeral. Unity Catalog adds centralized governance, ownership, and lineage, which is what you need when quality issues have to be traced across many datasets. Delta Live Tables sits in the orchestration layer, where expectations and pipeline behavior can be enforced as data moves.
Why the boundaries matter
That separation isn't academic. If Delta Lake is enforcing structure, you can trust that the table definition didn't shift under your feet without a trace. If Unity Catalog is handling governance and lineage, you can ask who owns a schema and what downstream surfaces consume it. If DLT is handling pipeline logic, you can decide whether a bad record should fail a stream, get quarantined, or trigger a dependent table to stop.
Microsoft's Azure Databricks documentation says data quality monitoring can be applied to all of the tables in a schema and that Databricks automatically assesses freshness and completeness. That matters because it shows the platform can watch delivery behavior at broad scope instead of forcing engineers to hand-pick every table. The limitation is also clear. Freshness and completeness are useful signals, but they're not the same thing as business correctness.
That's why teams usually pair platform monitoring with code-level controls. A pipeline can arrive on time and still violate a foreign key, duplicate a business key, or carry a malformed value that a downstream analyst mistakes for valid. If you're evaluating where to put your effort, the rule is simple. Use Delta for physical reliability, Unity Catalog for policy and discovery, and DLT for data movement controls.
For a practical implementation path, digna's Databricks data platform observability approach fits best where you want in-database checks alongside platform-native governance. Teams that care about database performance as part of data health often treat that same separation of concerns seriously, which is why resources like faster apps with PageSpeed Plus can be useful context for thinking about workload efficiency and downstream consumption.
Validation Tools Compared From a Working Engineer's View
The trade-off isn't “which tool is best.” It's where you want the logic to live, how much maintenance you can tolerate, and whether your checks need to be embedded in the pipeline or managed separately. In real Databricks estates, I usually see four patterns: Deequ, Great Expectations, DLT expectations, and built-in schema-level monitoring.
What each option really costs
Validation approaches in Databricks at a glance | Where it runs | Best fit | Main trade-off |
|---|---|---|---|
Deequ | On Spark | Teams that want metrics from DataFrames and are comfortable maintaining code | Strong engine-level fit, but you own the engineering upkeep |
Great Expectations | Usually alongside the platform | Teams that want a mature expectation suite and human-readable docs | Good governance workflow, but it adds an external service layer |
DLT expectations | Inside the Databricks pipeline | Fastest path for pipeline-native controls | Great for ingest logic, but not a full governance model |
Built-in schema-level monitoring | Inside Databricks control plane | Broad freshness and completeness surveillance across schemas | Useful coverage, but it doesn't cover business rule violations |
Deequ is attractive because it runs natively on Spark and computes metrics directly from DataFrames. That makes it a strong fit when you want tight integration with transformations you already own. The catch is maintenance. Someone still has to evolve the rules, keep the code reviewed, and decide what happens when the source shape changes.
Great Expectations is stronger on documentation culture and expectation suites. It works well when teams want data docs, explicit assertions, and a recognizable pattern for validation. The cost is operational sprawl, because you're now managing another service or layer around Databricks.
DLT expectations are the lightest option inside the platform because they execute in the pipeline itself. For teams trying to stop bad rows early without building a separate validation stack, that's a good starting point. Still, the built-in monitoring story is narrower. It automatically watches freshness and completeness, but it doesn't tell you whether a value violates a business rule, whether a key is duplicated, or whether a record should be quarantined.
If you want a broader comparison list for teams that are still deciding, digna's free data validation tools overview is a useful reference point for positioning built-in checks against more specialized validation layers. The main takeaway is that Databricks monitoring covers a real slice of the problem, but most mature programs need a second layer for semantics.
Embedding Quality Checks Into Delta Live Tables Pipelines
A practical DLT pattern starts with the first table in the chain, not the last alert. If a bronze stream lands raw customer data, add expectations where the records first become usable, then route the bad ones into a quarantine table instead of failing the entire pipeline unless the issue is blocking. That gives you signal without turning every issue into a full outage.
A small bronze to silver pattern
For example, a bronze-to-silver stream can validate customer email format, compare customer_id against a dimension table for referential integrity, and flag records with missing fields into a quarantine table. The silver table then consumes only the clean subset, while the quarantine table stays monitored so you can see whether the error pattern is getting worse or better. That's a better operational shape than letting the stream fail on every bad row and forcing the team to replay data for issues that are non-blocking.
The other useful behavior is dependency chaining. If one table in the pipeline breaks, you usually want only the dependent tables to stop, not the entire DAG. That keeps the blast radius aligned with the actual defect. It also makes the root cause more obvious because the failed edge points to the table where the quality control tripped.
The schema-level monitoring logic in Databricks is also worth mirroring in your own pipelines. Databricks marks a table as stale if a commit is abnormally delayed and incomplete if the number of rows written in the past 24 hours falls below the lower bound of the forecast range derived from historical row counts. That's a useful mental model for DLT as well, because quality isn't only about the contents of records. It's also about whether the load arrived when expected and whether the volume is plausible.
A final caution, keep Auto Loader and schema evolution under control. Schema drift is often treated like an infrastructure detail, but it's a quality issue the moment a downstream notebook or model assumes a column still exists.
Governance, Lineage, and the Operating Model That Holds It Together
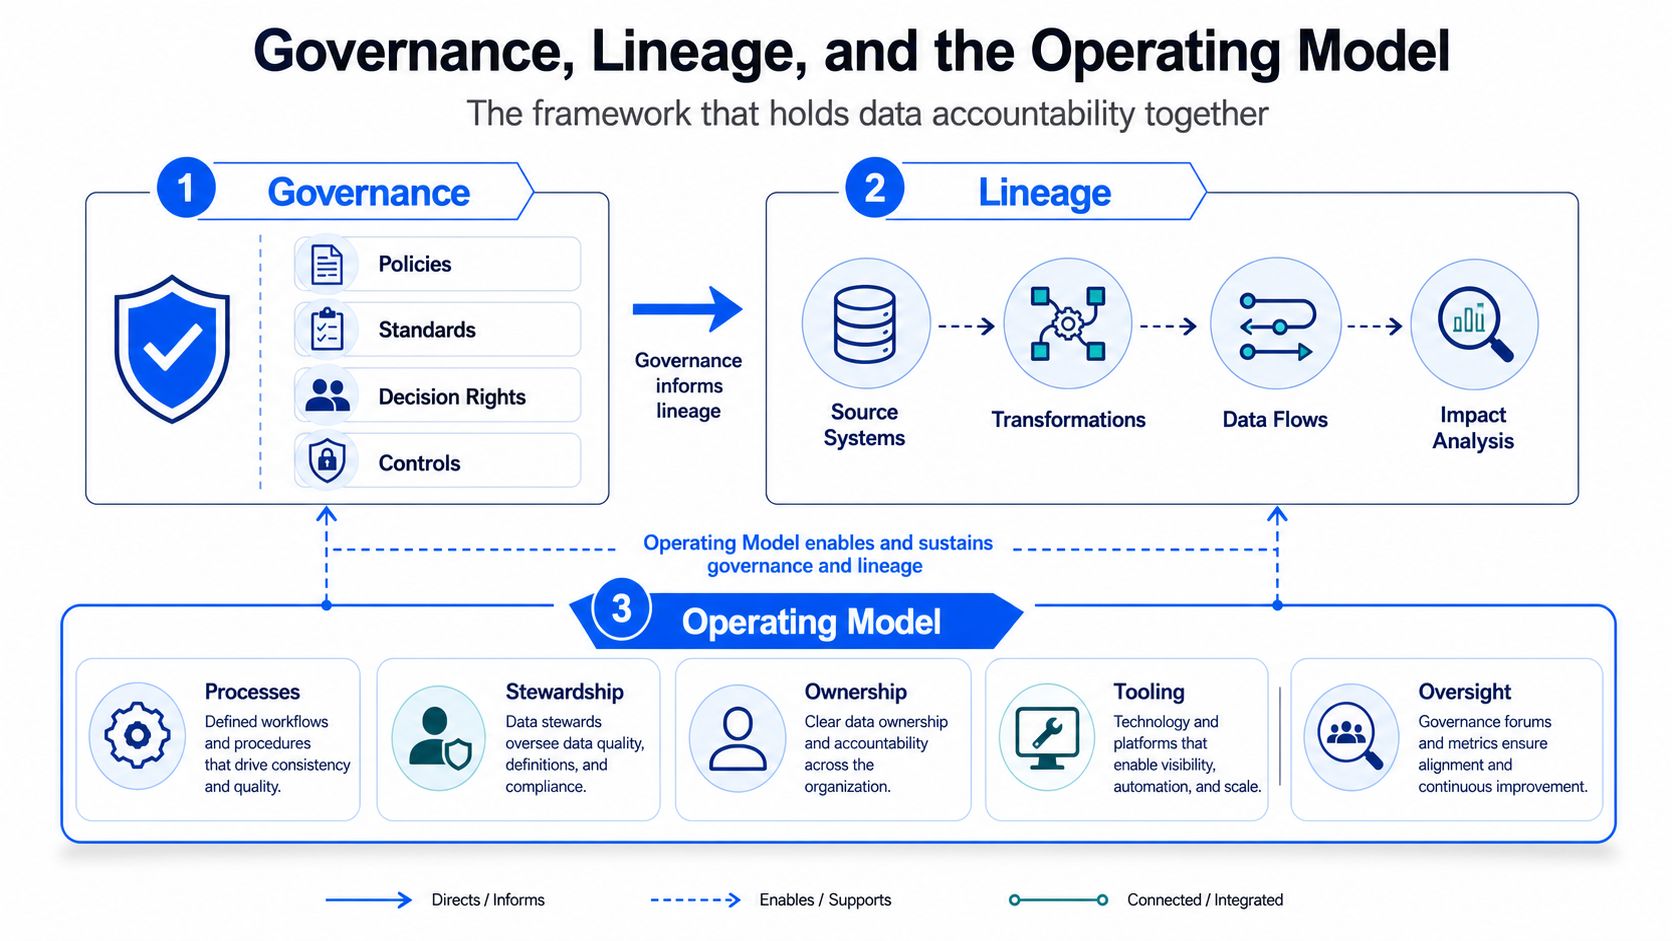
Detections don't create trust by themselves. Someone still has to own the alert, interpret the lineage, decide whether the issue is a blocker, and route the fix to the right engineer or analyst. That's the operating model gap many Databricks implementations leave open.
Ownership and tiering make alerts actionable
Databricks' own data product guidance says quality metrics can be monitored and exposed over time, and that teams should define data contracts upfront with quality metrics, schema definitions, usage policies, and security parameters. That naturally leads to an operating model where each dataset has an owner, each table has a criticality tier, and each alert has an explicit remediation path. Without that, every signal just becomes another notification.
In practice, the easiest way to structure this is to tier datasets by business impact. Finance, risk, and customer-facing tables get the strictest controls and the fastest response path. Supporting tables get lighter monitoring and more tolerance for warnings. That lets the team spend manual review time where it matters instead of treating every table like it has equal blast radius.
Lineage then turns alerts into routing decisions. If a finance load is delayed, the question isn't just “what failed,” it's “which dashboards, models, and reports are downstream of this schema.” That's where Unity Catalog is valuable, because lineage gives you a concrete path from an upstream delay to the consumer surfaces that are now unreliable.
Operational rule: every alert should answer three questions, who owns it, who depends on it, and what happens if nobody fixes it today.
For teams building governance-heavy programs, resources like de-risk unmanned building projects are a good reminder that an operating framework matters as much as the sensors. The same is true in Databricks. A quality signal without ownership is just noise.
Where digna Fits and Why In-Database Execution Changes the Equation
After Databricks-native monitoring, the gap is usually coverage and control. Freshness and completeness checks help, but they do not cover every business rule, every anomaly pattern, or every schema change that can break a downstream notebook. An in-database layer like digna can sit alongside the platform without replacing it.
What runs inside the customer environment matters
digna runs inside the customer's own environment, so metric computation and analysis stay where the data lives. That matters for teams that do not want to move samples out for inspection, and for environments where security or governance rules make external processing awkward. It also means checks can run against the live data estate instead of a partial extract.
The module split is practical. Data Anomalies uses AI-driven baseline learning instead of hand-written rules, which helps with datasets that change shape or volume over time. Timeliness watches data arrival and flags delays, missing loads, and early deliveries while computing an expected delivery time per table. Data Validation handles record-level business rules, which is where foreign-key style logic and audit requirements tend to land. Schema Tracker catches structural changes like added columns, removed columns, and data type shifts.
That combination closes several Databricks pain points at once. Teams do not have to keep writing static thresholds for every dataset. They can catch unpredictable job arrivals before dashboards go stale. They can enforce record-level controls for regulated tables. They can detect silent schema drift before it breaks a notebook or an ML feature pipeline.

The practical fit is alongside Unity Catalog and DLT. Use Databricks for governance, orchestration, and platform-native freshness checks. Use an in-database observability layer when you need broader anomaly detection, record-level validation, and schema tracking without pulling data out of the system. That is where an in-database layer like digna can sit alongside the platform rather than replace it, see how in-database execution changes the equation.
Putting It Together and a Realistic Ninety-Day Plan
The durable model is simple. Define quality dimensions per dataset, enforce structure with Delta, govern with Unity Catalog, validate in-pipeline with DLT, and add in-database observability for anomalies, timeliness, validation, and schema tracking where native checks stop short. Databricks' schema-level monitoring already uses intelligent scanning that prioritizes important tables and skips low-impact ones, while automatically assessing freshness and completeness from historical patterns. That gives you a strong base, but it's still only part of the operating model.
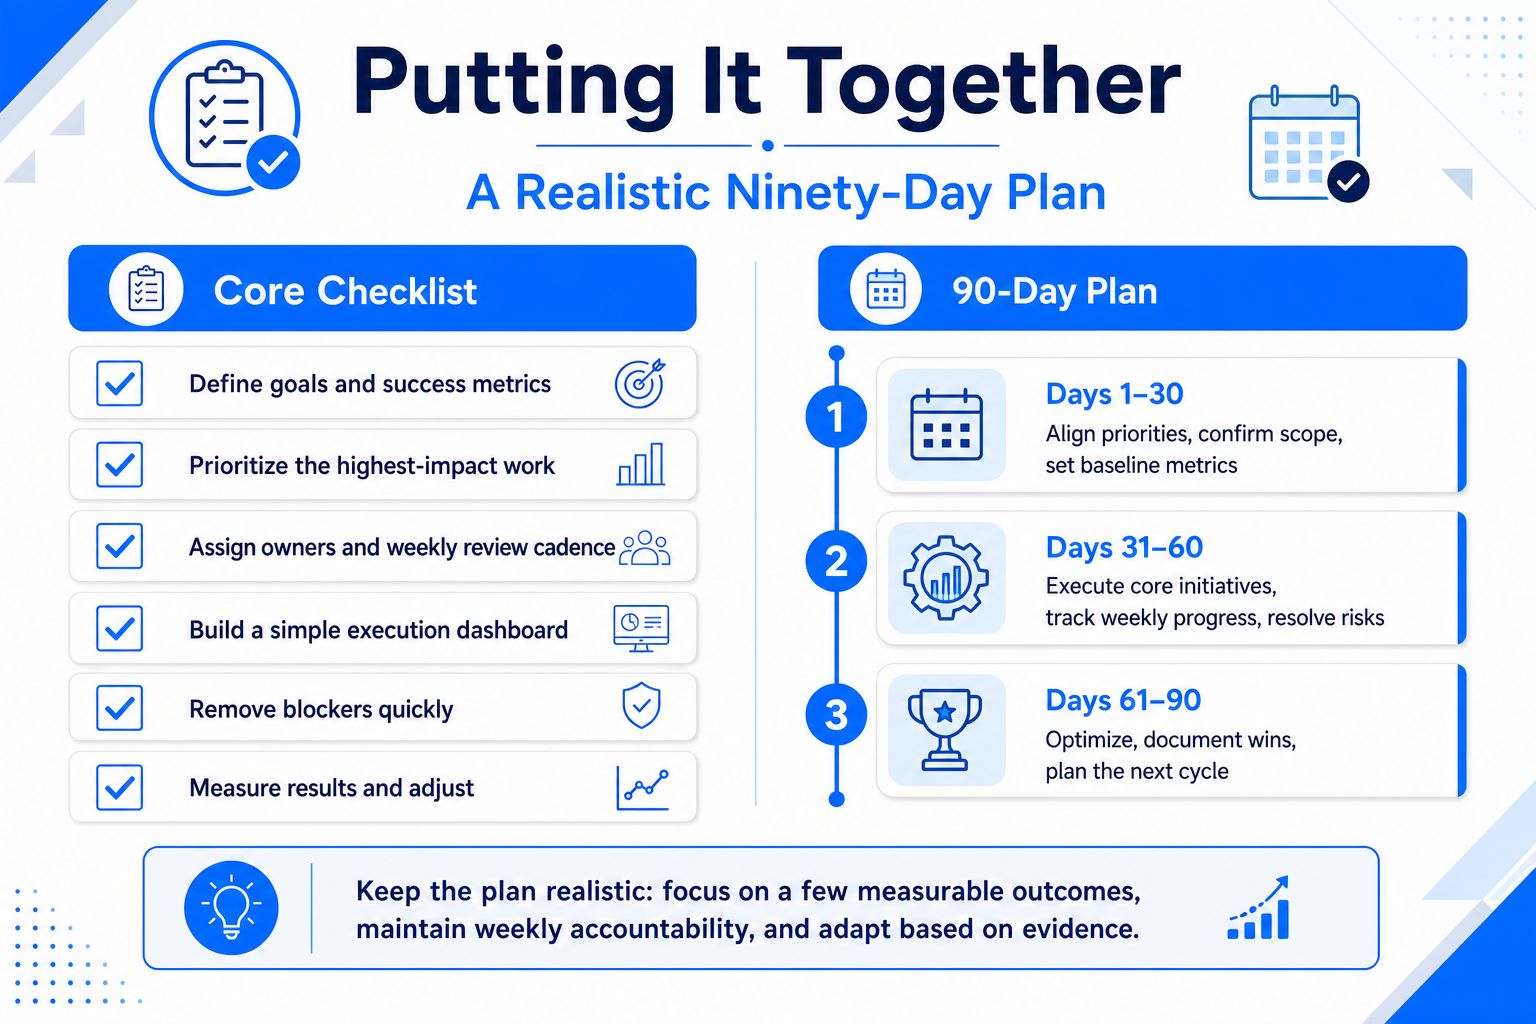
A realistic first ninety days looks like this. In weeks one and two, inventory tables and tier them by business criticality. In weeks three to six, enable Unity Catalog monitoring on the most important schemas and add DLT expectations to the top pipelines. In weeks seven to ten, deploy anomaly detection and timeliness controls on those same datasets and tune the alerts. In weeks eleven and twelve, formalize ownership, lineage-driven triage, and data contracts so the process survives beyond the first incident.
The goal isn't to buy more tools. It's to make sure the team can answer one question quickly, is this data safe to use right now?
If you're building that operating model and want in-database monitoring that complements Databricks rather than fighting it, visit digna and see how the platform handles anomalies, timeliness, validation, and schema changes inside your own environment.
See how digna does this in practice: Databricks lakehouse data quality.
Frequently asked questions
What are the six data quality dimensions in Databricks?
Databricks uses consistency, accuracy, validity, completeness, timeliness and uniqueness. Each maps to a check on Delta tables: conflicting values, mismatches with the source of truth, wrong types or ranges, missing values, late arrival and duplicate records. The guide recommends turning every dimension into a measurable control attached to a table or alert.
How do Delta Lake, Unity Catalog and Delta Live Tables split responsibility for data quality?
Each layer owns a different job. Delta Lake handles physical reliability through transactions, schema enforcement and time travel. Unity Catalog covers governance, ownership and lineage across datasets. Delta Live Tables enforces expectations while data moves, deciding whether a bad record fails a stream, gets quarantined or stops dependent tables.
Should I use Deequ, Great Expectations or DLT expectations in Databricks?
It depends on where you want the logic to live. Deequ runs natively on Spark but you own the code upkeep, Great Expectations adds readable docs at the cost of an external layer, and DLT expectations are the lightest in-pipeline option. None of them covers business rules and governance on its own.
How do I quarantine bad records in a Delta Live Tables pipeline?
Add expectations where bronze records first become usable, then route failures into a quarantine table instead of failing the whole pipeline. The article's example checks email format, compares customer_id against a dimension table and flags missing fields, so the silver table consumes only the clean subset while the quarantine table stays monitored.
What does a realistic ninety-day plan for Databricks data quality look like?
Start small and build an operating model, not just checks. The guide pairs schema-level freshness and completeness monitoring with code-level rules, gives every dataset an owner and criticality tier, and uses lineage to route alerts, so finance, risk and customer-facing tables get the strictest controls and fastest response path.



