Data Ingestion Meaning: A Guide to Reliable Pipelines
|
6
min read

You're probably here because something upstream made your numbers look ridiculous.
A revenue dashboard that was fine yesterday now shows a sudden drop. A customer analytics model starts scoring strangely. A finance report loads with gaps that no one can explain. A common first reaction is to blame the dashboard, the warehouse, or the model. A lot of the time, the problem started earlier, at ingestion.
That's why data ingestion's meaning isn't just “moving data from A to B.” In practice, ingestion is the first control point where a team decides whether incoming data is fit to trust. If that control point is weak, every downstream system inherits the damage.
Table of Contents
The Silent Failure Behind Every Broken Dashboard
A dashboard rarely breaks at the chart layer first. It breaks earlier, at ingestion, when the platform accepts late, incomplete, duplicated, or structurally changed data as if nothing is wrong.
That failure is expensive because it looks normal. The dashboard renders. Queries finish. A model still produces scores. Meanwhile, the numbers are already off, and the team starts debugging BI logic, warehouse performance, or business definitions instead of checking the intake point where the bad data entered.
I've seen this pattern repeat across analytics stacks. An upstream API drops fields without notice. A loader retries and creates duplicates. A partition arrives six hours late, but the scheduled report still publishes on time. By the time someone notices, the issue has spread into executive reporting, forecasting, and downstream systems that depend on the same tables, including workflows fed by AI data extraction.
What makes these failures hard to catch
Ingestion problems often avoid obvious alarms because infrastructure can stay healthy while data quality degrades. CPU is fine. Jobs are green. Storage is available. None of that confirms that the records are complete, current, or shaped the way downstream consumers expect.
That is why ingestion should be treated as a control point, not a transport step.
A single upstream change can pass through several layers before anyone ties the symptom back to the source. A renamed column may not fail a load if the pipeline is permissive. A volume drop may look harmless until a dashboard undercounts revenue. A timestamp parsing issue may shift records into the wrong date window and distort trend reporting for days.
Broken dashboards usually start with unchecked data entering the system, not with a broken chart.
Trust is established before analytics begins
Reliable teams verify data when it arrives. They do not wait for BI users, analysts, or ML consumers to discover the problem later.
The checks that matter are operational and specific:
Arrival time: Data can load successfully and still be too late for the reports that depend on it.
Volume and completeness: Drops, spikes, truncation, and duplicates should be treated as ingestion incidents first.
Schema integrity: Added fields, removed columns, type changes, and nullability changes need explicit handling.
Basic validity: IDs, timestamps, currencies, and event types should meet expected formats before data moves deeper into the stack.
This is the practical meaning behind data ingestion reliability. If the ingestion layer only moves bytes, every downstream system inherits risk. If the ingestion layer verifies freshness, shape, and fitness for use, the rest of the platform stays far more predictable.
What Is Data Ingestion Really
Data ingestion is the point where a platform decides whether incoming data can be trusted enough to enter the system.
That definition is more useful than "moving data from one place to another" because transport alone does not protect dashboards, alerts, or models. A pipeline can copy every file on schedule and still fail the business if the payload is late, incomplete, malformed, or exhibits a subtle change from yesterday. In production, ingestion is where teams enforce the first hard checks on freshness, schema shape, and basic validity.
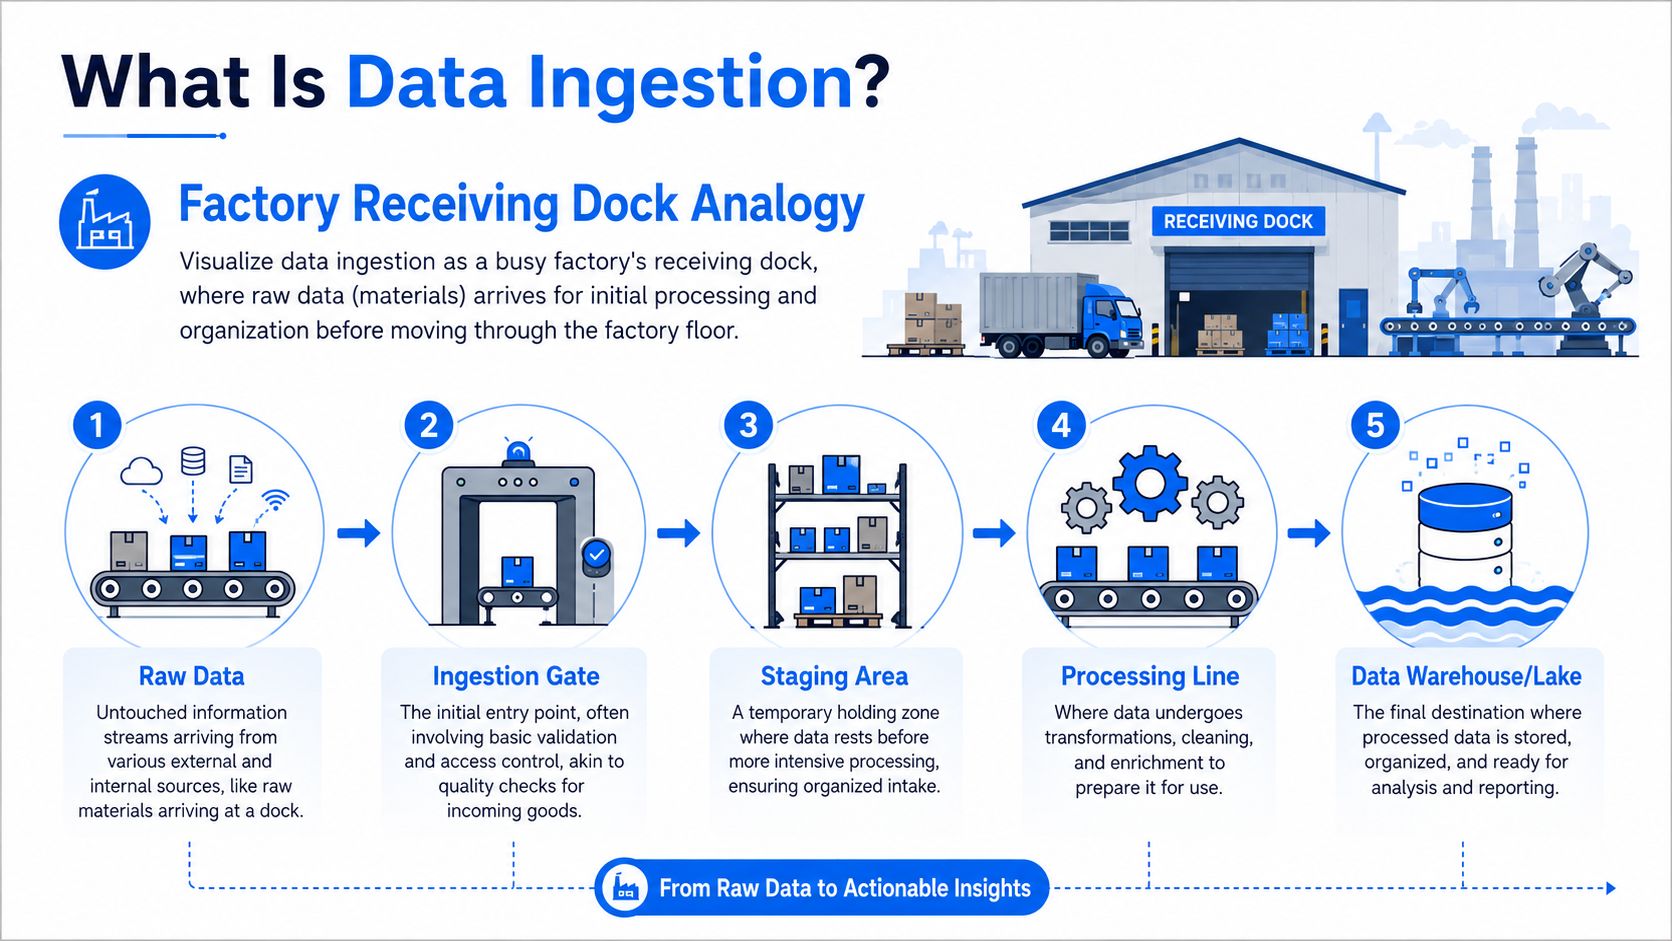
A good ingestion layer receives data, identifies what arrived, validates it against expectations, and routes it to the right destination with enough metadata to trace problems later. That is why ingestion failures are often reliability failures first and transport failures second.
If you work with documents, forms, or semi-structured inputs before they ever hit the warehouse, it helps to understand where AI data extraction fits. Extraction pulls information out of the source. Ingestion covers the broader operating workflow that accepts it, checks it, stages it, and loads it into the destination in a controlled way.
The stages that matter in practice
Engineers usually break ingestion into a handful of repeatable stages. The labels vary by stack, but the work is consistent.
Source identification
Every design choice starts here. API data, database replication, partner CSV drops, and event streams all fail differently. Teams that skip source-specific assumptions usually end up with brittle connectors and vague ownership.Data extraction
This is the collection step. Connectors, CDC jobs, file readers, and webhook consumers pull data out of the source system. A common mistake is treating a successful API call or file pickup as success, even when the returned payload is partial or structurally different.Staging
Raw data needs a place to land before it reaches core models or serving tables. Staging makes replay possible, gives engineers something concrete to inspect during incidents, and limits blast radius when upstream systems change unexpectedly.
Practical rule: Do not make curated warehouse tables the first place source-side surprises show up.
Validation
During validation, ingestion earns its keep. Checks should cover required fields, row counts, duplicate keys, timestamp parsing, enum values, null spikes, and schema changes. Teams using data ingestion software for pipeline monitoring and validation usually reduce the time between upstream breakage and detection because they are watching the handoff point, not waiting for an analyst to notice a bad chart.Transformation
Some cleanup happens during ingestion even in ELT-heavy stacks. Standardizing timestamps, normalizing field names, coercing types, and tagging lineage are often worth doing early because they make downstream failures easier to debug.Loading
The final write step puts data into the target system in a form other systems can use. Partitioning, idempotent writes, deduplication strategy, and retry behavior matter here because bad load logic can create silent duplicates or partial tables that look healthy from the outside.
The trade-off is straightforward. Strict validation at ingestion can delay data when checks fail. Loose validation keeps data flowing but pushes bad records into BI and AI systems where diagnosis gets slower and more expensive. Strong teams decide those thresholds explicitly, source by source.
If you only keep one idea from this section, keep this one. Data ingestion is the control point where raw arrival becomes verified availability.
Common Data Ingestion Architectures and Patterns
A team ships a clean dashboard, then trust disappears because yesterday's numbers arrived at 10 a.m. instead of 6 a.m., or because a source added a field and the pipeline accepted it without complaint. Architecture choices drive those outcomes. Ingestion patterns decide not only how data moves, but when freshness, schema integrity, and validation are enforced.
Two decisions shape most ingestion systems. The first is timing: batch or real-time. The second is where data is cleaned and standardized: ETL or ELT. Neither choice is academic. Each one changes operating cost, failure recovery, debugging speed, and how early a team can catch bad data before it reaches dashboards or models.
Batch and real-time solve different operational needs
Batch ingestion moves data on a schedule. Real-time ingestion processes records as events arrive. Both can work well. The right choice depends on how quickly downstream systems need verified data, and how much operational overhead the team can carry.
Batch fits workflows where data can arrive in windows and still be useful. Finance close processes, daily reporting, partner file exchanges, and periodic reconciliation jobs usually fall into this category. It is simpler to reason about, easier to backfill, and often easier to make idempotent.
Real-time ingestion fits systems where stale data creates immediate business problems. Fraud signals, user activity streams, logistics events, and operational alerting often need low-latency delivery. But streaming comes with more failure surfaces. Queues fill up. Consumers fall behind. Offsets get mismanaged. Replay can duplicate records if write logic is sloppy.
Here's the practical comparison.
Aspect | Batch Ingestion | Real-Time Ingestion |
|---|---|---|
Latency | Scheduled and delayed by design | Near-immediate availability |
Operating model | Runs in windows with clearer recovery points | Runs continuously and needs tighter monitoring |
Failure recovery | Backfills and reruns are usually simpler | Replay, ordering, and duplicate handling need more care |
Typical use cases | Historical analytics, scheduled reporting, finance workflows | Live operational dashboards, event monitoring, fast-response systems |
A common mistake is forcing everything into streaming because the business asks for “real time.” In practice, many teams need different service levels for different datasets. A customer support dashboard may need updates every few minutes. Revenue reporting may only need one verified daily load. Matching the pattern to the use case keeps the system supportable.
If you're evaluating broader system design choices around these trade-offs, this guide to Appjet.ai architectural patterns is a useful companion read because ingestion design rarely lives in isolation.
ETL and ELT change where verification happens
The second architecture decision is transformation order. ETL means extract, transform, then load. ELT means extract, load, then transform. The technical distinction matters less than the operational one: where does the team validate and standardize data before downstream consumers depend on it?
In ETL, records are cleaned before they land in the destination. That approach works well when the target system expects strict structure, when storage of raw inputs is limited, or when compliance rules require preprocessing before persistence. The trade-off is that failed transformations can block data from landing at all, which makes investigation slower if raw inputs are not preserved elsewhere.
In ELT, raw data lands first and transformations run inside the warehouse or lakehouse. This gives analysts and engineers more flexibility, preserves source detail for reprocessing, and usually speeds iteration. It also creates a risk. If teams treat landing as success, malformed records and schema drift can sit in raw tables until they break a downstream model hours later.
That is why mature ingestion design uses intake checks in both ETL and ELT stacks. Required fields, type validation, duplicate detection, timestamp sanity checks, and schema change alerts should happen as data enters the platform, even if business logic transformations happen later.
A practical rule set helps:
Choose ETL when source data must be normalized before storage, target systems have tight structural constraints, or policy requires preprocessing before loading.
Choose ELT when preserving raw inputs matters, warehouse compute is available, and downstream transformations change often.
Use hybrid patterns when lightweight validation and schema enforcement happen at ingestion, while business-specific reshaping happens later.
For teams comparing tools across batch, streaming, and hybrid setups, review data ingestion software for validation, replay, and schema monitoring based on how well it verifies data at the entry point, not just how fast it transports records.
Good ingestion architecture is built around freshness requirements, failure tolerance, and verification at intake. Transport alone is not enough.
The Operational Risks of Poor Data Ingestion
A weak ingestion layer rarely fails in a dramatic way. It degrades subtly, and that's why teams underestimate it.
An API returns fewer rows than usual, but the connector still reports success. A source team adds a column and shifts a type. A daily load arrives late enough to make the morning dashboard stale, but not late enough to trigger a job failure. The platform keeps running while trust erodes.

How ingestion fails without obvious alarms
The biggest categories show up again and again in production systems:
Timeliness failures
Data arrives late, partially, or not at all. The tables exist, but the business is now reading stale state.Schema drift
Column additions, removals, renames, and type changes slip in from upstream systems and break transformations or distort analytics.Silent record issues
Missing, duplicated, or corrupted records can distort downstream reports and models. AI-based detection systems can identify these deviations in real time by learning normal baselines rather than depending on hand-written thresholds, as explained in this overview of data anomalies.Volatile metrics with no obvious root cause
The KPI changes, but no one knows whether the business changed or the data did.
One point deserves special attention. Many engineers ask whether they should validate during ingestion or later. An estimated 40 to 60 percent of pipeline failures originate from unvalidated data being accepted during ingestion, according to this dbt discussion of ingestion validation.
Why business impact shows up later
Ingestion defects don't stay local. They spread.
A broken load can feed BI dashboards with stale totals. A schema mismatch can propagate null-heavy features into an ML workflow. In regulated environments, missing records can create audit gaps that aren't discovered until someone tries to reconcile history.
Teams usually notice ingestion problems in the last system touched by the error, not the first system that caused it.
That's why “move fast and validate later” doesn't hold up in data platforms. Later is where the blast radius is larger, the debugging surface is wider, and the business already consumed the mistake.
Key Metrics for Monitoring Ingestion Health
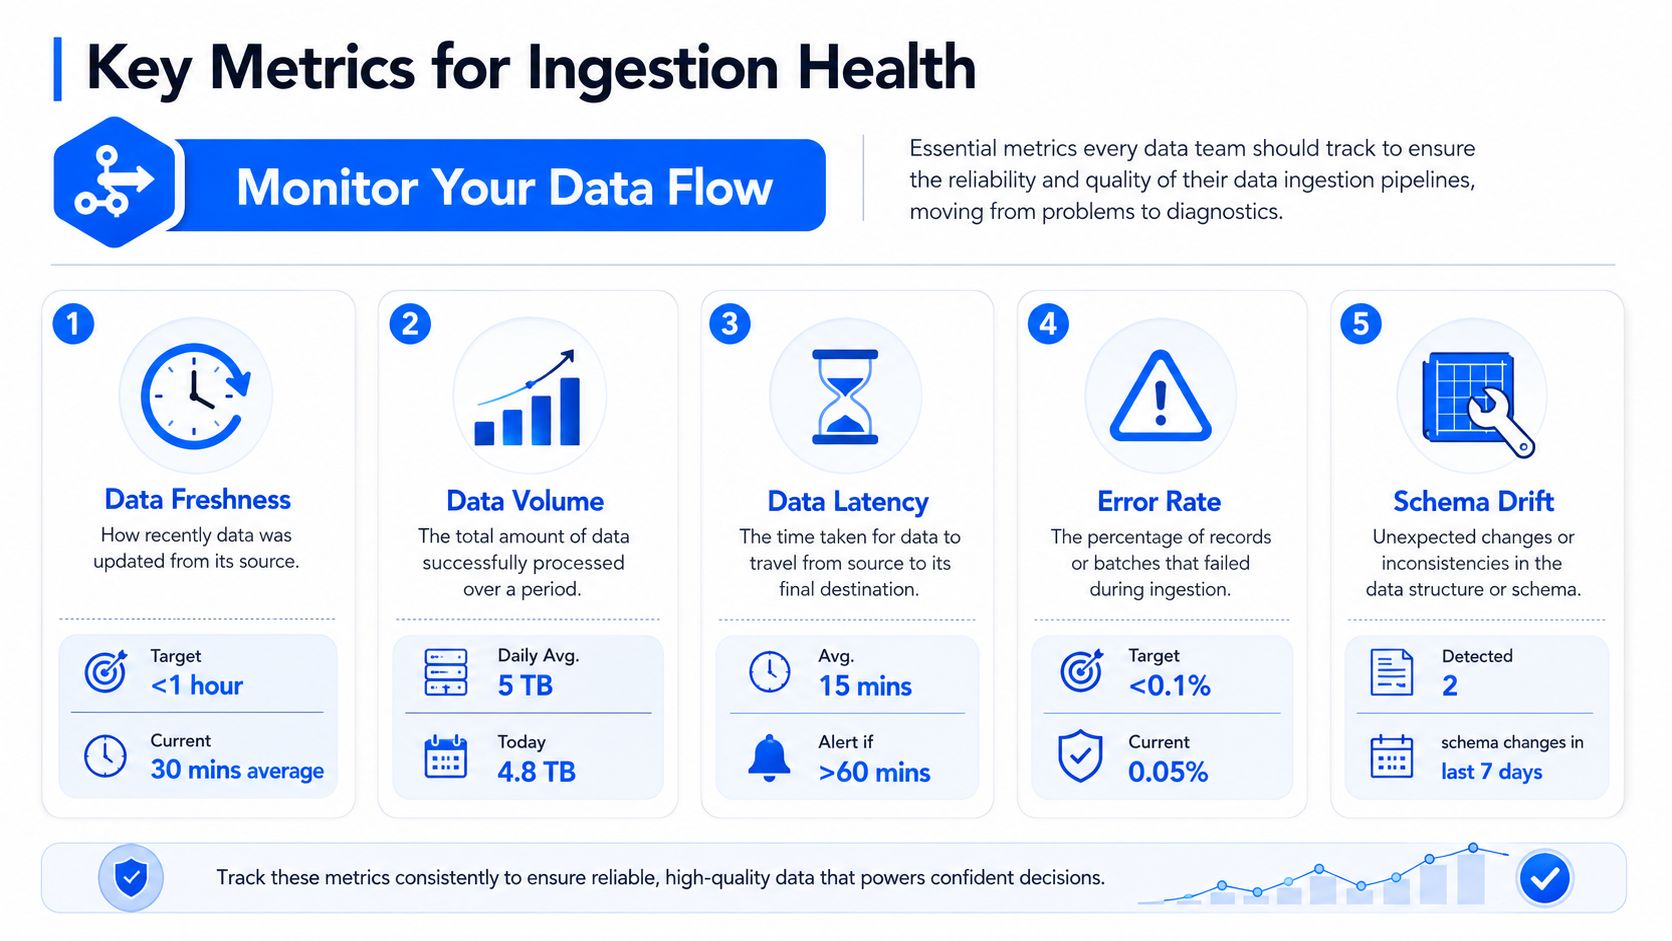
If ingestion is your first reliability boundary, monitoring needs to start there too. Teams that only watch job success rates miss the actual signal. A job can finish successfully and still load the wrong data.
The useful question is simple: what should this pipeline normally look like when it's healthy?
Freshness and volume tell you if data is arriving correctly
Two of the fastest signals are freshness and volume.
Freshness tells you how up to date the data is when compared with source expectations. For a batch table, that may mean checking whether today's scheduled load has landed. For streaming, it may mean measuring lag between event creation and availability in the destination.
Volume answers a different question. Did the source send roughly what it usually sends? A healthy job that ingests half the expected records is not healthy.
Modern data observability platforms automatically profile critical ingestion metrics including record volume, missing values, distribution shapes via histograms, value ranges for extremes, and uniqueness checks for duplicates, according to this observability metrics reference.
Completeness and schema tell you if the data is usable
A second group of metrics focuses on usability.
Completeness
Watch nulls, empty fields, and required column presence. A table can be fresh and still be unusable because key attributes vanished.Uniqueness
Duplicated keys often appear after replay, retry, or CDC handling mistakes. These issues create inflated counts and inconsistent joins.Value distribution
Histogram shifts and out-of-range values often catch subtle source problems before stakeholders notice a dashboard anomaly.Schema integrity
Field additions and type changes deserve first-class monitoring. Many “mysterious” downstream failures are just untracked schema evolution.
A practical operating model is to define expected behavior for each dataset, then alert on deviations that matter to consumers. Don't monitor everything equally. A finance fact table and a low-stakes clickstream staging table shouldn't carry the same response policy.
Monitor for behavior change, not just pipeline uptime.
That shift is what moves a team from reactive troubleshooting to controlled ingestion health.
Improving Reliability with Data Observability
Manual spot checks don't scale once a platform has more than a handful of sources. Someone can query row counts after a release or inspect a dashboard when a stakeholder complains, but that isn't monitoring. It's lagging diagnosis.
Data observability changes the operating model by watching the behavior of data continuously. Instead of waiting for downstream breakage, the platform inspects ingestion signals such as timeliness, record patterns, missing values, and structural changes as data lands.
Manual checks don't scale
Organizations frequently begin with handcrafted rules. A row-count threshold here, a null check there, maybe a Slack alert when a load is late. That works for a while. Then schemas evolve, sources multiply, and static thresholds become noisy or incomplete.
Modern observability systems improve on that by learning normal patterns and flagging deviations automatically. In-database metric computation allows platforms to learn baselines and detect anomalies by calculating metrics directly inside the customer's database, eliminating manual rule maintenance or external coding, as described in this in-database anomaly detection overview.
That architecture matters. It avoids moving production data out to another system just to measure it.
Why in-database monitoring changes the operating model
In practice, teams want three things from ingestion monitoring:
Continuous visibility into whether data is arriving, changing, and conforming to expectation.
Low operational overhead so engineers aren't maintaining endless brittle rules.
Secure execution inside the customer environment.
A platform such as digna fits that model by combining anomaly detection, timeliness monitoring, record-level validation, and schema tracking with in-database execution. If you want the broader conceptual frame, this overview of data observability is useful because it connects monitoring to reliability instead of treating it as dashboard decoration.
What works in the field is straightforward. Learn the normal heartbeat of each important table. Alert on meaningful deviations. Keep the checks close to the data. Make sure the ingestion owner, not just the dashboard owner, gets the signal first.
That's how teams stop treating ingestion incidents as surprise business events and start handling them as detectable operational conditions.
Practical Best Practices for Robust Ingestion
Reliable ingestion comes from discipline more than cleverness. Most of the painful incidents I've seen were preventable, but only if the team treated ingestion as a product surface instead of a background utility.
A practical checklist helps.
The habits that hold up in production
Validate at the boundary
Check records when they enter the platform. Catch required-field issues, duplicate keys, malformed payloads, and obvious schema problems before they flow into shared tables.Design for both arrival and correctness
Timely bad data is still bad data. Pair freshness monitoring with quality checks so teams don't confuse speed with reliability.Keep staging layers replayable
When a source breaks, replay is often the fastest path to recovery. That only works if raw or near-raw intake is preserved cleanly enough to rerun.Set ownership clearly
Someone must own the source contract, the ingestion job, and the downstream table expectation. Ambiguous ownership is why small ingestion issues turn into long incident calls.Respect source constraints
A lot of ingestion instability starts at the boundary with external systems. If you pull from third-party APIs, build around vendor throttling and quotas from day one. A clear example is the RealtyAPI.io rate limit policy, which shows why retry strategy and backoff logic belong in ingestion design, not as an afterthought.Instrument from day one
Add observability early. Retroactively attaching health checks to a growing platform is always harder than building them into the intake path.
The strongest ingestion pipelines are boring in production because engineers made the boundary strict.
The point isn't to make ingestion heavy. It's to make it trustworthy. When teams understand data ingestion's actual meaning, they stop treating it as a connector problem and start treating it as the control point that protects every report, model, and decision downstream.
If your team wants earlier warning on stale loads, schema changes, and silent data drift, digna is worth evaluating as part of the ingestion layer. It's built for monitoring data quality and observability inside customer-controlled environments, which fits teams that want reliable checks without moving production data out of their own stack.


