Why Teradata Workloads Become Unstable - And How Teams Detect It Early
|
6
min di lettura

Teradata systems are designed for stability. For decades, enterprises have relied on Teradata to deliver predictable, high-performance analytics at scale. In regulated industries such as banking, insurance, telecoms, and the public sector, Teradata remains a critical backbone for decision-making.
Yet even in these mature environments, data teams encounter a familiar problem: workloads that were once stable gradually become unpredictable.
CPU consumption fluctuates. IO usage drifts upward. Long-running jobs consume more resources month after month. Costs increase, not because something is broken, but because something has quietly changed.
Understanding why Teradata workloads become unstable, and how to detect that instability early is essential for maintaining performance, cost efficiency, and operational confidence.
Instability in Teradata Rarely Appears Overnight
Unlike modern cloud platforms, Teradata environments tend to evolve slowly. Changes are deliberate, controlled, and well documented. As a result, instability rarely manifests as a sudden failure.
Instead, it appears as behavioral drift:
Jobs still complete successfully
SLAs are technically met
Dashboards show no obvious red flags
Yet under the surface, workload behavior changes. CPU usage increases slightly. IO patterns become more erratic. Processing windows tighten. Over time, these small deviations accumulate into operational risk.
By the time instability becomes visible, remediation is often expensive and disruptive.
Common Causes of Teradata Workload Instability
1. Data Growth That Alters Execution Plans
Data growth is inevitable, but its impact is rarely linear.
As tables grow:
Join strategies change
Spool usage increases
Redistribution costs rise
AMP workload balance shifts2
Queries that were once efficient begin to consume more CPU and IO even though the SQL itself has not changed. Because growth is gradual, traditional threshold-based alerts rarely trigger early warnings.
2. Slowly Evolving SQL Logic
Teradata workloads are not static.
Over time:
Additional joins are introduced
New attributes are selected
Filters are relaxed
Reporting requirements expand
Each adjustment appears minor, but cumulatively they alter workload characteristics. Jobs run longer, consume more resources, and become less predictable.
Without historical analysis, these changes are often discovered only after users complain or costs rise.
3. Skew and Distribution Changes
Data skew is a well-known challenge in many MPP systems like Teradata.
Skew can emerge due to:
Data migrations
Demographic shifts
Business growth concentrated in specific segments
Changes in data modeling assumptions
As skew increases, workload distribution across AMPs becomes uneven. Certain AMPs consume disproportionate CPU and IO, degrading overall system performance.
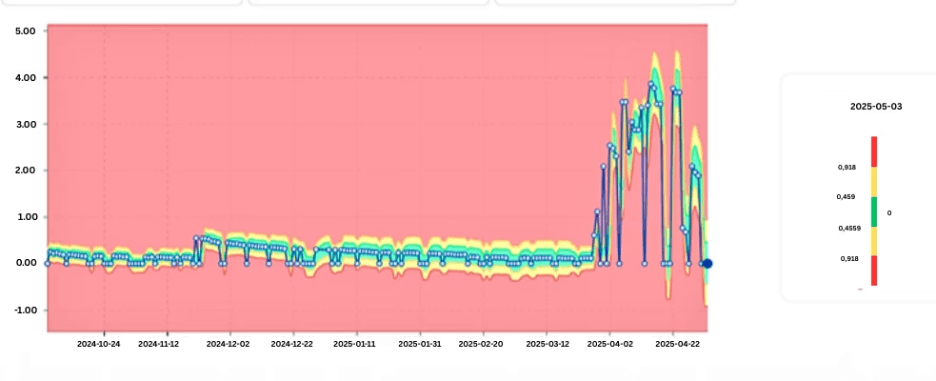
Data Visualization showing AMP-level CPU skew increasing over time.
4. Infrastructure and Configuration Adjustments
Even well-managed Teradata systems evolve.
Changes such as:
Hardware upgrades
Platform reconfiguration
System tuning
Mixed workload prioritization
can subtly influence workload behavior. A job that ran consistently for years may suddenly show increased variance — not due to data issues, but because the execution environment changed.
5. Cyclical and Seasonal Processing
Many Teradata workloads follow predictable cycles:
End-of-month closing
Regulatory reporting
Periodic reconciliations
Without explicitly modeling seasonality, normal cyclical behavior can obscure genuine anomalies or generate unnecessary alerts.
Distinguishing expected variation from real instability requires historical context.
Why Traditional Teradata Monitoring Misses Early Signals
Teradata environments are typically monitored using:
Threshold-based CPU and IO alerts
Query runtime limits
System utilization dashboards
These tools are effective at identifying acute failures, but they struggle with gradual change.
They answer questions such as:
Did CPU exceed a limit?
Did a job fail?
They do not answer:
Is this job becoming more expensive over time?
Is its behavior becoming less stable?
Is today’s workload plausible compared to historical patterns?
Instability lives in these unanswered questions.
The Role of Time-Series Analysis in Teradata Operations
Early detection requires treating workload metrics as time-series signals, not static values.
Key Teradata metrics include:
CPU Time
IO Count
Spool usage
Query runtime
Table growth
When analyzed over time, these metrics reveal:
Long-term trends
Increasing volatility
Structural changes following deployments or migrations
Deviations from seasonal norms
This perspective shifts workload monitoring from reactive troubleshooting to proactive control.
Detecting Instability Before It Becomes a Problem
Learning Normal Workload Behavior
Instead of defining static thresholds, modern approaches observe historical workload behavior and learn what “normal” looks like for each job, query class, or system component.
As patterns stabilize, acceptable ranges become clearer. Deviations from these learned patterns signal potential issues, even if absolute values remain within nominal limits.
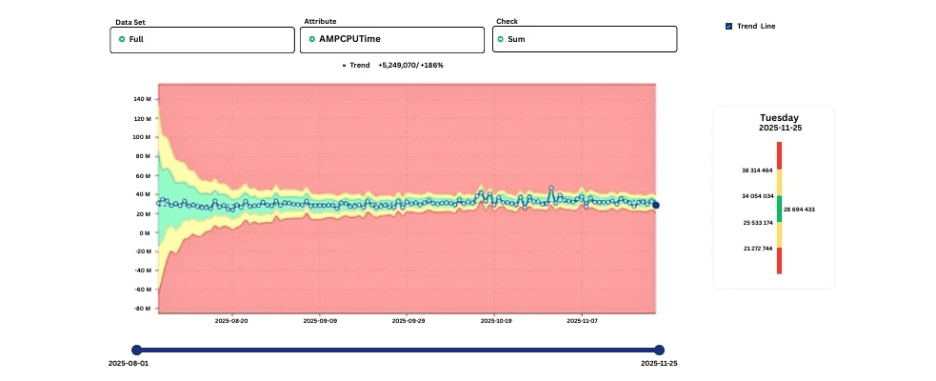
Graph showing learned normal behavior bands with an emerging deviation.
Identifying Gradual Drift
Gradual drift is one of the most costly forms of instability.
By ranking jobs based on:
Absolute CPU increase
Relative change over time
teams can quickly identify which workloads contribute most to rising system load.
This enables targeted optimization rather than blanket tuning exercises.
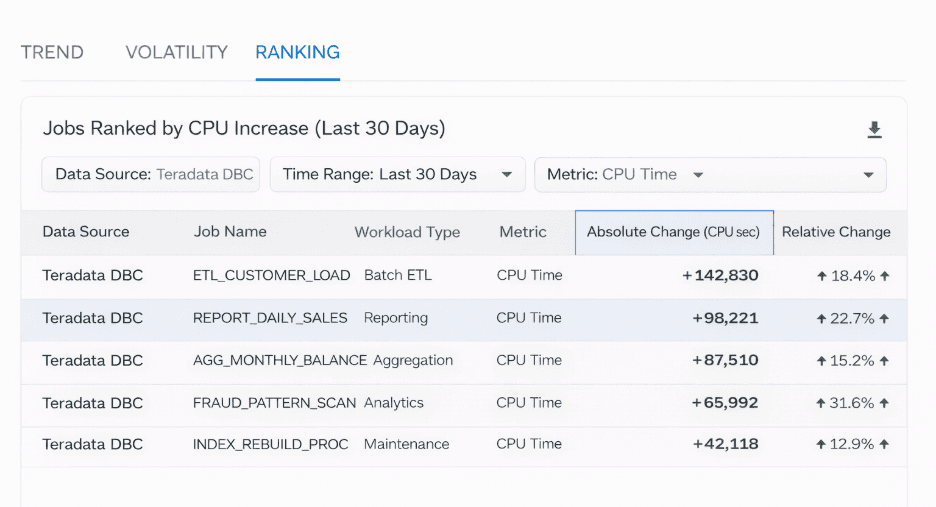
List of jobs ranked by month-over-month CPU increase.
Measuring Volatility
Stability is not only about averages.
Jobs with highly variable CPU or IO consumption are harder to plan for and more likely to cause downstream issues. Measuring volatility highlights workloads that behave unpredictably, even when their mean usage appears acceptable.
Accounting for Seasonality
Effective detection accounts for known cycles.
By learning weekly and monthly patterns, systems avoid false positives while remaining sensitive to deviations that break established behavior.
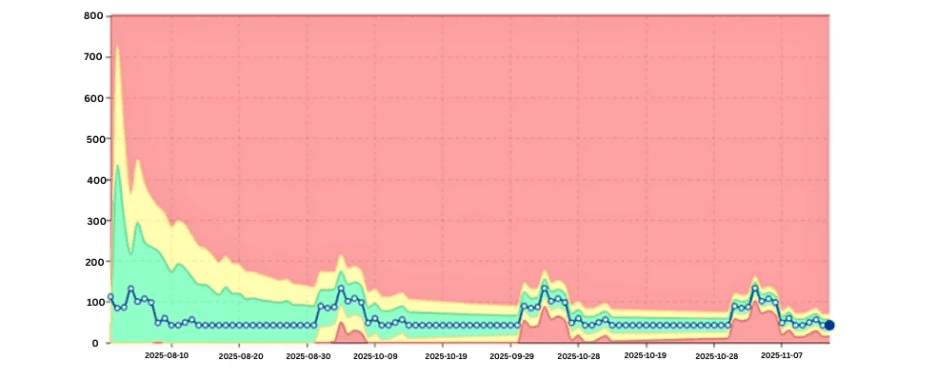
Seasonality-aware CPU trend showing expected end-of-month peaks.
Where digna Fits in Teradata Workload Analysis
Some monitoring approaches rely on exporting metrics into external systems for analysis. Others operate directly within the database environment.
digna reads Teradata system tables (DBC) while allowing customers to define how it accesses these metadata sources, after which workload metrics are converted into time-series data. Using AI-based models, it learns normal behavior and detects deviations that are statistically implausible, whether sudden spikes or slow drift.
Because digna focuses on behavior rather than static thresholds, it helps teams detect instability early, before it escalates into performance or cost issues.
An overview of this anomaly-driven approach is available here or you can book a demo with them.
Operational Benefits of Early Detection
Organizations that detect Teradata workload instability early experience measurable benefits:
Lower CPU and IO consumption through timely optimization
Improved cost predictability
Reduced escalation meetings
Better collaboration between platform and business teams
Greater confidence in analytics outputs
Most importantly, stability becomes manageable rather than reactive.
Looking Ahead: Stability as an Operational Discipline
As Teradata continues to support mission-critical analytics and AI workloads, stability becomes a strategic concern.
Silent workload drift undermines trust, increases cost, and raises operational risk. Detecting instability early requires:
Time-series analysis
Behavioral learning
Context-aware alerting
Minimal operational overhead
In this sense, workload stability is no longer just a performance metric, it is a core element of enterprise data reliability.
Final Thoughts
Teradata workloads do not become unstable overnight. Instability emerges gradually, driven by data growth, logic changes, and evolving system conditions.
Teams that rely solely on static monitoring detect problems too late. Those that analyze workload behavior over time can intervene early, preserving both performance and predictability.
As Teradata environments continue to evolve, early detection of workload instability will define operational maturity.
See how digna does this in practice: data quality monitoring for Teradata.
Frequently asked questions
Why do Teradata workloads become unstable?
Instability builds gradually rather than appearing overnight. The usual causes are data growth that changes execution plans, SQL logic that evolves release by release, skew and distribution changes, infrastructure or configuration adjustments, and cyclical processing peaks.
What are the early signals of Teradata instability?
Small, consistent shifts: a step up in AMPCPUTime for the same query, rising IO on an unchanged workload, growing skew, or a job that finishes a few minutes later each night. Individually they look like noise, which is why they are usually missed.
Why does traditional Teradata monitoring miss these signals?
Threshold-based monitoring only fires once a metric crosses a fixed line. A workload can degrade for weeks inside the threshold and still be technically compliant, so the alert arrives only when the damage is already visible.
How does time-series analysis help with Teradata operations?
Treating each metric as a series rather than a snapshot lets you compare today against the behaviour that is normal for that workload, including weekly and monthly cycles, so a gradual drift becomes visible while there is still time to act.
Can workload instability affect data quality?
Yes, indirectly. Jobs that run longer push loads toward the reporting window, and a delayed or partially completed load means reports run on data that is incomplete or out of date.



