The 9 Types of Data Pipeline: Choose the Best for 2026
|
10
min di lettura

Beyond ETL: Choosing the Right Data Pipeline Architecture
Your dashboards are stale. Your ML models are drifting. Your stakeholders are losing trust in the data. These are common symptoms of an architectural mismatch, a data pipeline that can no longer keep pace with business demands. Choosing the right pipeline isn't just a technical decision. It's a strategic one that affects freshness, reliability, operating effort, and how much confidence people place in every metric they use.
Pipelines rarely fail due to an inadequate tool choice. Instead, failure stems from pairing the wrong architecture with the job. A nightly warehouse load can't support fraud prevention. A streaming stack is overkill for weekly finance reconciliation. This guide focuses on the operational reality behind the main types of data pipeline, including where each pattern breaks, what teams usually underestimate, and how to make each one observable from day one.
If you're building your team while sorting out that architecture, this guide for data engineer roles in LATAM is useful context for the kinds of skills these systems demand.
Table of Contents
1. Batch Processing Pipelines
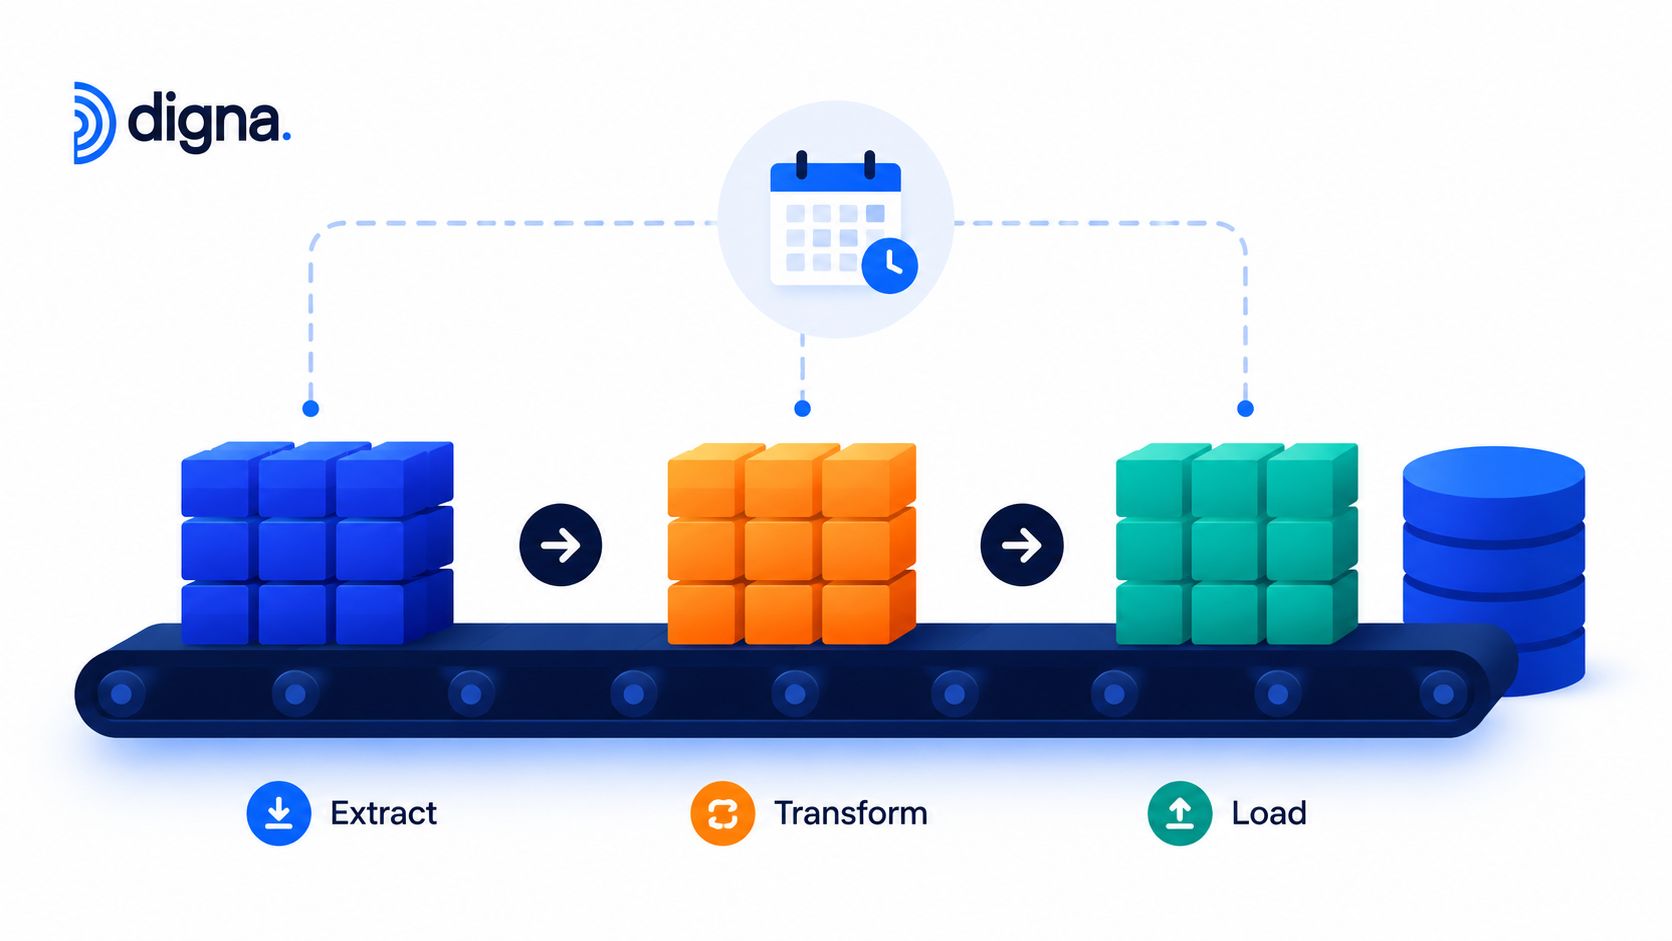
Batch pipelines are still the backbone of enterprise analytics. IBM notes that batch processing pipelines remain the dominant architecture for traditional analytics and historical decision-making, and they process data on fixed schedules such as hourly, daily, or weekly intervals while serving reporting, billing, and large-scale historical analysis through longstanding ETL patterns in enterprise warehouses and marts (IBM on data pipeline architectures).
That aligns with common production observations. Nightly Snowflake warehouse loads, daily customer segmentation in marketing systems, weekly retail inventory reconciliation, and end-of-day finance reporting all fit batch well. If the business decision happens tomorrow morning, not in the next few seconds, batch is often the simpler and cheaper design.
For teams designing the foundation, a clear data pipeline architecture reference from digna helps frame where batch belongs and where it doesn't.
Where batch still wins
Batch gives you clear checkpoints. You know when a run starts, when it finishes, and which partition or file set it touched. That structure makes backfills, reconciliation, and audit conversations much easier than in always-on systems.
It also works well when business rules are heavy. If you're normalizing finance data across multiple ledgers or computing warehouse-grade dimensional models, it's often better to process a complete slice than to chase event-by-event correctness.
Practical rule: If the consumer asks for trustworthy historical completeness rather than immediate reaction, batch is usually the better default.
What usually goes wrong
The main failure mode isn't that batch is old. It's that teams monitor infrastructure instead of data. The Airflow DAG may succeed while a source table arrives late, a file lands empty, or a new column subtly breaks a downstream model.
Use digna Timeliness to detect delayed or missing batches before a dashboard goes stale. Use digna Data Validation to enforce record-level business rules during loads, and Schema Tracker to catch column or type changes before they cascade into BI failures. I also recommend segmenting batches by logical domain so one bad marketing extract doesn't block payroll or finance recovery.
2. Real-Time Streaming Pipelines
Streaming is what teams reach for when data freshness affects action, not just analysis. Hevo describes streaming pipelines as continuous ingestion systems that update metrics, reports, and summary statistics within seconds or even milliseconds, making them critical for fraud detection, live dashboards, recommendation engines, and other time-sensitive workloads in sectors like finance and telecom (Hevo on batch vs streaming pipeline types).
That sounds attractive, but the key question is whether you need that speed badly enough to pay for the complexity. Payment monitoring, IoT alerts, live inventory visibility, and clickstream-driven product recommendations usually justify it. A weekly commercial KPI report doesn't.
What streaming is really buying you
Streaming shortens the gap between event creation and decision. Stripe-style payment checks, Kinesis-fed logistics updates, or Kafka-backed operational dashboards all depend on that property.
The architecture also changes behavior inside the business. Operations teams stop waiting for yesterday's summary and start responding to what is happening right now.
The operational pain points
Streaming systems fail differently from batch. You don't just get "job failed." You get lagging consumers, out-of-order events, duplicates, late-arriving records, and schema drift in a topic that many downstream services depend on.
A practical setup with digna looks like this:
Detect rate shifts early: digna Data Anomalies can learn normal event behavior and surface unexpected drops or spikes without constant threshold tuning.
Watch freshness continuously: digna's in-database metric computation is useful for tracking lag and freshness signals that operators need every day.
Protect against topic evolution: digna Schema Tracker helps catch event schema changes before they break stream transformations or serving layers.
Streaming systems don't usually fail loudly first. They degrade quietly, then someone notices the dashboard no longer matches reality.
If your stream contains sensitive operational events, private cloud deployment matters. Teams in finance, healthcare, and telecom often need observability inside their own environment, not as a data copy sent elsewhere.
3. Lambda Architecture
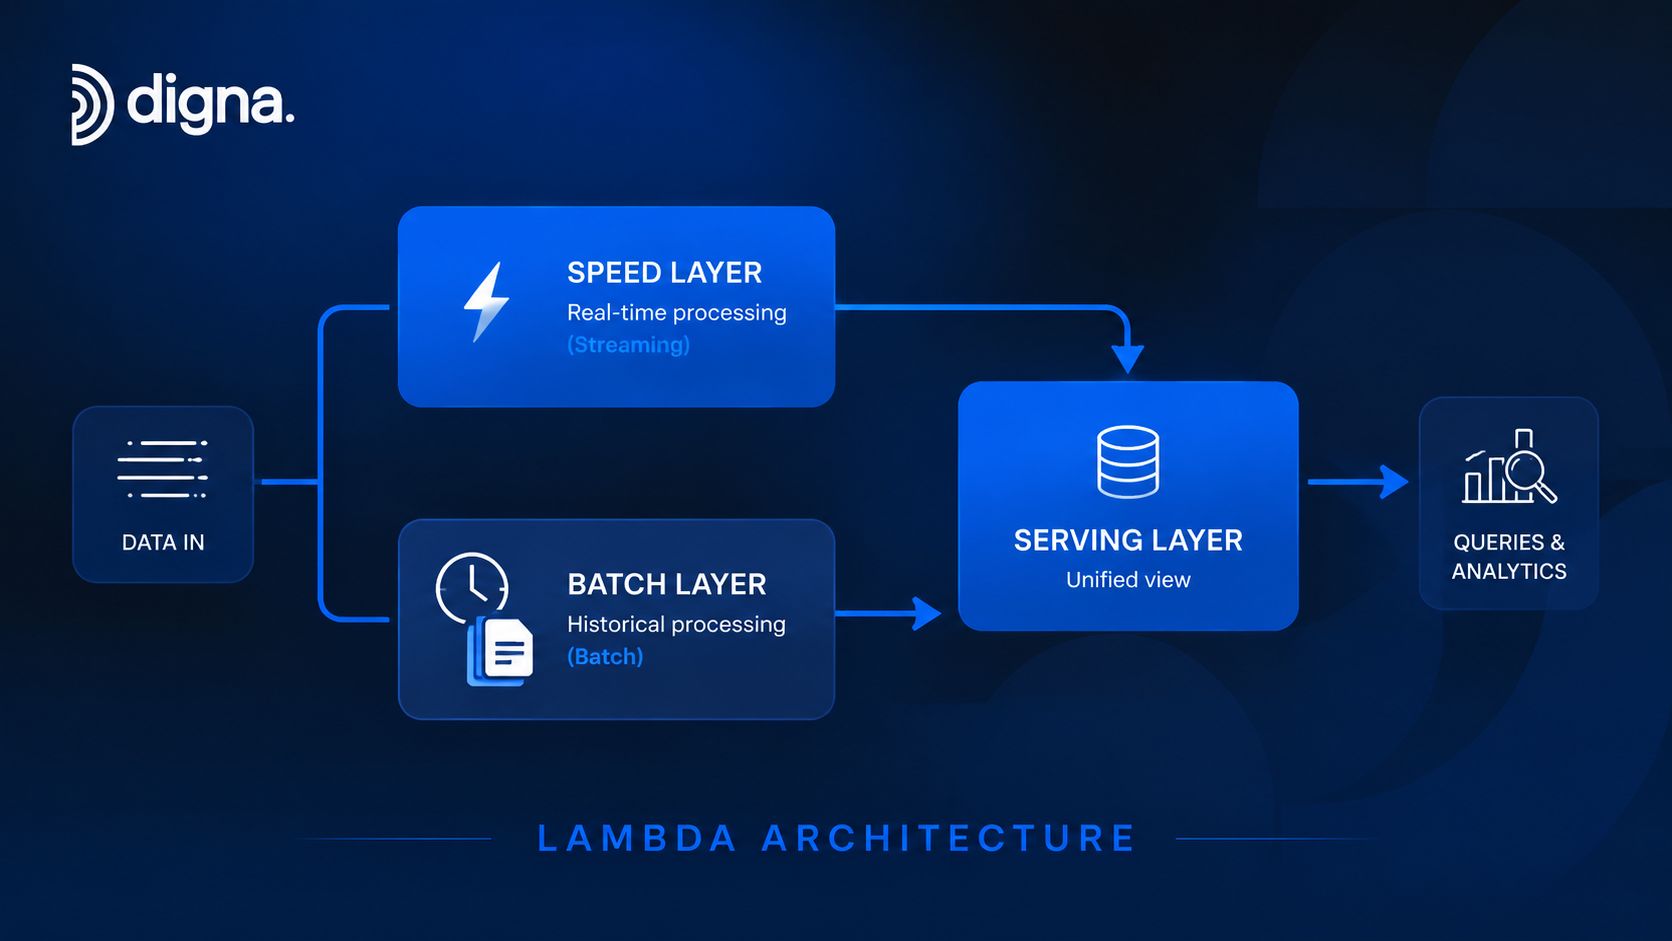
Lambda architecture exists because some organizations need two things at once. They need fast answers now and accurate answers later. So they combine a streaming speed layer with a batch layer that recomputes full truth, then merge both into a serving layer.
This pattern still shows up in risk analytics, recommendation systems, and large analytics platforms where intraday numbers can be approximate but end-of-day numbers must be corrected. The appeal is obvious. You don't have to choose between latency and completeness.
Why teams choose lambda
Lambda is useful when the business can tolerate a temporary approximation but won't accept permanent inconsistency. A risk desk may need intraday exposure estimates immediately, then rely on a fuller batch recomputation for official reporting. An e-commerce team may push live behavioral updates while retraining or recalculating broader recommendation signals in batch.
That split can reduce pressure on any single engine. The streaming path handles immediacy. The batch path handles the heavy historical truth.
Where lambda becomes expensive
The hidden cost is duplicate logic. Teams often end up implementing similar business rules twice, then discovering that "close enough" in the speed layer doesn't match "correct" in the batch layer. Once those outputs diverge, trust erodes fast.
Use digna to compare outputs from both paths, not just whether each path is green on its own. Schema Tracker should watch both layers because drift in either one creates subtle mismatches. Data Validation also belongs in both flows so key rules around currencies, identifiers, status values, or ledger semantics don't fork over time.
A good lambda setup treats divergence as a first-class signal. digna Data Analytics is useful here because it helps operators inspect where streaming approximations consistently differ from later batch corrections.
4. Kappa Architecture
Kappa strips lambda down to one processing model. Everything is a stream. New events flow through the same stream processor, and if you need to reprocess history, you replay the log through the same logic instead of maintaining a separate batch layer.
Engineers like this because the code path is simpler. Kafka with Kafka Streams or Flink is the usual shape. Mobile telemetry, event-driven SaaS platforms, and IoT systems often fit it well when the event log is durable and replay is realistic.
Why engineers like kappa
The biggest advantage is consistency. One transformation path means fewer chances for business logic to drift. If you trust your event log, replay becomes your recovery and backfill strategy.
This works especially well in organizations that already think in events. Product analytics, user interaction streams, and microservice activity feeds are often easier to manage in a kappa model than in a split batch-plus-streaming design.
What can break replay-based systems
Replay sounds clean until you hit operational reality. Historic events may no longer match the current schema. Downstream consumers may not be idempotent. Reprocessing can flood systems that were sized only for live traffic.
digna helps most when you treat replay as an observable operating mode, not a rare emergency. Set timeliness baselines for both live flow and replay windows. Use Schema Tracker on the event log before a version change turns historical reprocessing into a failure cascade. Apply the same Data Validation rules to replayed events that you apply to live ones, or you'll certify one path and inadvertently weaken the other.
Reprocessing isn't just "run it again." It's a separate reliability scenario that needs its own expectations.
5. Change Data Capture Pipelines
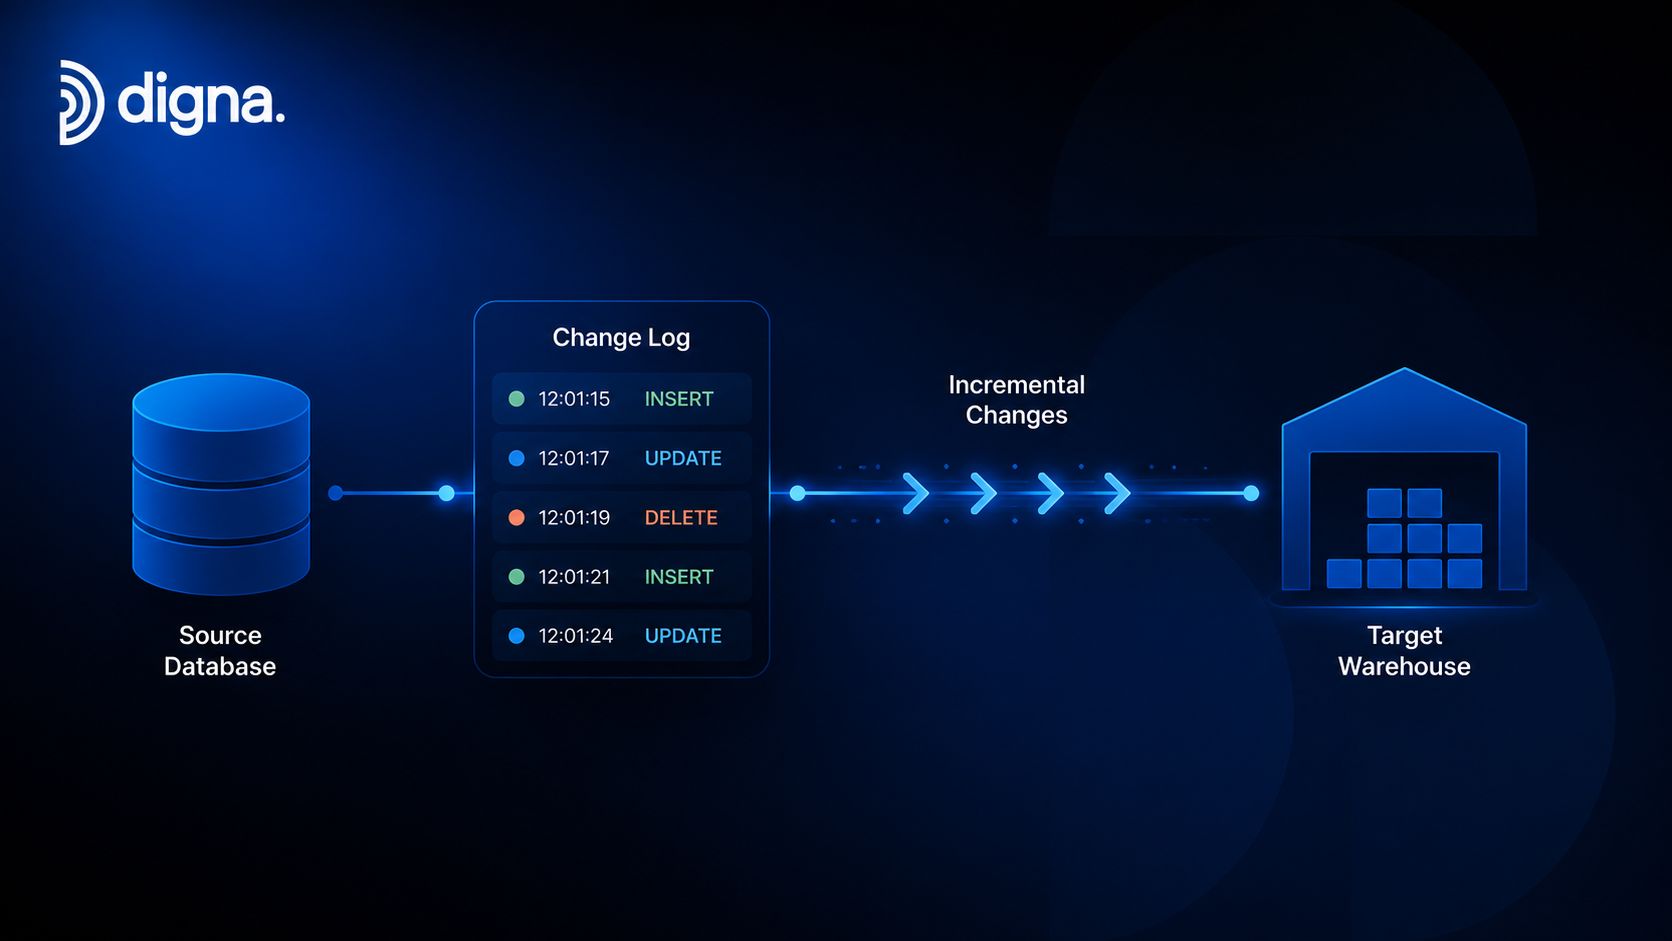
CDC pipelines move only what changed. Instead of scanning full tables every run, they capture inserts, updates, and deletes from operational databases and propagate those changes downstream. Debezium, AWS DMS, and native replication mechanisms are common choices.
This is one of the most practical types of data pipeline because it reduces unnecessary recomputation and supports lower-latency synchronization between systems. Reporting marts, cloud warehouse syncs, and operational analytics often get much better results from CDC than from repeated full extracts.
Why CDC is growing fast
Research and Markets projects CDC pipelines to be the second-fastest growing segment among data pipeline types, with a projected CAGR of 18% to 20% through 2030 as enterprises push toward low-latency synchronization for use cases like inventory and ledger updates without full table recomputation (Research and Markets on pipeline tool segments).
That growth makes sense. Full-table loads are wasteful when only a small slice changed, and they're operationally risky when source systems are sensitive to extraction load.
The hard part isn't capture
The hard part is preserving meaning. Deletes must remain visible downstream. Update ordering must stay correct. Primary key mutations and schema changes can create duplicates or orphaned records if the pipeline treats them as simple append events.
A strong CDC operating model includes:
Validate deletes explicitly: digna Data Validation can confirm that downstream systems represent deletions the way your consumers expect.
Measure replication lag: digna Timeliness helps operators see when source changes are arriving too slowly to support the business process.
Track source evolution: digna Schema Tracker is important for CDC because source database changes often arrive outside the control of the analytics team.
Suspicious deletion bursts or abnormal update patterns are also worth flagging with digna Data Anomalies. In production, those patterns often reveal application bugs before developers notice them.
6. Data Virtualization Pipelines
Not every pipeline has to move data physically. Data virtualization creates a logical layer that presents a unified view across multiple systems while leaving the data in place. Denodo, federated warehouse queries, Snowflake external tables, and BigQuery federation are familiar examples.
This pattern is useful when copying data is slow, politically difficult, or restricted by governance. Healthcare organizations may need a unified patient view across hospital systems. Financial institutions may need a cross-platform customer view without forcing every legacy source into one warehouse first.
When virtualization is the right call
Virtualization works well when access matters more than heavy transformation. It gives teams a common semantic interface quickly, and it can support domain autonomy when central consolidation would take too long or trigger ownership fights.
It also reduces data movement. That's attractive when systems are large, regulated, or frequently changing.
Where virtual layers fail in practice
The biggest mistake is pretending the virtual layer removes source-system problems. It doesn't. It exposes them faster. If one source is late, slow, or structurally inconsistent, the federated result inherits that weakness.
For that reason, quality monitoring has to start at the source edge, not only at the semantic layer. digna in a private cloud setup is useful here because teams can monitor quality and schema change across federated sources without moving sensitive records. Timeliness monitoring also helps identify which source is degrading query performance or freshness before the virtualized output becomes unusable.
A virtual layer can unify access. It can't unify reliability unless you observe each source separately.
7. Event Streaming with Event Sourcing
Event sourcing changes the idea of system record. Instead of storing only current state, the system stores every state change as an immutable event. Subscribers then build projections, materialized views, and downstream read models from that history.
That makes this architecture attractive for order management, banking audit trails, ride lifecycle tracking, and CQRS systems where temporal history matters as much as present state. If someone asks, "What did we know at that moment?" event sourcing can answer cleanly.
What you gain from immutable events
Auditability is the headline benefit, but the practical gain is reconstructability. Teams can rebuild projections, inspect transitions, and understand exactly which events produced a final state.
That matters in regulated environments and in complex transactional systems. When an order moves from placed to packed to shipped to refunded, every transition carries operational meaning.
Why observability matters more here
An event-sourced system is unforgiving about malformed events. If a bad event enters the log, downstream projections may all interpret it differently or fail in different places. Versioning is also difficult because old and new consumers may coexist for a long time.
Use digna Data Validation to enforce event structure and required fields before damage spreads through subscriber chains. Use Timeliness to detect lagging subscribers, and Schema Tracker to monitor event version transitions so producers don't break older projections without warning. Data Anomalies is also useful for catching suspicious event sequences that may indicate fraud, abuse, or application bugs.
In these systems, "pipeline quality" and "application correctness" overlap. That's why generic infrastructure monitoring isn't enough.
8. Data Mesh with Decentralized Pipelines
Data mesh is less a single pipeline pattern than an operating model for many pipelines. Domain teams own their data products and the pipelines behind them, while a governance layer sets shared standards for discoverability, quality, contracts, and access.
This approach appeals to large organizations where one central data platform team has become a bottleneck. Product, finance, risk, marketing, and operations teams can move faster when they own their own data output.
What decentralization fixes
It fixes local context loss. The domain team usually understands the meaning of cancellations, active users, policy renewals, or failed payments better than a distant central team does. That improves modeling decisions and response time when something changes.
It also scales delivery. You don't have one central backlog for every extraction, schema update, and consumer request.
A deeper look at data mesh architecture and its modern impact is useful if your organization is shifting from centralized ownership.
What turns data mesh into chaos
Without shared observability, data mesh becomes a collection of isolated failures. One team defines freshness one way, another team ignores schema contracts, and consumers get five different quality standards depending on which domain they query.
digna works well here as the unifying layer. Each domain can keep autonomy over its pipelines while using the same Data Validation patterns, the same Timeliness framework, and the same Schema Tracker discipline. Private cloud or on-prem deployment also matters because decentralized teams often work across sensitive business areas that can't send production data outside controlled environments.
The point isn't centralizing ownership again. It's standardizing reliability without flattening domain expertise.
9. Machine Learning Feature Pipelines
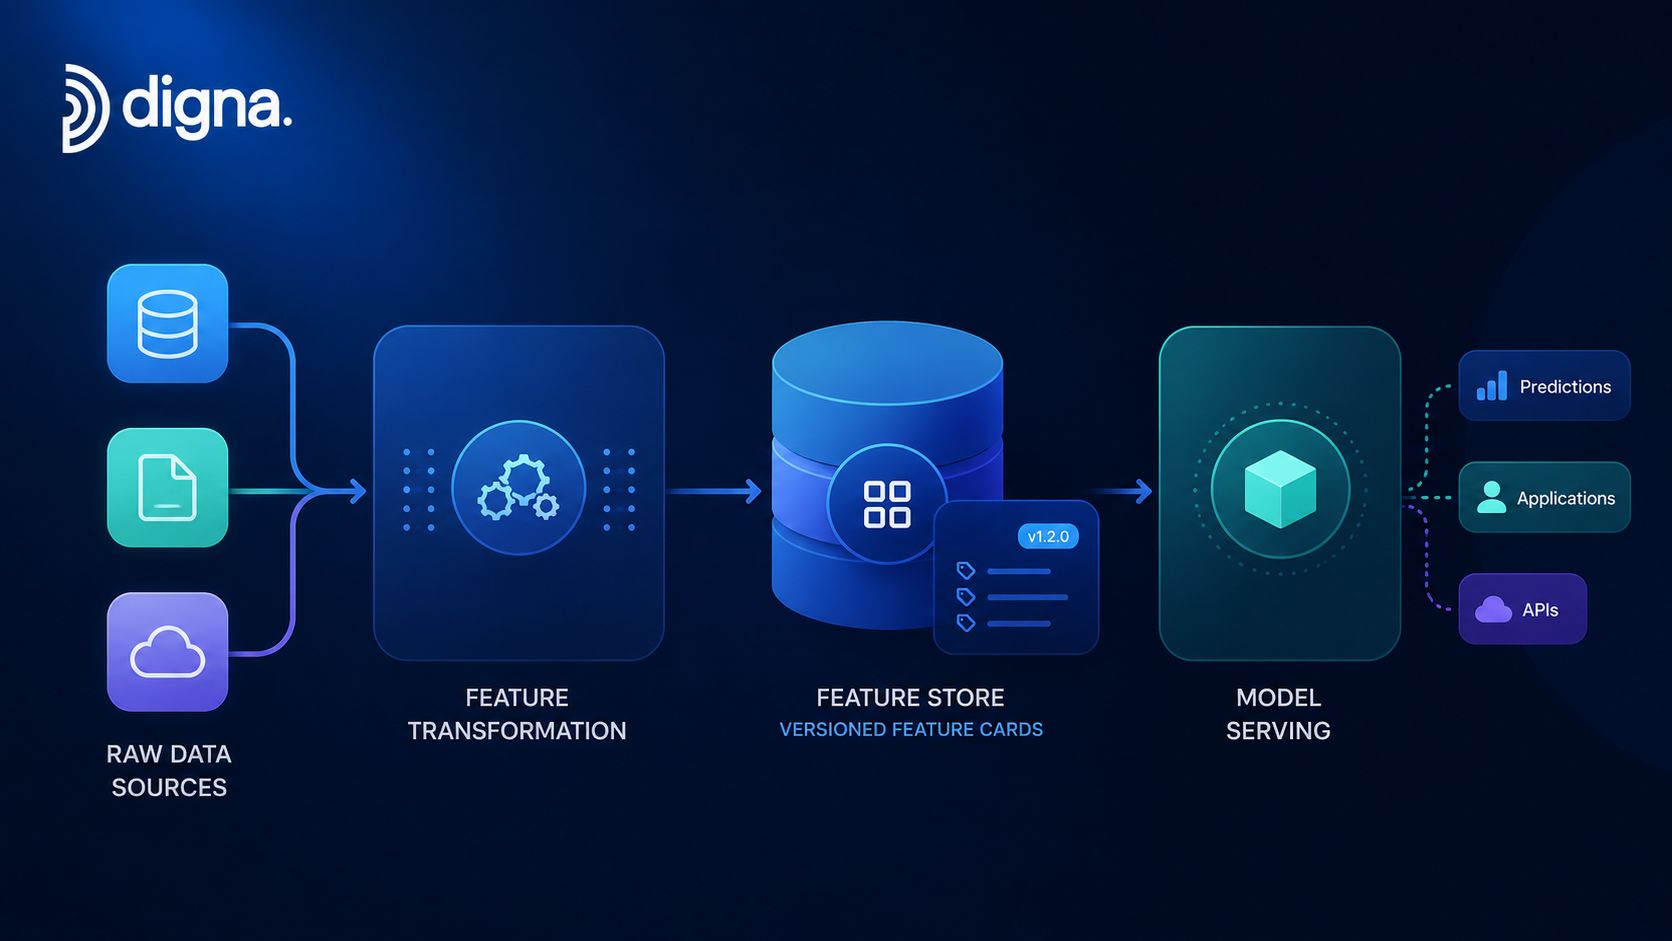
Feature pipelines sit between data engineering and ML operations. They compute, version, store, and serve the engineered inputs that models use for training and inference. Feast, Databricks Feature Store, and Tecton are common examples.
They look similar to other types of data pipeline from a distance, but the operational standard is higher. A dashboard can tolerate a stale metric for a while. A production model can degrade unnoticed if feature freshness, null handling, or value distribution shifts and nobody catches it.
Why feature pipelines are different
They have two consumers with different needs. Training systems need reproducibility and historical consistency. Online inference needs current values and low serving latency.
The architecture also changes depending on the transformation approach. GII Research notes that ELT has significantly overtaken traditional ETL in cloud-native environments because scalable warehouse compute enables post-load transformation efficiently, while ETL remains dominant where strict pre-load cleansing and schema enforcement are required, and cloud-based deployment is the dominant mode with hybrid approaches using serverless processes such as AWS Glue and Azure Data Factory becoming standard for organizations balancing scale and legacy integration (GII Research on deployment and ETL versus ELT).
The failure mode teams notice too late
The common mistake is monitoring the model while ignoring the feature pipeline. By the time model performance slips, the underlying feature issue may have been present for days.
A practical observability setup includes:
Watch drift-like behavior in inputs: digna Data Anomalies can flag unexpected changes in feature distributions before they show up as poor model outputs.
Monitor serving freshness: digna Timeliness helps catch stale features before the online store serves outdated values.
Track structural changes: digna Schema Tracker is useful when feature definitions evolve, columns appear or disappear, or transformation outputs change shape.
Feature pipelines also need hard business constraints. If a price-derived feature becomes negative or a category field arrives empty, Data Validation should stop the issue at the pipeline boundary. For teams building customer-facing personalization systems, this matters as much as model selection itself. That same operational discipline also affects adjacent systems that shape experience, including efforts around optimizing e-commerce visuals with AI.
9-Way Data Pipeline Comparison
Pipeline / Architecture | Implementation Complexity 🔄 | Resource Requirements & Operational Overhead ⚡ | Expected Outcomes (Freshness / Accuracy) ⭐📊 | Ideal Use Cases 📊 | Key Advantages & Quick Tip 💡 |
|---|---|---|---|---|---|
Batch Processing Pipelines | Low → Moderate (scheduled jobs, simpler ops) 🔄 | Efficient for large volumes; peak resource contention during windows ⚡ | High accuracy ⭐⭐⭐, high latency (hours→days) 📊 | Nightly reporting, large-scale ETL, periodic analytics | Proven reliability; tip: monitor timeliness to catch missed windows 💡 |
Real-Time Streaming Pipelines | High (distributed stream processors & brokers) 🔄 | High continuous compute & ops costs; requires specialized staff ⚡ | Very low latency, near-real-time freshness ⭐⭐📊 (accuracy depends on guarantees) | Fraud detection, operational dashboards, live analytics | Enables instant detection; tip: use anomaly detection for streaming patterns 💡 |
Lambda Architecture | Very High (dual code paths + serving layer) 🔄 | Very high (maintain batch + streaming infra) ⚡ | Low-latency approximations + accurate batch corrections ⭐⭐⭐📊 | Workloads needing both immediate view and exact historical recompute | Combines speed and accuracy; tip: validate consistency between layers with monitoring 💡 |
Kappa Architecture | High (streaming-only, replay capability) 🔄 | High (broker storage for history and reprocessing peaks) ⚡ | Consistent logic, real-time freshness; reprocessing possible ⭐⭐📊 | Event-driven systems where stream can handle reprocess (Kafka/Flink) | Operational simplicity vs lambda; tip: ensure event log retention and monitor replays 💡 |
Change Data Capture (CDC) Pipelines | Moderate → High (log access, mapping) 🔄 | Low network transfer; moderate infra for processing and ordering ⚡ | Low-latency incremental updates, high fidelity ⭐⭐⭐📊 | Incremental syncs, real-time warehouses, reporting marts | Minimizes data movement; tip: track schema changes and deletion handling carefully 💡 |
Data Virtualization Pipelines | Moderate (semantic layer & connectors) 🔄 | Low storage but runtime depends on source performance; variable costs ⚡ | Real-time freshness but variable query performance ⭐⭐📊 | Ad-hoc analytics, federated queries, quick governance demos | Fast to deploy with minimal movement; tip: monitor source SLAs and join performance 💡 |
Event Streaming with Event Sourcing | High (immutable log, projections, versioning) 🔄 | High storage for full history; operational complexity for projections ⚡ | Full auditability and reconstructability, temporal analysis ⭐⭐⭐📊 | Audit trails, CQRS, systems needing full history and replay | Excellent for compliance & debugging; tip: validate event schemas and arrival timeliness 💡 |
Data Mesh with Decentralized Pipelines | High (organizational + technical complexity) 🔄 | Higher total infra across domains; federated tooling costs ⚡ | Domain-aligned, scalable outcomes; quality varies by domain ⭐⭐📊 | Large organizations seeking domain autonomy and productized data | Scales via autonomy; tip: enforce federated observability and common contracts 💡 |
Machine Learning Feature Pipelines | High (feature versioning, point-in-time correctness) 🔄 | Moderate→High storage & compute; feature store ops ⚡ | Consistent train/serve features, reduces model drift ⭐⭐⭐📊 | Feature stores, model serving, reproducible ML workflows | Improves ML reliability; tip: monitor feature freshness and drift continuously 💡 |
From Architecture to Operation Making Your Pipeline Reliable
Choosing the right architecture is the first important decision. It isn't the final one. Batch, streaming, CDC, event-sourced, and ML-focused pipelines all solve different delivery problems, but each architecture also introduces its own quality and reliability risks.
Batch pipelines hide lateness until a scheduled run misses its window. Streaming systems stay alive while imperceptibly drifting away from expected behavior. Lambda creates consistency problems between paths. Kappa makes replay correctness a first-class concern. CDC can replicate changes quickly while still mishandling deletes or update order. Virtualization can unify access while masking weakness in underlying systems. Data mesh can increase domain speed while fragmenting standards. Feature pipelines can keep serving data long after model inputs have gone bad.
That operational reality is why architecture diagrams aren't enough. Every production pipeline needs a control layer that tells you whether the data is arriving on time, whether the records still satisfy business rules, whether schemas changed, and whether patterns in the data still look normal. If you only watch jobs, containers, or warehouse spend, you'll miss the failures that damage trust.
The strongest teams build observability and validation into the pipeline from day one. They don't wait for the first executive dashboard failure or the first model incident. They define expected arrival behavior. They track schema changes before downstream systems break. They validate key records at the point of movement, not after analysts file tickets. They inspect anomalies in context instead of relying only on brittle hand-tuned thresholds.
That's where digna fits well across all the major types of data pipeline. Its combination of Timeliness, Data Validation, Schema Tracker, Data Anomalies, and Data Analytics addresses failure patterns engineers deal with in practice. Because it computes metrics inside the customer's database and supports private cloud or on-prem deployment, teams can monitor sensitive environments without handing production data to an external vendor.
There's also a strategic benefit. When stakeholders can trust that freshness, structure, and record validity are actively monitored, architecture discussions get better. Teams stop debating pipeline styles in the abstract and start choosing the design that matches the business need, with a clear plan for how they'll operate it safely.
Reliable data pipelines aren't just about moving data from point A to point B. They are about delivering data that people can act on without second-guessing it. That's the standard worth designing for.
If you want that level of control across batch, streaming, CDC, feature pipelines, and decentralized data products, digna is built for it. It gives data teams one platform for anomaly detection, record-level validation, timeliness monitoring, schema change tracking, and historical observability analysis, all while keeping data inside customer-controlled environments.
Batch runs that miss their window and CDC feeds with growing replication lag share one symptom, data arriving later than the business expects, which is what digna Timeliness learns and alerts on.
Frequently asked questions
What are the main types of data pipeline?
The article covers nine: batch processing, real-time streaming, lambda, kappa, change data capture, data virtualization, event streaming with event sourcing, data mesh with decentralized pipelines, and machine learning feature pipelines. Each solves a different delivery problem, and each brings its own quality and reliability risks that need monitoring from day one.
When should I use batch processing instead of streaming?
Choose batch when the business decision happens tomorrow morning rather than in the next few seconds. Nightly Snowflake warehouse loads, weekly retail inventory reconciliation and end-of-day finance reporting fit batch well, while fraud detection, IoT alerts and live dashboards usually justify the extra cost and complexity of streaming.
What is the difference between lambda and kappa architecture?
Lambda runs two paths, a streaming speed layer for fast approximate answers and a batch layer that recomputes full truth, merged in a serving layer. Kappa treats everything as a stream and reprocesses history by replaying the event log through the same logic, typically with Kafka and Kafka Streams or Flink.
What usually goes wrong with change data capture pipelines?
Capture is rarely the problem; preserving meaning is. Deletes must stay visible downstream, update ordering must remain correct, and primary key mutations or schema changes can create duplicates or orphaned records when treated as simple appends. Research and Markets projects CDC pipelines to grow at an 18% to 20% CAGR through 2030.
How do you monitor machine learning feature pipelines?
Monitor the feature pipeline itself, not only the model, because feature issues can sit unnoticed for days before performance slips. The article recommends watching feature distributions for drift, checking serving freshness so the online store never serves stale values, tracking schema changes, and validating hard constraints such as non-negative price features.



