Machine Learning Anomaly Detection: A Practical Guide
|
10
min di lettura

Your revenue dashboard looks fine at 9:00. By 11:30, finance is questioning the weekly forecast, sales leaders are pushing back on pipeline numbers, and no one can point to a system outage. The problem isn't a broken warehouse job. It's a quiet shift upstream. A source table started duplicating records, a timestamp arrived late, or a column's value distribution drifted just enough to poison downstream logic without tripping any hard-coded alert.
That's the kind of failure machine learning anomaly detection is built for. Not loud incidents. Silent ones. The ones that pass basic validation, land in trusted tables, and slowly erode confidence in every report and model that depends on them.
Many teams don't struggle because they lack alerts. They struggle because old threshold-based monitoring can't keep up with high-dimensional data, changing seasonality, evolving pipelines, and enterprise constraints around privacy and deployment. Modern anomaly detection works when it learns normal behavior continuously, runs close to the data, and fits into observability workflows that operations teams can maintain.
Table of Contents
When Silent Data Errors Cause Loud Problems
A common failure pattern starts with a business user trusting data that is technically present but behaviorally wrong. Sales forecasts jump. Customer churn appears to improve overnight. An ML feature store picks up skewed values and changes model outputs. Nobody sees a crash, because nothing crashed.
Rule-based checks usually catch obvious failures. Null spikes. Missing files. Row counts that drop to zero. They struggle when the problem is subtler, like a source sending duplicated records, a distribution shifting inside an accepted range, or correlated fields drifting together in a way no static rule anticipated.
That gap matters in real operations. Machine learning-based anomaly detection methods outperform traditional statistical approaches by 8 to 12% in accuracy, with some implementations achieving up to 15% higher precision in detecting complex, multivariate anomalies, especially in high-dimensional settings such as financial transaction monitoring and industrial equipment failure prediction, according to this anomaly detection research summary.
Why older monitoring breaks down
Traditional monitoring assumes teams can define failure ahead of time. In practice, they can't.
Business logic changes: New campaigns, pricing changes, territory realignments, and product launches alter data behavior faster than alert rules get updated.
Pipelines get layered: A single KPI might depend on ingestion jobs, dbt models, reverse ETL syncs, and third-party APIs.
Anomalies hide in relationships: Each column may look normal on its own while the combined pattern is clearly wrong.
Practical rule: If your team learns about data issues from a dashboard consumer instead of from monitoring, your detection logic is too brittle.
Teams trying to modernize these workflows often start by fixing the ingestion and transformation layer first. That's why resources like Osher Digital's data processing solutions are useful context. Reliable processing reduces preventable failures, but it doesn't replace anomaly detection. You still need a system that can spot unknown unknowns after the data starts flowing.
What machine learning changes
Machine learning anomaly detection changes the job from writing rules to learning baselines. Instead of asking an engineer to define every bad state in advance, the system models expected behavior and flags meaningful deviations.
That shift is operational, not academic. It protects forecasting, finance reporting, compliance workflows, fraud monitoring, and model inputs from the kind of quiet drift that causes the most expensive arguments in enterprise data teams.
Understanding the Anatomy of an Anomaly
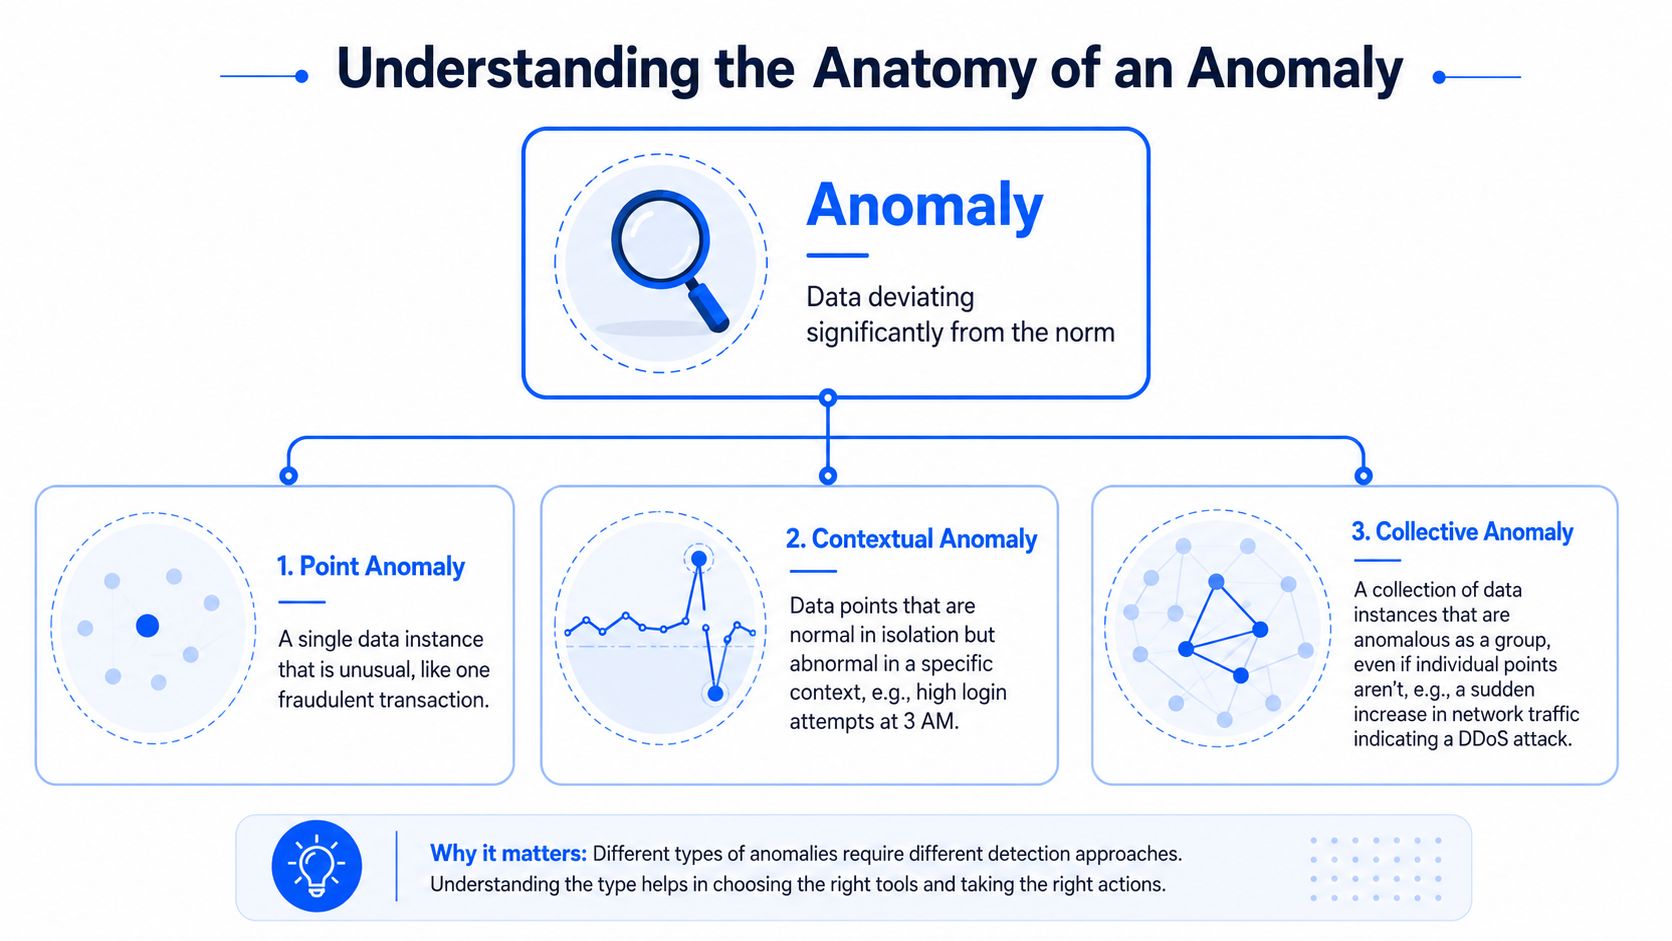
An anomaly is data that deviates from expected behavior. The useful part isn't the definition. It's knowing what kind of deviation you're looking at, because detection methods fail when teams treat every anomaly as the same problem.
Point anomalies
A point anomaly is the easiest one to picture. One event, one value, one row looks wrong. Think of a single card transaction that is far outside a customer's normal pattern, or one warehouse load with an impossible record count.
These are the cases typically designed for first because they map cleanly to alerts. A value is too high, too low, too early, too late, or too far from the norm.
Contextual anomalies
A contextual anomaly looks fine until you consider timing, seasonality, or surrounding conditions. High login volume at noon might be normal. The same volume at 3 AM from a sensitive internal system may be a serious signal.
Data platforms see this often. A late-arriving file may be normal on a holiday schedule but alarming on a trading day. A traffic spike may be expected during a campaign launch but suspicious on a quiet weekend.
Collective anomalies
A collective anomaly is where enterprise monitoring often falls apart. Individual records appear harmless, but the group forms a pattern that shouldn't exist. A coordinated bot attack, a subtle schema drift across multiple fields, or a sequence of events that changes together can all fall into this category.
Simple thresholding fails to capture context. Teams need methods that detect relationships across columns, time windows, and entities.
A bad row is easy to catch. A bad pattern spread across a healthy-looking dataset is what hurts production trust.
Why static thresholds fail here
Static thresholds are attractive because they're easy to explain. They're also expensive to maintain. Every new source, seasonality pattern, and business exception adds more rules. Eventually, the system becomes noisy enough that people ignore it.
Modern platforms replace that with adaptive baseline learning. As described in digna's overview of AI anomaly detection techniques, machine learning anomaly detection systems continuously profile record volume, missing values, and value distributions to define expected boundaries dynamically, which helps detect silent errors like missing or duplicated records in real time.
That operating model changes daily work for data teams:
Less rule maintenance: Engineers don't have to hand-tune thresholds for every table and metric.
Better coverage: The system can watch behavioral changes that aren't obvious enough to encode manually.
More transparent investigation: Teams can compare current behavior against learned baselines instead of debating whether a threshold was set correctly.
What this means in observability practice
In observability, anomaly detection isn't isolated from the rest of the stack. It sits next to timeliness monitoring, schema tracking, and validation. One catches an unexpected metric pattern. Another confirms a delay. Another reveals a new column or data type shift. Together, they explain why trust broke.
That's the practical value. You're not just detecting outliers. You're defending business decisions from data that still looks available, fresh, and queryable on the surface.
The Four Key Machine Learning Approaches
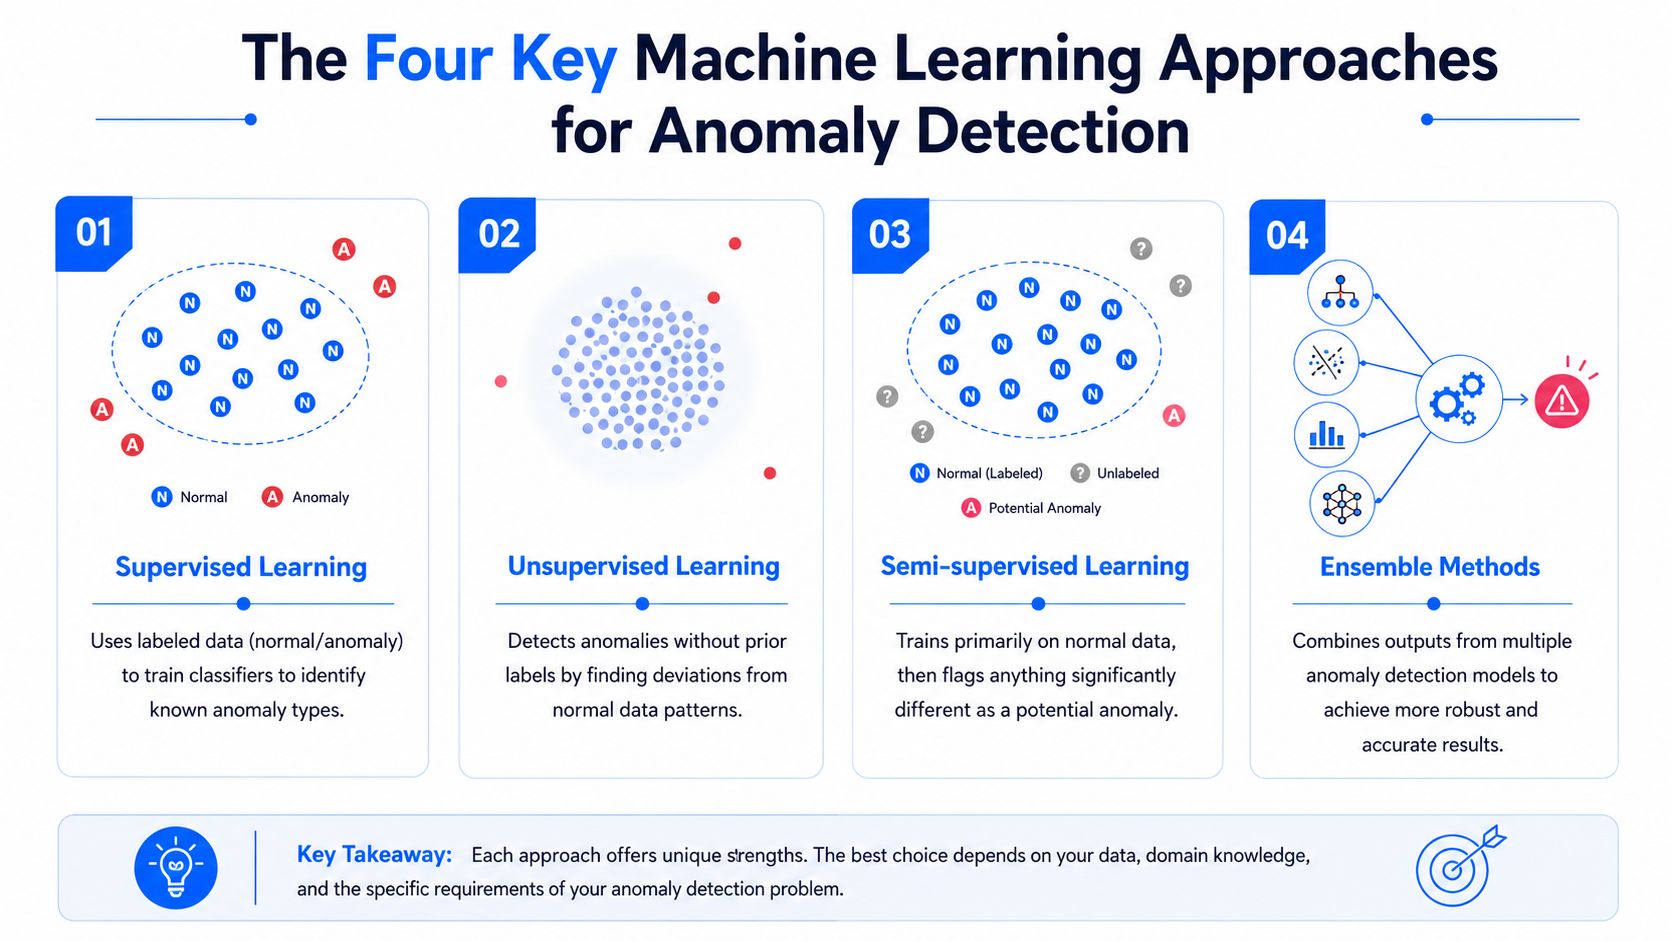
The right approach depends less on algorithm popularity and more on what your data team has. Labels, stable historical baselines, sequence structure, compute budget, latency needs, and review capacity all matter more than novelty.
Supervised learning
Supervised detection works when you already know what bad looks like and have labels to prove it. Fraud systems, claims review pipelines, and some security workflows can justify this because they accumulate reviewed incidents over time.
The upside is precision on known failure modes. If your labeled anomalies are representative, a classifier can learn those patterns directly.
The downside is operational. Labels are scarce, expensive, and often stale. Enterprise data issues also change shape. Last quarter's anomaly class may not cover this quarter's integration bug.
Use supervised approaches when:
Reviewed anomalies exist: Your team has high-quality labels from analysts, fraud investigators, or security operations.
Failure types repeat: You're dealing with recurring, well-understood anomaly classes.
Action paths are defined: The business already knows what to do when the system flags an issue.
Unsupervised learning
Unsupervised methods are the default in many data platforms because labels are often unavailable. The system looks for deviations in the data itself rather than examples of known bad events.
This is often the most practical path for enterprise observability. You can deploy it across many tables and metrics without first building a labeling operation. Methods like clustering, isolation-based models, and distance-based scoring fit here.
One strong real-world design comes from Netdata's anomaly detection documentation, which describes unsupervised k-means clustering with k=2 on rolling windows across multiple models per metric and reports a 99% reduction in false positives by requiring unanimous consensus before flagging an anomaly. That's a good reminder that architecture choices can matter as much as the base algorithm.
The first production question isn't “Which model is smartest?” It's “Which approach can survive unlabeled data, noisy inputs, and on-call reality?”
Semi-supervised learning
Semi-supervised detection starts from a practical assumption: you may not know every anomaly, but you usually know a set of trusted normal data. The model learns that baseline and treats meaningful deviations as suspicious.
This is especially useful in enterprise pipelines where healthy periods are easier to identify than bad ones. You can train on accepted historical windows, then score new data against that learned representation.
Semi-supervised methods tend to work well when:
Situation | Why semi-supervised helps |
|---|---|
Stable systems with occasional drift | The model learns a clear normal operating range |
Sensitive workflows | Teams prefer conservative detection anchored in trusted data |
Low anomaly frequency | There aren't enough positive examples to support supervised learning |
Deep learning
Deep learning becomes relevant when structure is complex enough that simpler models miss it. Time-series signals, multivariate telemetry, and high-dimensional behavior often fall into this category.
For industrial and pipeline time-series settings, this review on anomaly detection methods notes that LSTM forecasters combined with Variational Mode Decomposition can extract periodic components before detecting anomalies in residual time series. In plain terms, that means the model first separates normal repeating behavior from the leftovers, then checks whether the leftovers look suspicious.
Deep learning is useful when:
sequences matter more than isolated records
periodicity and drift coexist
the signal spans many correlated variables
It also brings heavier compute, more tuning, and more monitoring burden. If a simpler method catches the issue with acceptable signal quality, the simpler method is usually the better production choice.
Ensembles in practice
Many enterprise systems end up using ensemble methods, even if teams don't describe them that way. They combine multiple detectors or scoring stages to reduce noise and improve reliability.
A practical ensemble might include a baseline statistical screen, a learned anomaly score, and a validation rule. Another might pair an autoencoder with isolation-based thresholding. In production, ensembles often win because they respect the messy truth that one detector rarely handles every table, cadence, and failure mode well.
Choosing the Right Algorithm for the Job
There is no universally best anomaly detection algorithm. There is only an algorithm that matches your data structure, anomaly shape, latency requirement, and review process. Teams get into trouble when they standardize on one method because it worked once.
The most important distinction is whether you need to catch global anomalies or local anomalies. That sounds academic until you deploy at scale. Then it becomes the difference between catching actual drift and missing it for months.
Local versus global matters
Some anomalies sit far outside the entire dataset. Those are global outliers. Others are only strange within a local neighborhood or cluster. Those are local outliers.
That distinction changes model choice. According to research from the Journal of Machine Learning Research, algorithm choice must depend on whether anomalies are local or global. When data contains multiple density clusters, k-nearest neighbors outperforms isolation forest, while isolation forest is better suited to pure global anomalies.
That's directly relevant to enterprise data. Customer behavior often clusters by region, product, or channel. Equipment metrics cluster by operating mode. User activity clusters by role. A point can look normal globally and still be highly abnormal inside its own segment.
Anomaly Detection Algorithm Cheat Sheet
Algorithm | Type | Best For | Key Consideration |
|---|---|---|---|
Isolation Forest | Global outlier detection | Clear, isolated anomalies in tabular data | Can miss local anomalies inside dense clusters |
k-Nearest Neighbors | Local density and distance based | Clustered datasets where neighborhood behavior matters | Sensitive to scaling and distance definition |
Local Outlier Factor | Local density based | Detecting records that have much lower local density than nearby points | Harder to explain to non-technical reviewers |
Z-score | Univariate statistical baseline | Fast checks on single metrics with relatively stable distributions | Weak on multivariate relationships |
ECOD | Tabular outlier baseline | Lightweight baseline for data quality workflows | Best used as a benchmark, not a universal answer |
LSTM | Sequence model | Time-series with temporal dependencies and recurring patterns | Higher operational cost and tuning burden |
Autoencoder | Reconstruction based | High-dimensional normal-pattern learning | Thresholding and drift handling need care |
What works for common enterprise cases
For tabular quality monitoring, simple baselines still have a place. Isolation Forest and ECOD are practical starting points for columns, row-level metrics, and dataset health checks.
For clustered customer or product data, neighborhood methods usually deserve early testing. If your dataset has multiple operating regimes, local density approaches can surface anomalies that global methods smooth over.
For time-series, choose based on how much memory the pattern requires. Short-term deviation checks can work with simpler statistical methods. Longer dependencies, periodicity, and residual behavior may justify recurrent or reconstruction-based models. If your team is evaluating sequence-specific designs, this guide to detecting anomalies in time series is a useful operational reference.
Don't pick an algorithm because it's popular. Pick it because its failure mode is acceptable for your data.
The trade-offs teams underestimate
The algorithm isn't the whole system. Production success depends on several less glamorous details:
Scaling and preprocessing: Distance-based models break when features aren't normalized.
Interpretability: Security teams and data stewards often need a reason, not just a score.
Retraining cadence: A strong detector degrades if baseline behavior changes and nobody updates it.
Review workflow: A slightly weaker model with cleaner triage often beats a stronger model that floods Slack.
That's why algorithm selection should happen alongside operational design, not before it.
How to Measure Success and Avoid False Alarms
Monday morning, the detector fires on 600 records. Twelve need action. The rest are normal late arrivals, planned catalog changes, and one-off business events. If the team has to sort through that pile every day, the model is failing even if its offline score looked good.

Why accuracy misleads
Accuracy hides the cost structure of anomaly detection. In imbalanced datasets, a model can classify almost everything as normal and still appear strong on paper. That does not help the fraud analyst, data steward, or platform engineer who needs the system to catch rare failures without creating constant noise.
For this kind of class imbalance, precision, recall, and F1 are the usual starting metrics. Google's machine learning guidance on classification metrics for imbalanced datasets is a practical reference if your team needs a shared baseline for evaluation.
The metrics that matter in production
Each metric answers a different operational question.
Precision: Of the alerts sent to a person or downstream system, how many were worth acting on?
Recall: Of all anomalies, how many did the detector catch?
F1 score: How balanced are precision and recall when you need one number for model comparison?
Those numbers should map to business cost. In payments, weak recall means missed fraud. In data operations, weak precision means alert queues fill up, on-call teams stop trusting the detector, and real incidents wait longer for review.
Threshold setting matters as much as model choice. Teams often spend weeks comparing algorithms and then apply a default cutoff that was never tuned for their review capacity or incident severity.
Evaluate the alert process, not just the model
Offline test sets are useful, but they miss a common enterprise reality. Many anomalies are only anomalous in context.
A schema shift might be a valid release. A spike in orders might come from a planned promotion. A delayed batch might match a vendor SLA that changed last quarter. The detector can flag the pattern correctly and still create a bad alert if the system lacks business context.
A better evaluation process includes:
Reviewed alert samples by the people who own the downstream decision.
Segment-level scoring so one average does not hide failure in a high-risk region, customer tier, or source system.
Threshold tests against review capacity to confirm that daily alert volume is manageable.
Feedback capture so confirmed false positives and true positives improve future tuning.
For teams building that review layer, this guide on outlier identification methods is useful when comparing simple statistical checks with ML-based detectors during validation.
High recall with low precision creates operator fatigue. High precision with low recall creates blind spots. A useful detector fits the business response model.
Use baselines that survive audit
Start with a baseline the team can explain to audit, security, and operations. That might be a percentile rule, a seasonal threshold, or a simple unsupervised model with clear threshold logic. If a more complex detector only improves an offline benchmark but makes triage harder, it does not belong in the production alert path yet.
This matters even more in enterprise environments where models run inside the warehouse or lakehouse to avoid copying sensitive data into separate systems. In-database execution can simplify privacy controls and reduce movement of regulated records, but it also puts pressure on teams to choose metrics, thresholds, and review flows that work with existing observability tooling. Success is not just catching anomalies. Success is catching the right anomalies, at a review volume the organization can sustain.
Enterprise Deployment and Monitoring Considerations
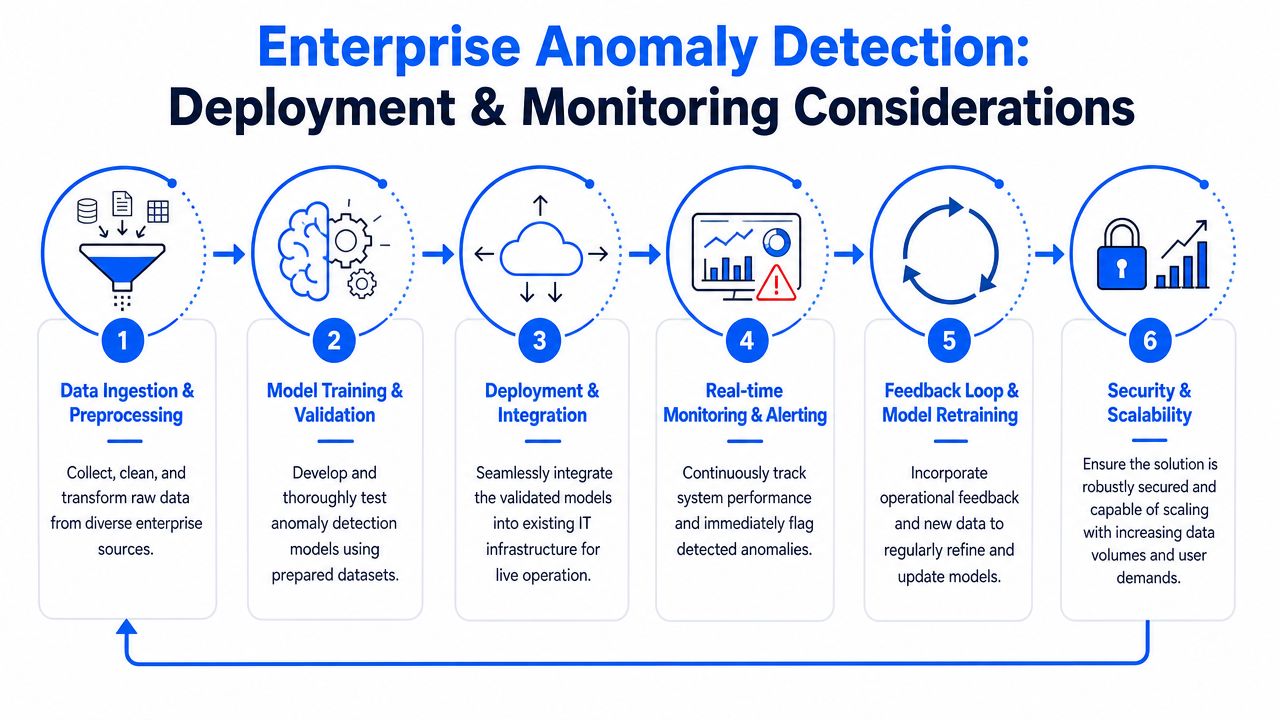
Most writing about machine learning anomaly detection stops at model selection. Enterprise teams usually fail later, during deployment. They discover the model requires too much data movement, violates privacy expectations, adds operational overhead, or produces thresholds that drift out of relevance.
Those aren't edge problems. They're the actual implementation work.
Real-time versus batch
Not every anomaly needs immediate scoring. Some business processes can tolerate batch detection, where the system reviews hourly or daily windows. Others can't. Fraud review, operational telemetry, SLA-sensitive data feeds, and executive dashboards often need much shorter feedback loops.
The trade-off is simple:
Deployment mode | Works well when | Trade-off |
|---|---|---|
Real-time scoring | Delay is expensive or risk-sensitive | Higher infrastructure and operational complexity |
Batch detection | Trends matter more than instant response | Problems may be discovered after downstream impact |
Teams often overestimate their need for real-time and underestimate the cost of maintaining it. If the business action still happens the next morning, overnight scoring may be enough.
In-database execution changes the economics
For enterprise environments, where the model runs can matter as much as what it does. Pulling production data into an external monitoring stack creates extra latency, governance reviews, cost, and exposure. It also duplicates logic across systems.
Running analysis inside the customer's database or warehouse solves several practical problems at once:
Privacy stays tighter: Sensitive records remain in the controlled environment.
Performance improves: Less data movement means fewer bottlenecks.
Operations simplify: Teams avoid exporting large metric sets just to score them elsewhere.
Governance is easier: Security and compliance teams usually prefer architectures with fewer data copies.
This is one place where product architecture matters. For example, digna is built around in-database metric computation and baseline learning while running in private cloud or on-prem environments, which makes it relevant for teams that need anomaly detection, timeliness monitoring, schema tracking, and validation without vendor access to production datasets.
Dynamic thresholds are not optional
Static thresholds break under changing distributions. That problem becomes severe at enterprise scale because every dataset evolves differently. New geographies, new channels, new business calendars, and changing usage patterns all invalidate hand-tuned limits.
Recent work summarized in this research on dynamic anomaly thresholding highlights a practical answer: autoencoder-based systems combined with isolation forest can use outlier-aware thresholding to adapt thresholds dynamically based on learned normal behavior. That matters because manual threshold tuning doesn't scale across large observability estates.
Monitoring the detector itself
An anomaly detector is another production system. It needs its own monitoring.
Watch input drift: If upstream schemas or distributions change, anomaly scores may become meaningless.
Track alert volume: Sudden increases can indicate real incidents or detector degradation.
Measure review outcomes: If analysts repeatedly dismiss alerts from one detector, retrain or replace it.
Version model logic carefully: Changes to feature engineering or windows can alter alert behavior as much as algorithm changes do.
A detector that isn't monitored becomes another silent failure waiting to happen.
Observability is broader than anomalies
The most useful enterprise setups don't treat anomaly detection as a standalone feature. They tie it to timeliness, validation, and schema monitoring. A volume anomaly gains context when the same system also shows a delayed source load or a column type change. Root-cause analysis gets faster because operators don't have to jump across disconnected tools.
That broader view is what makes anomaly detection actionable instead of merely interesting.
Best Practices and Common Pitfalls to Avoid
Teams get better results when they treat machine learning anomaly detection as an operational discipline, not a model experiment. The strongest deployments are usually boring in the right ways. Clear objective, clean inputs, defined ownership, measured feedback.
Best practices that hold up in production
Start with a business consequence: Tie detection to a real failure such as broken forecasting, delayed reporting, fraud review, or corrupted model inputs.
Profile the data before choosing the model: Use feature scaling, missing-value handling, and relevant feature engineering where needed. As summarized in this overview of anomaly detection methods and preprocessing, normalization, imputation, feature engineering, and hyperparameter tuning are critical parts of effective anomaly detection workflows.
Use simple baselines first: A basic statistical or tree-based method can reveal whether the signal exists before you invest in heavier architectures.
Define alert review ownership: Someone has to confirm whether a flagged anomaly is real and whether the response path worked.
Retrain on purpose: Baselines age. Put retraining and threshold review on an explicit schedule tied to data change, not wishful thinking.
Pitfalls that create noise and distrust
Some mistakes show up repeatedly.
One algorithm everywhere: Customer events, financial transactions, sensor streams, and table-level quality metrics rarely behave the same way.
Ignoring context: A spike without business timing, schedule, or segment information often creates false alarms.
Skipping preprocessing: Distance-based methods and density methods degrade quickly on unscaled or dirty inputs.
Treating alerts as final truth: An anomaly score is a decision aid, not proof of incident severity.
Forgetting downstream users: If the output isn't understandable to analysts, operators, or stewards, the system won't influence decisions.
A practical checklist
Before you push a detector into production, confirm these questions have clear answers:
Check | Why it matters |
|---|---|
What business action follows an alert? | Detection without response creates noise |
What kind of anomaly are we targeting? | Point, contextual, and collective cases need different logic |
Do we need local or global sensitivity? | This changes algorithm selection materially |
How will we evaluate quality? | Precision, recall, and F1 are more useful than accuracy |
Where will scoring run? | Deployment architecture affects privacy, cost, and latency |
Who reviews and labels edge cases? | Feedback keeps the system useful over time |
Machine learning anomaly detection earns trust when it catches issues early, explains enough to support action, and fits the realities of enterprise data operations. That usually means less obsession with model novelty and more discipline around architecture, review loops, and integration with observability.
If your team needs anomaly detection that fits enterprise constraints, digna is one option to evaluate. It focuses on data anomalies, validation, timeliness, and schema tracking with in-database execution in customer-controlled environments, which is useful when privacy, operational simplicity, and observability integration matter as much as the detection model itself.
For learned baselines on table volumes, missing values and value distributions without hand-tuned thresholds, see how digna Data Anomalies runs anomaly detection inside your database.
Frequently asked questions
What is machine learning anomaly detection?
It replaces hand-written rules with learned baselines: the system models expected behavior and flags meaningful deviations, catching silent errors such as duplicated records, late timestamps or drifting distributions. The article cites research showing ML methods outperform traditional statistical approaches by 8 to 12% in accuracy, especially on multivariate, high-dimensional data.
What are point, contextual and collective anomalies?
Point anomalies are single values that look wrong, like one warehouse load with an impossible record count. Contextual anomalies depend on timing or conditions, such as heavy login volume at 3 AM. Collective anomalies are groups of harmless-looking records forming a bad pattern, like a coordinated bot attack or multi-field schema drift.
Should I use supervised or unsupervised anomaly detection?
Unsupervised is usually the practical default because labeled anomalies are scarce and expensive. Supervised methods fit when reviewed incidents exist and failure types repeat, as in fraud or claims review. Netdata's unsupervised k-means setup with k=2 reported a 99% reduction in false positives by requiring consensus across several models.
Is isolation forest or k-nearest neighbors better for anomaly detection?
It depends on whether anomalies are global or local. Research in the Journal of Machine Learning Research found k-nearest neighbors outperforms isolation forest when data contains multiple density clusters, while isolation forest suits pure global outliers. Customer data clustered by region or channel often needs the local, neighborhood-based approach.
How do you measure an anomaly detector's performance?
Skip accuracy, which looks strong on imbalanced data even when a model calls almost everything normal. Use precision, recall and F1, then test thresholds against real review capacity: a detector that fires on 600 records when only twelve need action is failing, however good its offline score looked.



