digna Democratizes Time Series Analysis and Anomaly Detection for Business Users
|
6
min di lettura
The Problem with Time Series Analysis Today
Time series analysis has traditionally been the domain of data scientists.
Understanding how data evolves over time, identifying trends, seasonality, volatility, and anomalies, usually requires:
Python or R
statistical modeling expertise
external tools or notebooks
complex data pipelines
For most business users, this creates a barrier.
They can access dashboards and reports, but they cannot answer deeper questions such as:
Is this change expected or unusual?
Are there recurring patterns in our data?
Is this trend sustainable or temporary?
As a result, organizations often rely on specialized teams for insights that should be accessible across the business.
Why Time Series Analysis Matters for Every Team
Modern data environments are dynamic.
Data doesn’t fail suddenly, it evolves.
Costs increase gradually
User behavior shifts over time
Operational metrics drift
Performance becomes unstable
Without time series analysis, these changes remain invisible until they become problems.
This is why understanding data behavior over time is no longer optional. It’s essential.
digna Brings Time Series Analysis to Business Users
With the latest release, digna introduces built-in time series analysis and anomaly detection directly into the platform, without requiring data science expertise.
Instead of exporting data to external tools, users can now analyze trends, patterns, and anomalies where the data already lives.
This marks a shift from:
❌ Monitoring data
→ to
✅ Understanding data behavior
Interactive Time Series Analysis — No Coding Required
The new Analytics Chart enables users to explore data behavior interactively.
It provides built-in statistical methods that are automatically applied to your datasets.
📊 Identify Trends with Regression Models
Users can apply linear, quadratic, and cubic regression to understand how data evolves over time.
This helps answer critical questions like:
Is usage increasing steadily?
Is growth accelerating or slowing down?
Are we seeing structural changes?
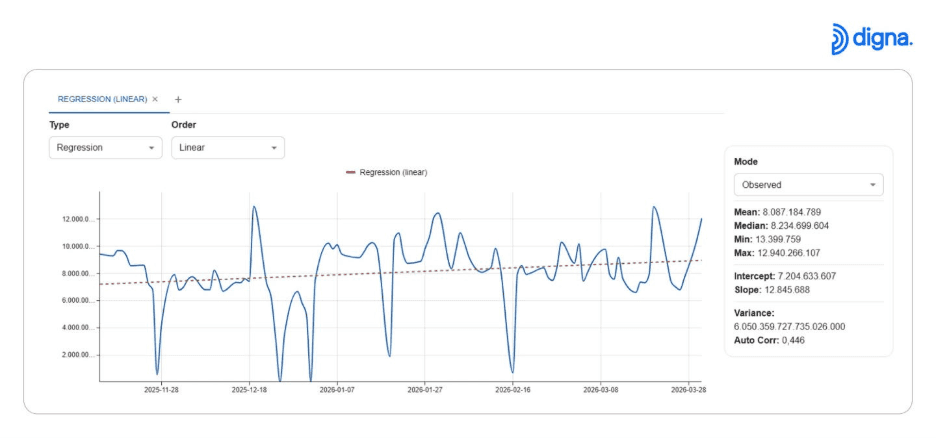
Visualizing trends using regression models to understand long-term data behavior.
🔍 Detect Breakpoints and Structural Changes
Piecewise regression allows users to identify points where data behavior changes.
This is crucial for detecting:
sudden shifts in performance
changes in user behavior
new patterns introduced by system updates
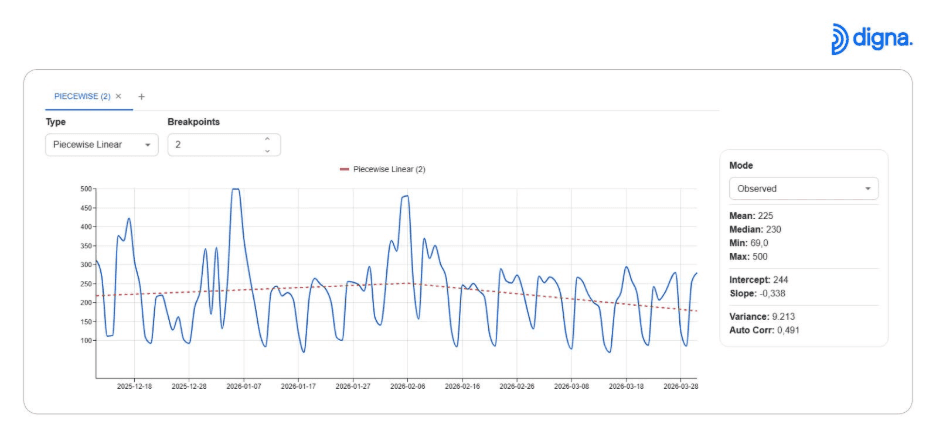
Identifying structural breaks in time-series data to detect behavioral changes.
🔄 Discover Seasonality and Recurring Patterns
digna automatically detects seasonal patterns and cyclical behavior.
This helps teams distinguish between:
expected recurring patterns
true anomalies
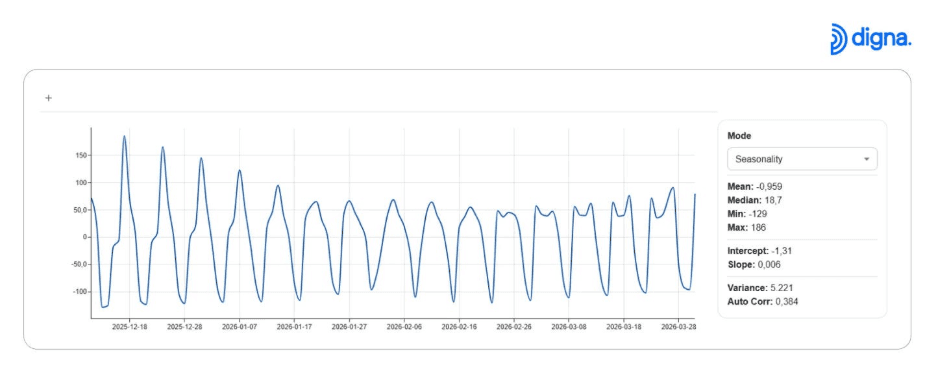
Detecting recurring patterns and seasonal trends in data.
📉 Analyze Variability and Distribution
Quantile analysis and smoothing techniques allow users to understand variability and data distribution over time.
This enables:
better forecasting
improved anomaly detection
clearer understanding of volatility
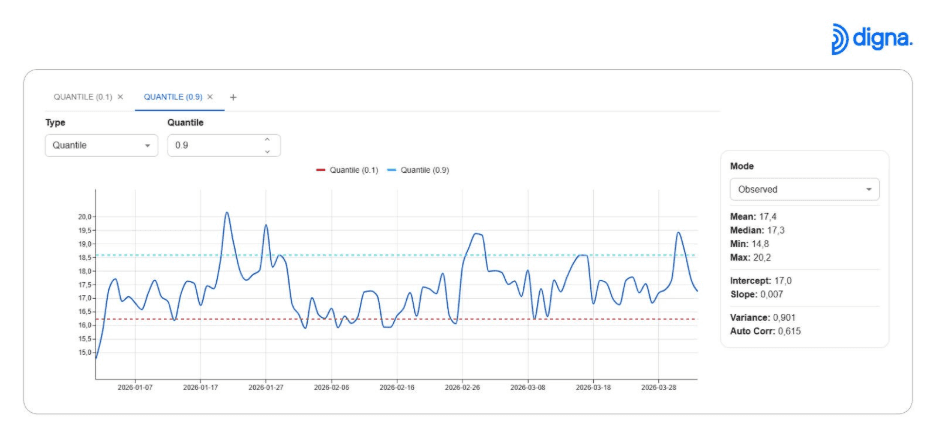
Understanding variability and distribution using quantile analysis.
Built-In Anomaly Detection — Without Rules
Traditional anomaly detection relies on predefined rules:
thresholds
static conditions
manually defined checks
These approaches do not scale well in modern environments.
digna takes a different approach.
Using statistical learning methods, it:
learns how data behaves over time
identifies deviations from expected patterns
detects both sudden spikes and gradual drift
This allows teams to identify issues earlier, without maintaining thousands of rules.
From Data Science Dependency to Self-Service Analytics
One of the biggest impacts of this release is democratization.
Business users no longer need to depend on data scientists to:
analyze trends
detect anomalies
understand behavior
Instead, they can:
explore data directly
interpret patterns themselves
make faster decisions
This reduces bottlenecks and accelerates insight generation across the organization.
Why This Matters for Modern Enterprises
As data systems scale, complexity increases.
Organizations need:
faster insight generation
better visibility into data behavior
scalable monitoring without manual effort
By combining time series analysis and anomaly detection inside the platform, digna enables teams to:
detect issues earlier
understand root causes faster
reduce reliance on external tools
maintain data quality at scale
In-Database Analysis — No Data Movement
All analytics and validation in digna are executed directly inside the source database.
This ensures:
high performance
strong security
compliance with data governance policies
Unlike other tools, there is no need to export data for analysis.
Final Thoughts
Time series analysis and anomaly detection should not be limited to data scientists.
As data becomes central to every business function, understanding how it behaves over time must become accessible to everyone.
With this release, digna brings advanced analytics directly to business users, enabling them to move beyond monitoring and toward true data understanding.
Explore More
Learn more about digna’s approach to data quality and observability:
Or explore the full release details:
👉 https://docs.digna.ai/changelog/Release_202604/
The regression, seasonality and quantile methods described here sit in digna's module for tracking how data behaves over time, which the digna Data Analytics overview covers in more detail.
Frequently asked questions
Can business users do time series analysis without coding?
Yes, with digna's Analytics Chart they can. Instead of needing Python or R, statistical modeling expertise, notebooks or complex pipelines, users explore trends, seasonality and anomalies interactively inside the platform, with built-in statistical methods applied automatically to their datasets. That removes the dependency on data scientists for everyday questions.
Which regression models does digna's Analytics Chart support?
The Analytics Chart supports linear, quadratic and cubic regression for trend analysis, plus piecewise regression for finding breakpoints. Together they help answer whether usage is rising steadily, whether growth is accelerating or slowing, and where structural changes, such as those introduced by a system update, have altered how the data behaves.
How does digna tell seasonality apart from real anomalies?
It detects seasonal patterns and cyclical behavior automatically, so recurring movements are recognised as expected rather than flagged. Its anomaly detection uses statistical learning to model how data behaves over time, then identifies deviations from those expected patterns, catching both sudden spikes and gradual drift without manually maintained rules.
Why is rule-based anomaly detection not enough?
Rule-based detection relies on thresholds, static conditions and manually defined checks, and these do not scale in modern data environments. The article contrasts this with digna's statistical learning approach, which learns expected behavior and spots gradual drift as well as sudden spikes, so teams find issues earlier without maintaining thousands of rules.
Does digna export data to run time series analysis?
No. All analytics and validation in digna run directly inside the source database, so data never has to be exported to external tools or notebooks. The article highlights three benefits of this in-database approach: high performance, strong security, and compliance with the organization's existing data governance policies.



