Data Quality Implementation Playbook for Modern Data Teams
|
7
minute de lecture

Your dashboards are stale again, a pipeline failed overnight, and the first question in the morning is still the same, “Can we trust this number?” That's a common challenge for a lot of teams doing data quality implementation after the warehouse, the lake, and the BI layer are already live. The fix isn't another cleanup sprint, it's building controls that keep bad data from becoming someone else's problem.
A workable program starts with a simple idea, only a small slice of data really carries the business risk. The teams that win stop treating quality as a one-time project and start treating it like operations, with ownership, thresholds, and alerts that fit into the pipeline people already run.
Table of Contents
Why Data Quality Implementation Fails Without a Control System
Identifying Critical Data Elements and Setting Tiered Thresholds
Architecture and Deployment Options for Enterprise Environments
Integrating Quality Checks into Pipelines and MLOps Workflows
Why Data Quality Implementation Fails Without a Control System
From cleanup work to managed controls
A lot of data teams still run quality work like an emergency response. A dashboard goes wrong, someone opens a ticket, an analyst patches a model, and the same issue shows up again next week because nobody changed the upstream behavior. That pattern is exactly why modern guidance treats data quality as a managed system of accuracy, completeness, consistency, timeliness, uniqueness, and validity, not a one-off cleanup effort (TechTarget).
The breakage is usually mundane. A late load makes a revenue report look flat, a missing key causes joins to drop records, or a schema change shifts a metric. Once a team has hundreds of daily loads, manual rescue work stops scaling, and the warehouse starts accumulating little trust failures that people notice long before they can explain them.
Practical rule: if a check doesn't have an owner, a threshold, and a path to remediation, it's not a control, it's a note.
Why periodic auditing breaks down
Periodic audits help, but they're too slow for live pipelines. Contemporary practitioner guidance now puts timeliness, latency tracking, expiration rules, and real-time syncing at the center of routine quality management, because the first sign of trouble is often delayed or inconsistent data, not obvious corruption (Lumenalta). That's why the control model has shifted toward checks embedded in pipelines, validated against rules, and monitored over time.
The other failure mode is cultural. Teams call the work “data cleaning,” which sounds finite, then they staff it like a project with an end date. In practice, the better model is closer to release management. You identify the critical data elements, map business rules to checks, define acceptance thresholds, and keep watching after the initial rollout. That approach lines up with guidance that emphasizes data dictionaries, provenance, lineage, and recency before deeper governance layers can work effectively (TechTarget).
When that shift happens, the conversation changes. People stop asking whether the data “looks right” and start asking whether it is within tolerance, who owns the exception, and what the downstream blast radius is if it isn't.
Identifying Critical Data Elements and Setting Tiered Thresholds
Start with the fields that carry risk
Most programs go wrong because they try to measure too much at once. Start with the critical data elements tied to revenue, compliance, or core operations, then leave the rest alone until the first domain is stable. Gartner's guidance on data quality says use cases and data resources should be mapped by value and risk before you choose dimensions and metrics (Gartner).
That matters in regulated environments, where risk usually clusters around a small set of fields rather than the whole warehouse. Identifiers, balances, patient records, and similar records deserve far more attention than low-impact reference tables. If you try to instrument everything equally, the team ends up with a noisy dashboard, weak prioritization, and a false sense of coverage.
A practical way to decide what belongs in scope is to ask three questions:
What breaks if this field is wrong? Revenue recognition, customer communications, compliance filings, or model features often expose the answer quickly.
Who feels the error first? Finance, operations, support, and ML teams often surface different failure modes.
Can we route ownership cleanly? If the fix requires five teams, the rule probably needs a tighter boundary.
Use that filter to define the first monitoring set. The goal is not to build the biggest program, it is to catch the mistakes that hurt. A useful scoping aid is the critical data elements lens, because it forces the team to name the fields that matter before it spends time on broad coverage.
Use baselines before you set rules
Before writing validation logic, profile the source. Government implementation guidance recommends looking at counts, null rates, min/max values, data types, and recurring patterns first, then using those results to set acceptance thresholds as percentages and measurable checks (Oracle). That sequence saves a lot of rework because you are not guessing what normal looks like.
Thresholds work better when they are tiered instead of binary. A practical framework uses Gold for ≥ 99% accuracy, Silver for 95–98%, and Bronze below 95% with remediation required (Acceldata). That structure gives product owners and stewards a common language, and it avoids the false precision of pass or fail on every single rule.
The first pass should stay tight. In a mature enterprise warehouse, a smaller monitored set with clear thresholds usually beats broad, weak coverage that nobody trusts.
Architecture and Deployment Options for Enterprise Environments
Choose where checks actually run
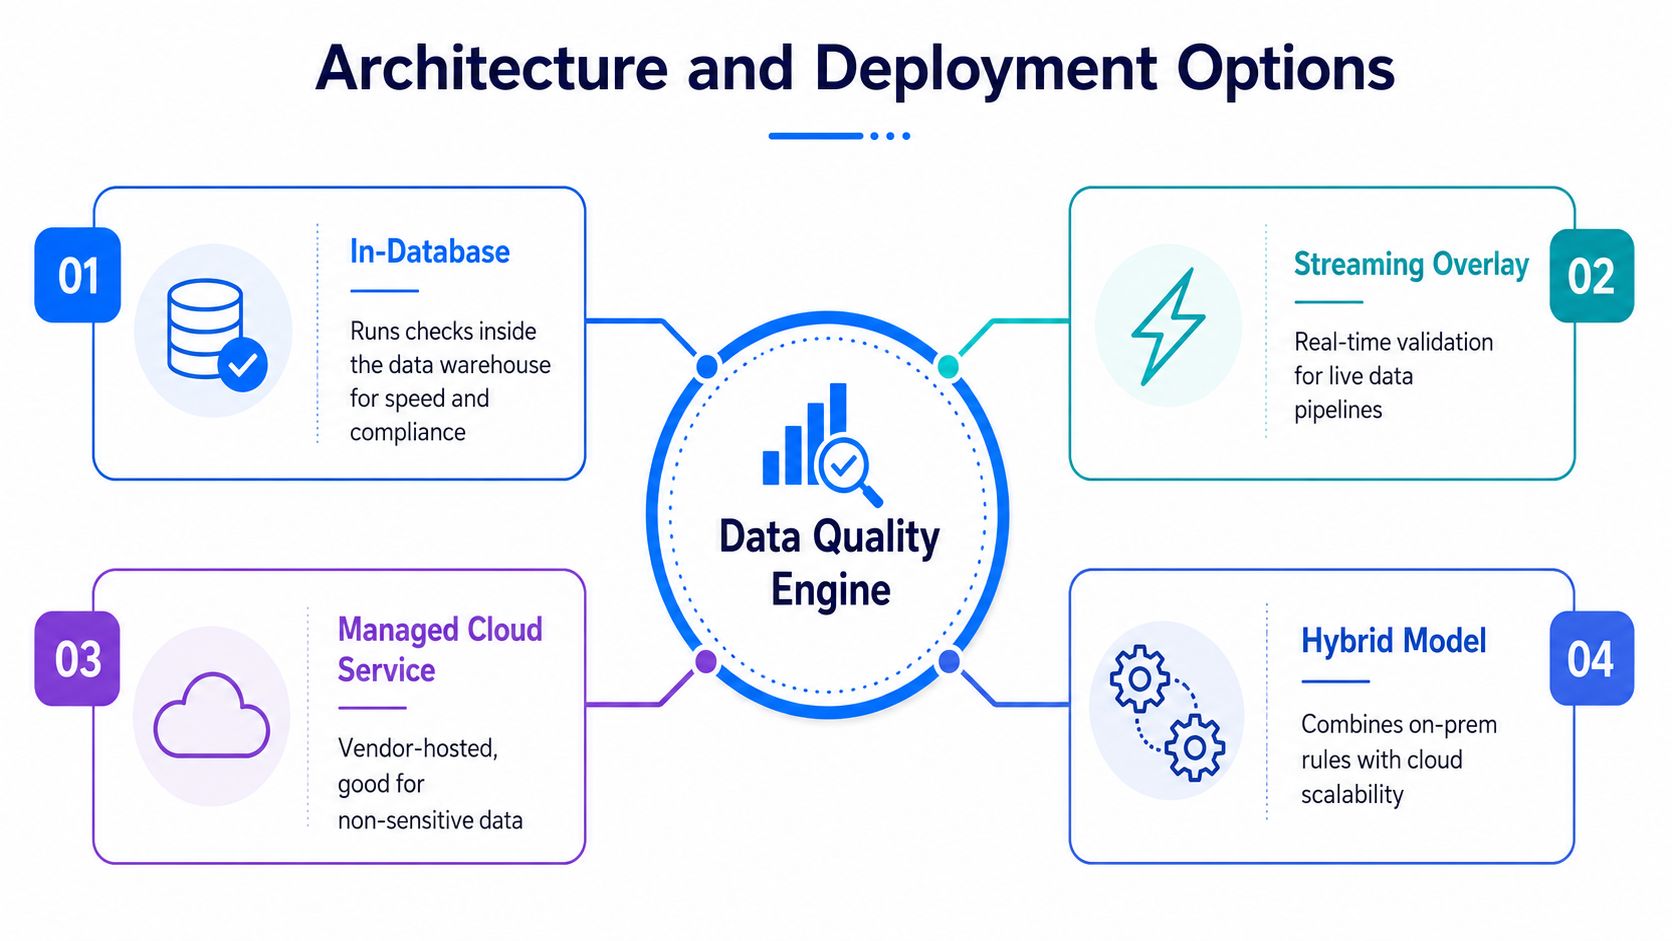
The architecture decision is not about elegance, it's about where the data lives and who is allowed to touch it. In finance, healthcare, telecom, and public sector environments, moving production data to an external system is often a nonstarter, so in-database execution becomes the practical choice. That keeps data resident in the customer-controlled environment and reduces unnecessary movement.
A lot of implementations fail on the first attempt. Teams buy a dashboard layer that looks good in demos, then discover they still need custom code everywhere the warehouse, lake, and pipelines diverge. The healthier pattern is to keep the quality engine close to the data, then expose the results through a UI, API, or SDK depending on who needs to act on them.
There are trade-offs either way:
Centralized dashboards help with visibility across teams, but they can become read-only theater if they aren't tied to ownership and enforcement.
Code-based SDKs give engineers the control they want, but they need a clean operating model or every team builds its own interpretation of the same rule.
Private cloud or on-prem deployments preserve control, which matters when data residency and vendor access are sensitive.
Hybrid setups can work when not every dataset needs the same treatment, but the split has to be intentional.
The best architecture is the one that fits existing infrastructure without forcing a rewrite of the warehouse or the orchestration stack.
Keep the platform close to the data
Modern platforms usually need three capabilities to stay useful in enterprise environments. First, baseline learning so the system understands recurring patterns. Second, trend analysis so you can spot drift instead of just counting failures. Third, schema tracking so column adds, removals, or type changes don't break downstream reports without notice.
A platform like digna fits this pattern by executing analyses inside customer databases, monitoring timeliness, and tracking schema changes without requiring the data to leave the controlled environment. That's the kind of deployment model enterprise teams usually need when observability has to coexist with privacy and existing warehouse investments.
The key trade-off is maintenance. A platform that sits too far from the data needs more glue code and more exception handling. A platform that runs close to the data can be operationally quieter, because it sees the source behavior directly and doesn't rely on copied extracts to understand what changed.
Designing Validation Rules and Anomaly Detection Baselines
Map controls to the right failure mode
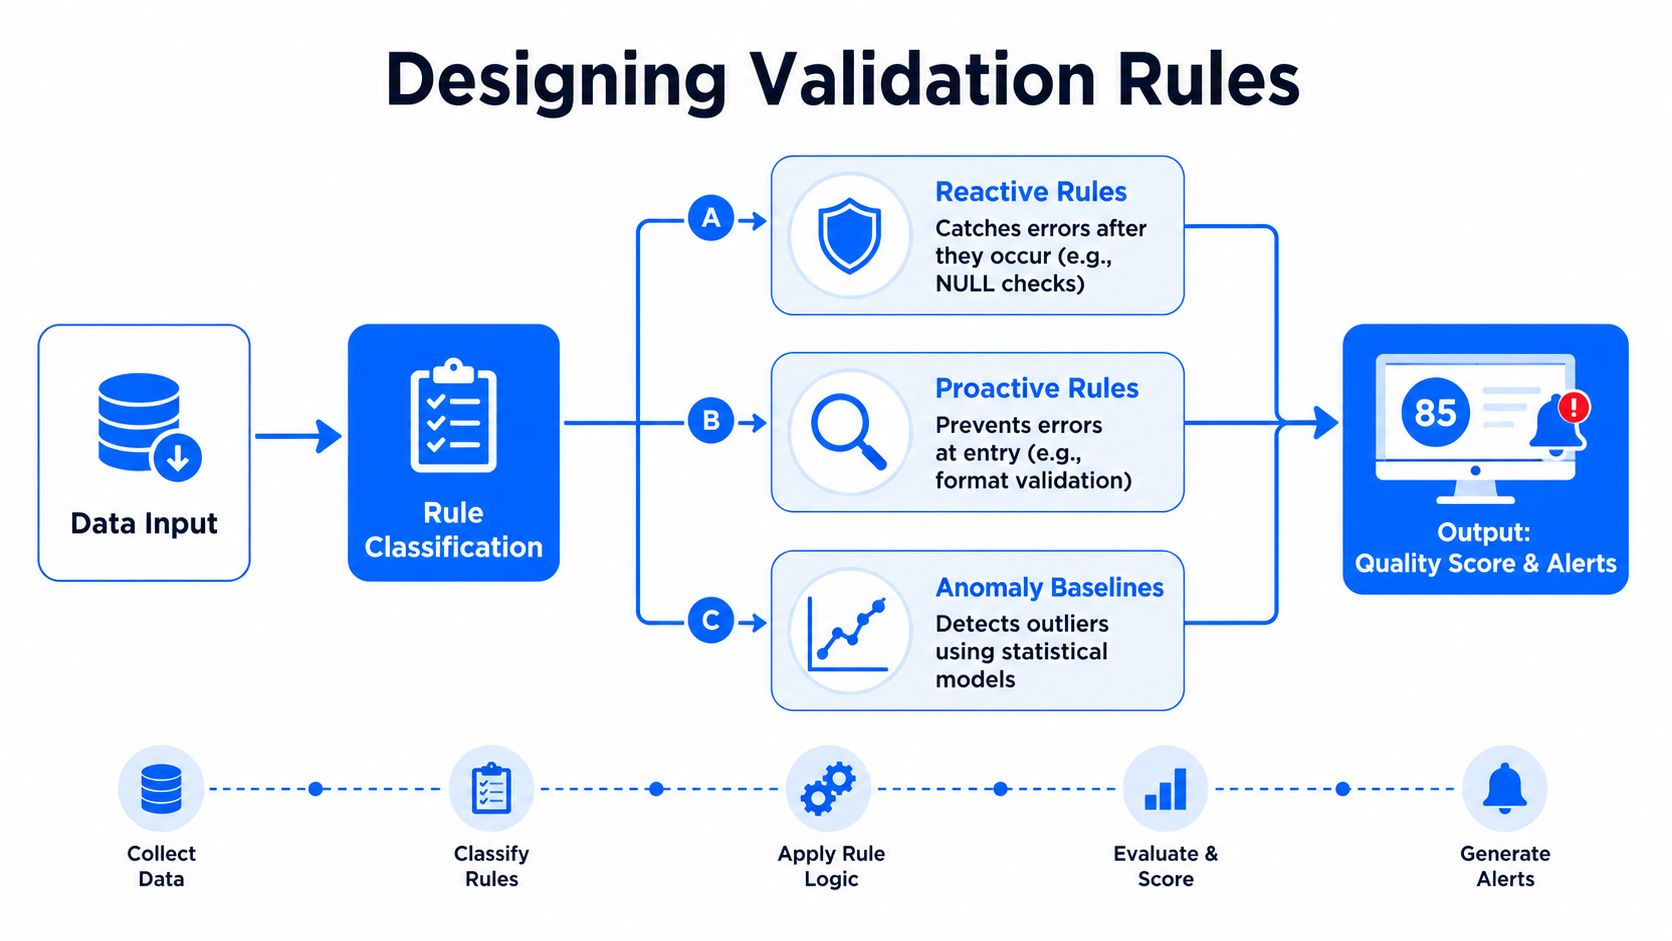
A practical control model combines four approaches, reactive, proactive, fit-for-consumption, and anomaly detection (OvalEdge). That mix matters because different failures need different responses. A missing value is one problem. A broken format is another. A slow drift in a source system needs a different control entirely.
Reactive rules catch issues after they occur. Proactive rules stop bad data at entry. Fit-for-consumption checks confirm the data is usable for a specific business purpose. Anomaly detection watches for changes that do not fit the learned pattern. That separation gives the platform a clear structure, and it keeps teams from turning every rule into a brittle hard stop.
The core dimensions stay the same, accuracy, completeness, consistency, timeliness, validity, and uniqueness. The useful part is mapping each dimension to the right control point instead of pretending one rule can cover everything.
A good rule tells you what failed, where it failed, and who should care. Anything less turns into a dashboard decoration.
Let baselines handle drift and timing
Anomaly detection pays off when the source changes slowly. If a table's volume, distribution, or timing pattern shifts enough to matter, a learned baseline can flag it before a business user sees the problem in a report. That cuts down the need for hundreds of hand-built checks, especially in volatile pipelines where schema and source behavior move often.
Timeliness needs its own treatment. Current practice includes monitoring expected delivery times, delay detection, and schedule-based arrival checks as standard quality controls (Lumenalta). Lateness often causes a bad decision before any other check fires. A “correct” dataset that lands after the meeting still fails the control.

Schema tracking closes another common gap. Added columns, removed columns, and data type changes can break downstream analytics even when the pipeline itself looks healthy. Treat those as first-class signals, not side notes, because they are often the earliest warning that a source contract has drifted.
Integrating Quality Checks into Pipelines and MLOps Workflows
Make quality gates part of delivery
Quality only matters when the pipeline enforces it automatically. That means validation checks, anomaly detection, and timeliness monitoring should run as part of the same delivery path that moves data into production dashboards or model training jobs. If the team has CI/CD for code, the data quality gate belongs there too.
The sequence should be boring. Validate on ingest, validate after transforms, and validate again before publish. If a load is scheduled, run the checks on the schedule. If it's streaming, keep the checks inline. If it feeds ML, block the feature set before bad inputs reach training or serving.
Use alerting sparingly and with intent. One noisy rule can create more damage than the data issue itself, because people stop trusting the page. Alerts should be routed by severity and business impact, not just by who happens to be on call.
Route exceptions to owners, not inboxes
The reason ownership matters is simple, recurring defects don't disappear because someone copied them into a ticket. They disappear when the right steward or custodian can see the failure, understand the root cause, and fix the source behavior. That's why mature frameworks pair checks with explicit ownership and escalation paths instead of leaving analysts to triage everything manually (Monte Carlo).
Feedback loops keep the rules current. Sources change, business goals change, and the team should expect the threshold model to change with them. Automation helps here, because it cuts human error and makes the program easier to sustain over time. If the workflow works, the engineers spend less time babysitting the pipeline and more time changing the pipeline.
Teams that want a managed workflow often look at tools like digna, dbt tests, or warehouse-native checks, but the selection only matters if the routing model is clear. The tool should report the issue, the steward should own the fix, and the history should show whether the same defect keeps coming back.
Continuous Monitoring and Measuring ROI
Measure quality as a running system
A pipeline can look healthy in the morning and still ship bad data by lunch. Manual spot-checks do not keep up with that pace, so continuous monitoring has to sit inside the control system, watching for delay, drift, and schema change before those issues shape decisions. The practical shift is from occasional cleanup to governed measurement, where the dataset is always under watch instead of being inspected on a calendar.
Set success criteria in operational terms, not in vague confidence. Teams usually track accuracy bands, monitored delay windows, and exception rates to decide whether the program is holding up. Those signals work better than whether a dataset looks clean, because they can be trended, compared across sources, and tied back to specific owners.
Historical analysis matters as well. When you review past incidents, the pattern usually shows up in arrival timing, drift, and repeated root causes that a one-time audit misses. That is what turns monitoring into a management system instead of a pile of alerts, and it is why data quality monitoring has to connect the check itself to the source, the owner, and the remediation path.
Useful test: if a metric does not help you decide whether to fix, escalate, or ignore, it belongs in a report, not a monitor.
Track outcomes without vanity metrics
ROI from data quality usually shows up as fewer fire drills, faster detection, and less manual repair. A monitoring dashboard can make that visible when it connects quality coverage to operational impact, not just technical activity. The right question is not how many checks exist, it is whether the checks prevent bad decisions and reduce repeat work.
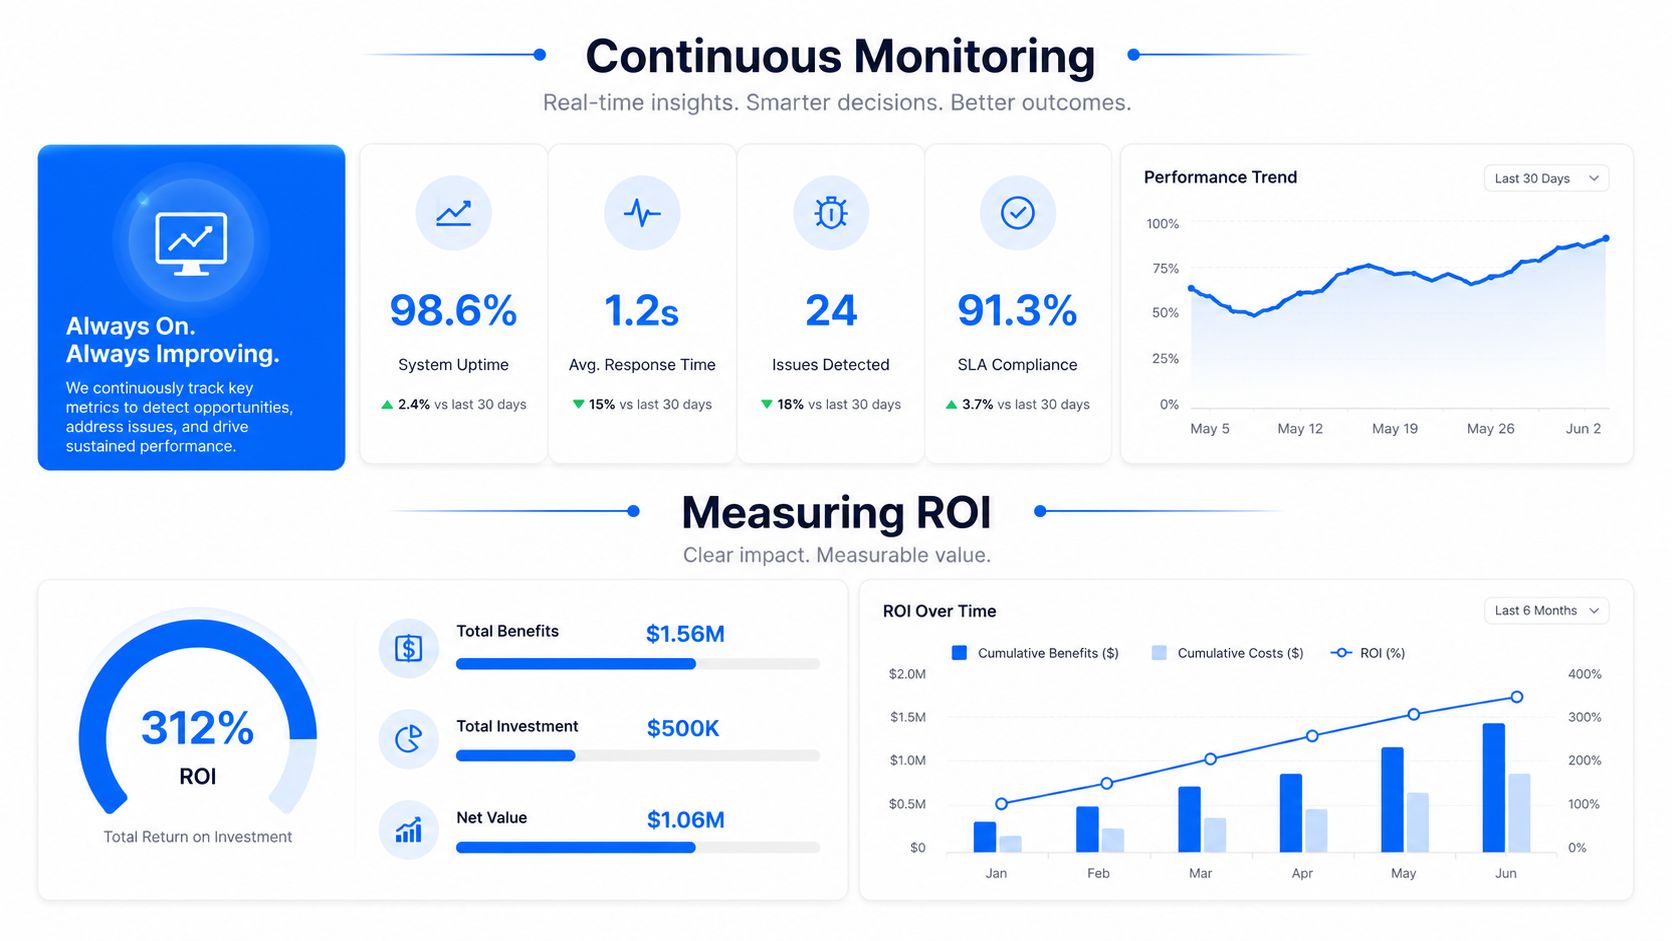
Regular reassessments matter because sources and goals keep changing. Automation helps maintain the cadence, but the value comes from the loop, detect, assign, fix, confirm, and then adjust the rule when the business changes. If the same issue keeps returning, the threshold, the ownership model, or the upstream process needs a review.
Your Data Quality Implementation Rollout Checklist
Launch small and expand with proof
Start with one or two domains that carry the most business risk. Profile the source, define the business rules, set the thresholds, and pick the owners before you broaden coverage. If the first rollouts don't stabilize, expanding the scope just multiplies the noise.
A practical rollout sequence looks like this:
Select critical data elements. Focus on the fields tied to revenue, compliance, or key operations.
Profile the source. Capture baselines for counts, null rates, ranges, data types, and common patterns.
Set acceptance bands. Use measurable thresholds and tiered outcomes so the team knows what triggers remediation.
Wire in automation. Run checks inside the pipeline, not by manual inspection after the fact.
Assign ownership. Make sure every recurring defect lands with a steward or custodian who can fix the source.
Review and expand. Add more coverage only after the first area is stable.
Keep a hard eye on scope creep. Teams often try to define too many metrics before they've stabilized the business-critical ones, or they forget legacy and external sources where the weirdness usually lives. That's how the program becomes impressive on paper and fragile in production.
Keep the rollout focused on ownership
The best rollout checklist is short enough that people use it. It should cover stakeholder alignment, test phases, escalation paths, and the thresholds that decide whether data is fit to publish. It should also make room for exceptions, because not every failed rule means the data is wrong.
The final test is whether the program reduces manual triage. If analysts still spend their mornings reconciling the same broken inputs, the controls aren't operational yet. If owners can see the issue, the threshold, and the fix path without a meeting, the implementation is starting to work.
If you're building or replacing a data quality program, digna can help you monitor critical data elements, validate records inside the database, and track timeliness and schema change without moving production data out of your environment. Visit digna to see how that fits into a real warehouse or pipeline stack.