Robust Data Science Pipelines: Build, Deploy, Monitor
|
6
minuto de lectura

You're probably dealing with one of two situations right now. Either a model in production started acting strangely and nobody can tell whether the issue is feature logic, source data, or a late upstream load. Or your team has a pipeline that “works” most days, but every release feels risky because one schema change, one missing partition, or one malformed file can poison downstream results.
That's the shape of data science pipelines in production. The hard part usually isn't training a model. It's keeping the flow of data trustworthy across ingestion, transformation, feature creation, deployment, and ongoing monitoring. Teams that only focus on orchestration learn this the hard way. A green DAG doesn't guarantee valid data, and a successful job run doesn't guarantee useful model inputs.
Table of Contents
Why Data Science Pipelines Are the Backbone of Modern AI
A lot of AI failures don't begin with bad modeling. They begin with a pipeline that delivered incomplete features, duplicated records, stale aggregates, or mislabeled training data. The model gets blamed because it's visible. The pipeline escapes scrutiny because it's buried under schedulers, scripts, connectors, and warehouse jobs.
That's why I treat data science pipelines as infrastructure, not project glue. They feed experiments, training jobs, batch scoring, online inference features, dashboards, and retraining loops. When they drift, every downstream consumer inherits the damage.

The business signal is clear. The global data pipeline market is valued at USD 10.01 billion in 2024 and projected to reach USD 43.61 billion by 2032, with a CAGR of 19.9%, and 90% of AI and machine learning projects depend directly on these pipelines according to Fortune Business Insights on the data pipeline market. Teams aren't investing in pipeline infrastructure because it's fashionable. They're doing it because AI systems don't survive weak data foundations.
What breaks in real environments
The obvious failures are easy to spot. A task crashes. A file never lands. A connector times out.
The dangerous failures are quieter:
Freshness drift where daily data starts arriving later and later
Semantic drift where a field still exists but its meaning changed upstream
Distribution drift where values stay within type constraints but move outside normal behavior
Partial success where a pipeline writes output, but only for part of the expected scope
Practical rule: If your only health signal is job success, you're not monitoring the pipeline. You're monitoring the scheduler.
Reliable data science pipelines have to answer two questions every day. Did the jobs run? And did they produce data that's still fit for training, scoring, and decision-making?
Unpacking the Data Science Pipeline Concept
The cleanest mental model is a factory line. Raw materials come in from different suppliers. Each station cleans, reshapes, checks, enriches, or assembles something. At the end, you don't want a pile of parts. You want a finished product you can trust.
A data science pipeline works the same way. It takes raw data from applications, logs, files, APIs, event streams, and warehouse tables. Then it turns that data into training sets, features, predictions, and monitored outputs that other systems can use.
More than ETL
A basic ETL job moves and transforms data. That matters, but it's only part of the picture. Data science pipelines usually add steps that standard analytics pipelines don't fully cover:
Feature creation for model-ready inputs
Train and validation dataset generation
Experiment reproducibility
Model packaging and deployment
Post-deployment feedback loops
That difference matters operationally. A broken BI report is painful. A broken model input pipeline can affect ranking, fraud checks, forecasting, triage, or clinical review workflows depending on the domain.
Script versus production pipeline
Data science projects often start with a notebook or a Python script. That's normal. It's also where many reliability problems begin.
A one-off script can be fine for exploration. It's a poor production system because it often depends on local assumptions:
Scenario | What happens |
|---|---|
Notebook workflow | Paths, credentials, package versions, and sampling choices live in one person's environment |
Production pipeline | Inputs, outputs, dependencies, retries, tests, lineage, and ownership are explicit |
Production-grade data science pipelines need repeatability. If the same input arrives tomorrow, the system should run the same logic with controlled changes, known dependencies, and observable outputs. That usually means tools such as Airflow, Dagster, Prefect, Spark, dbt, warehouse-native SQL, CI pipelines, and model serving infrastructure working together rather than a single all-in-one stack.
A pipeline isn't mature because it's automated. It's mature when another engineer can change it safely and tell whether the output is still trustworthy.
That's the standard worth aiming for.
The Seven Core Stages of a Data Science Pipeline
Most production systems look messy in the details, but the lifecycle is consistent. If teams share a common vocabulary for the stages, debugging gets easier and ownership becomes clearer.
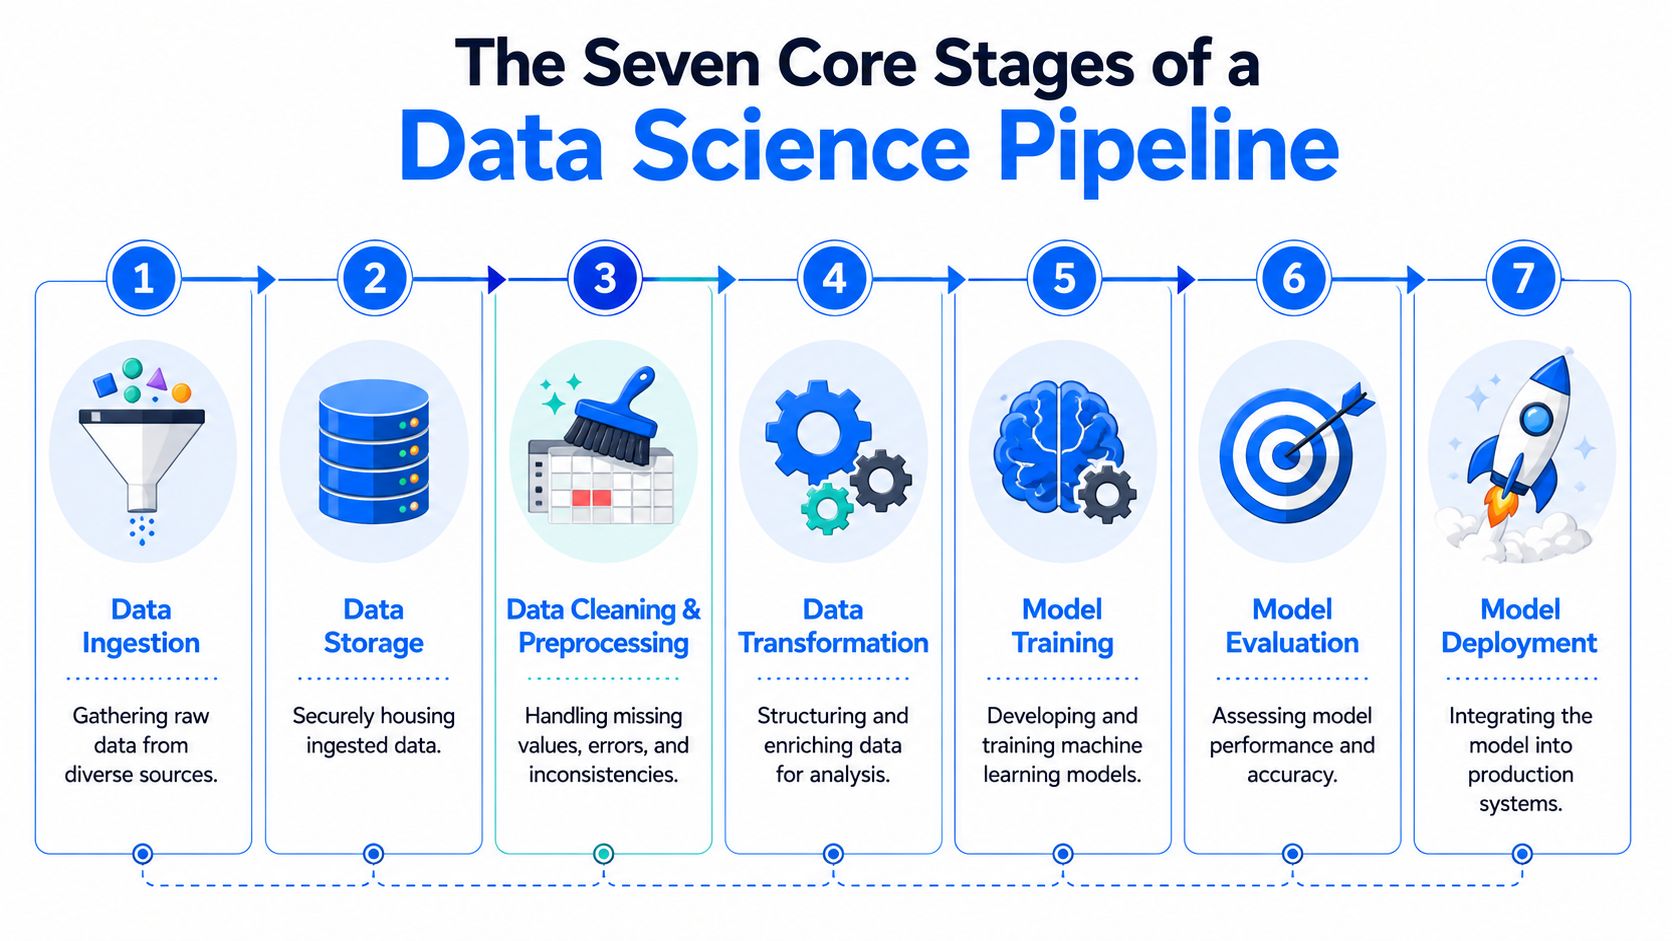
Data ingestion
The pipeline meets reality when data arrives. Data comes from OLTP databases, SaaS tools, CDC streams, object storage, application logs, and APIs. Some sources are structured and stable. Others aren't.
The main decision here is batch, streaming, or both. Batch is simpler to reason about and easier to backfill. Streaming supports low-latency use cases, but it raises the bar for ordering, deduplication, late-arriving events, and checkpoint handling.
Common tools include Kafka, Pub/Sub, Kinesis, Airbyte, Fivetran, custom connectors, and direct warehouse ingestion jobs.
Data storage and integration
Once data lands, it needs a durable home and a shape that downstream consumers can depend on. Teams then make ETL or ELT choices, define raw versus curated layers, and decide how much transformation belongs in Spark jobs versus SQL models.
This stage usually produces:
Raw landing zones for replay and audit
Conformed datasets for shared use
Integrated feature inputs across domains like customer, product, claims, or device data
A good integration layer preserves enough raw detail for reprocessing while giving downstream users stable interfaces.
Before going deeper into later stages, it helps to ground one practical control. Strong data validation practices for production pipelines keep obvious defects from traveling downstream unchecked.
Data processing and feature engineering
Many pipelines grow domain-specific as teams handle missing values, encode categories, build lagged features, aggregate events into windows, calculate ratios, and join behavioral with reference data.
Feature logic often starts in notebooks and then hardens into SQL, Spark, or Python transforms. The failure mode is predictable. Logic gets copied across training and inference paths, then diverges. The fix is also predictable. Centralize feature definitions and version them.
A few patterns hold up well:
Separate raw cleanup from business logic
Keep feature definitions close to tests
Design transformations to be idempotent
Record the data version used for each training run
Here's the embedded walkthrough for the overall lifecycle:
Model training and tuning
Training consumes the processed datasets and turns them into candidate models. The mechanics vary by stack. Some teams use scikit-learn on warehouse extracts. Others use Spark ML, XGBoost, PyTorch, TensorFlow, or managed ML platforms.
The operational concern isn't just hyperparameter tuning. It's reproducibility. If a model underperforms next month, you need to know which code version, which feature set, which training slice, and which parameters produced it.
Model validation and selection
This stage decides what earns the right to move forward. Teams compare candidate models against holdout data, business constraints, explainability requirements, and operational limits such as inference latency or memory usage.
Validation should include more than model metrics. It should also ask whether the underlying data still represents the target process. A highly scored model trained on unstable inputs can still fail in production.
The best candidate model is the one your platform can support safely, not just the one with the best offline score.
Model deployment
Deployment turns an artifact into a service or a scheduled scoring process. Common patterns include batch scoring into a warehouse table, real-time inference behind an API, and hybrid setups where a real-time service calls precomputed features.
This stage needs explicit contracts:
Deployment concern | What to define |
|---|---|
Inputs | Required fields, types, null handling, and freshness expectations |
Outputs | Prediction schema, confidence fields, and write location |
Rollback | Prior model version, trigger conditions, and restore path |
Monitoring and retraining
The pipeline doesn't end at deployment. Production monitoring has to cover serving health, feature freshness, schema stability, data quality, and retraining triggers.
Retraining should happen for a reason, not because a cron job says so. In mature systems, retraining decisions are tied to observed drift, changing business context, or model performance feedback. Otherwise teams just automate churn.
Integrating Pipelines with Data Warehouses and Lakes
Data science pipelines are not typically built in isolation. They are built on top of warehouse tables, lake storage, or some combination of both. The architecture choice affects latency, governance, experimentation speed, and the amount of duplicated logic you have to maintain.

Warehouse first patterns
Warehouses work best when your inputs are already fairly structured and the business needs governed, queryable datasets. Snowflake, BigQuery, Redshift, and similar systems are strong choices when analytics engineering and ML feature generation need to share curated tables.
In this pattern, the warehouse usually becomes the source of truth for:
Standardized entities such as customer, account, provider, or merchant
Curated features used repeatedly across teams
Model outputs written back for BI consumption and operational reporting
A warehouse-first setup makes governance easier. Schema contracts, SQL-based transformations, access control, and auditability are usually clearer than in ad hoc file-based systems. It also pairs well with teams planning a warehouse to lake migration strategy for mixed workloads.
Lake first patterns
Lakes are better when teams need flexibility around raw files, semi-structured data, logs, documents, or large experimental datasets. They let data scientists explore source-level detail without forcing every signal into a rigid warehouse schema too early.
This works well for use cases such as:
Event-heavy feature generation
Model development on raw telemetry
Text, image, or document pipelines
Reprocessing historical data after feature logic changes
The trade-off is operational discipline. Lakes give freedom, but they also make it easier to accumulate inconsistent formats, duplicate assets, and weak ownership boundaries.
What works in mixed environments
Most enterprises end up with a hybrid model. Raw and high-volume data lands in a lake. Curated, governed, business-facing outputs live in the warehouse. The pipeline moves between both.
A practical split often looks like this:
Layer | Best use |
|---|---|
Lake | Raw ingestion, replay, experimentation, and large-scale intermediate processing |
Warehouse | Trusted dimensions, curated facts, reusable features, and downstream reporting |
Pipeline logic | Movement, transformation, validation, and serving between the two |
Keep experimental freedom upstream. Keep trusted business consumption downstream.
That separation avoids a common mistake. Teams either force everything into the warehouse too early, which slows experimentation, or they leave too much in the lake, which makes downstream analytics and compliance harder than they need to be.
Beyond Orchestration Data Quality and Observability
A scheduler can tell you that tasks ran. It can't tell you whether the records were sensible, whether a critical field flattened to near-constant values, or whether upstream producers changed business meaning while preserving the schema.
That's why orchestration alone isn't enough.

What silent failures look like
The operational burden is larger than many teams admit. Data pipelines face persistent instability, with 30% to 40% failing every week. These failures contribute to an average of 67 monthly data incidents per organization, with each incident taking approximately 15 hours to resolve, according to Folio3's roundup of data engineering statistics.
Those numbers only describe visible incidents. In practice, some of the most expensive failures aren't hard failures at all. They're silent quality shifts:
A source starts sending empty strings instead of nulls
An enum gains a new category that downstream logic ignores
A timestamp arrives in a different timezone convention
A feature distribution changes slowly enough that threshold rules miss it
When this happens in ML systems, the model can keep serving predictions while confidence in the output steadily erodes.
The four signals that matter
Teams need one operational view that combines quality and observability instead of splitting them across unrelated tools and dashboards. I'd treat these four signals as indispensable.
Data quality
This is record-level correctness. Are required fields populated? Do values meet business rules? Do foreign keys map correctly? Are calculated fields internally consistent?
Explicit validations are most important. Quality checks should live close to the data they protect, not only in application code or downstream notebooks.
Timeliness
Fresh data that arrives too late is still a production issue. Timeliness monitoring should track expected arrival patterns, delayed partitions, incomplete loads, and late source updates.
For batch environments, that usually means schedule-aware checks. For event pipelines, it means watching ingestion lag and out-of-order behavior.
Schema integrity
A schema break is obvious when a column disappears and a job crashes. The harder case is additive or type-adjacent change that doesn't fail fast but still changes meaning. Teams should watch for added columns, removed columns, type modifications, and field-level contract drift.
Anomaly detection
Rules catch known problems. Anomaly detection catches unexpected changes in volume, distribution, patterns, and trend behavior. You need both.
A useful comparison looks like this:
Signal type | Good at catching | Weak at catching |
|---|---|---|
Static rules | Null spikes, invalid ranges, format violations | New drift patterns you didn't predict |
Anomaly detection | Unexpected shifts in behavior and distribution | Explicit business logic errors unless encoded |
For teams comparing the two disciplines directly, this guide on data observability versus data quality in practice is a useful framing device because it treats them as complementary controls rather than competing categories.
Why unified monitoring beats tool sprawl
Fragmented setups create their own incidents. One tool watches freshness. Another checks schema. A third runs validations. A fourth sends alerts. Engineers then spend incident time reconciling conflicting signals and chasing ownership across systems.
What works better is a unified operating model:
One place to inspect health across pipeline stages
One incident view linking freshness, schema, quality, and anomalies
One ownership model for escalation and remediation
One audit trail for what changed and when
If an engineer needs four dashboards to explain one bad prediction, the monitoring design is part of the problem.
In private cloud and on-prem environments, that unification matters even more because teams often can't rely on fully managed cloud-native monitoring services. They need controls that fit enterprise boundaries without forcing extra data movement.
On-Prem and Private Cloud Pipeline Considerations
On-prem and private cloud environments change the design priorities. The usual public cloud advice doesn't always transfer well when the data can't leave the network, procurement cycles are slower, and security reviews are stricter.
That doesn't make strong data science pipelines harder by default. It just means the architecture has to respect local constraints from the start.

Security and architecture constraints
In regulated sectors, teams usually want computation to happen where the data already resides. That reduces security exposure, avoids unnecessary copying, and simplifies governance reviews. In practice, that often means in-database transformations, local metric computation, warehouse-native validation, and controlled service boundaries around model training or inference.
The main architectural questions are straightforward:
Can this component run without exporting sensitive data elsewhere
Can security teams audit who touched what
Can platform teams patch and operate it with existing controls
Can the pipeline fail safely when a dependency degrades
Open formats, explicit contracts, and minimal data movement prove their worth.
Capacity planning and total cost
On-prem teams can't solve every throughput problem by clicking “scale up.” Capacity planning matters earlier, and it has to be based on realistic workloads. Google's guidance on benchmarking Dataflow jobs with throughput per vCPU core is useful here because it stresses testing with expected data types, sizes, network behavior, and real source and sink conditions rather than idealized benchmarks.
Cost evaluation also has to include failure behavior. As Databricks explains in its guidance on evaluating pipeline cost to performance, total compute costs and failure rates both belong in the calculation because frequent job failures force reprocessing and delay time-to-value.
What holds up in enterprise environments
The strongest patterns I've seen in enterprise settings are boring in the best way. They favor predictability over novelty.
Modular services: Keep ingestion, transformation, validation, and serving loosely coupled so one failure doesn't take down everything.
Deterministic backfills: Re-run logic for a defined window with the same code and clear lineage.
Local observability: Store health signals where engineers can inspect them without crossing security boundaries.
Explicit ownership: Every pipeline, table, and model input needs a named team responsible for incidents.
Enterprise reliability usually comes from disciplined boundaries, not fancy architecture diagrams.
Private cloud and on-prem systems reward designs that are inspectable, benchmarked, and conservative about moving data around. That's especially true when AI pipelines depend on shared warehouse and lake infrastructure used by many teams at once.
Conclusion Building Your Resilient Pipeline Strategy
Reliable data science pipelines aren't just scheduled workflows. They're operating systems for how raw data becomes trusted training sets, production features, model outputs, and business decisions.
The build phase gets most of the attention. The maintenance phase decides whether the pipeline keeps delivering value. That's where many teams fall short. They automate movement, but not trust. They monitor tasks, but not data health. They add tools, but not clarity.
A stronger strategy is simpler to describe than to implement. Build clear stages. Keep storage and serving choices aligned with actual workloads. Treat data quality, timeliness, schema integrity, and anomaly detection as one operational discipline. In private environments, keep computation close to the data and benchmark with realistic conditions.
The best next step usually isn't launching a brand-new platform project. It's auditing the most business-critical pipeline you already have. Check where it can fail undetected. Check how quickly your team can explain bad output. Check whether observability and quality are still split across too many places.
If you want a practical way to unify anomaly detection, record-level validation, timeliness monitoring, and schema tracking without moving data outside your environment, take a look at digna. It's built for teams running modern data quality and observability inside their own databases, private cloud, or on-prem infrastructure.


