Define Data Cleaning: A Practical Guide for 2026
|
6
min read

It's 8:07 a.m. The dashboard looked fine yesterday. This morning, the sales forecast has fallen off a cliff, a regional KPI has split into two categories that shouldn't exist, and someone from finance is already asking whether the warehouse load failed overnight.
Most of the time, nothing crashed. A source field changed. A date format drifted. A country label flipped from one convention to another. A duplicate ingestion job ran and inflated counts. The dangerous part is how ordinary these failures look. They don't announce themselves with a hard error. They show up as confident nonsense.
That's why it's not enough to define data cleaning as “fixing bad rows.” In practice, data cleaning is the work that keeps reports, models, alerts, and operational decisions attached to reality. If you want a useful companion piece on the broader idea of trustworthy inputs, Market Edge on data quality is worth reading. For teams working close to dashboards and reporting pipelines, this perspective on why business intelligence tools are only as good as data quality is also directly relevant.
Table of Contents
The Silent Failure Behind Your Broken Dashboard
The most expensive data failures are usually quiet.
A common one looks like this. Revenue is steady in the source system, but the executive dashboard suddenly shows a collapse in one market. The BI developer checks the transformation layer. The warehouse tables loaded. The SQL didn't fail. Hours later, someone finds the issue. One upstream application stopped sending USA and started sending United States. No crash. No pager. Just fragmented dimensions and bad rollups.
Why this kind of failure is hard to catch
Static checks catch obvious breakage. They don't reliably catch semantic drift.
If your pipeline only verifies that a column exists and contains strings, both values pass. The data is syntactically valid and operationally wrong. That's the exact space where teams get hurt. Analysts spend the morning reconciling numbers. Executives lose trust in the dashboard. Engineers patch the symptom and move on, without fixing the conditions that allowed it.
Dirty data rarely fails loudly. It usually passes through systems looking valid enough to be trusted.
Often, people ask to define data cleaning as if it's a glossary term. In real systems, the better definition comes from the failure mode it prevents. Data cleaning is the discipline of making data usable, comparable, and trustworthy before it reaches analytics, reporting, or models.
Why “cleanup” is the wrong mental model
The word cleanup suggests a task with an end date. Production data doesn't behave that way.
Source systems evolve. Human operators enter values inconsistently. APIs change field behavior. New null patterns appear after a product launch. A one-time cleanup script can fix yesterday's mess and still leave you blind to tomorrow's. That's why experienced teams stop treating data cleaning like spreadsheet hygiene and start treating it like a reliability function.
When a dashboard breaks without a system outage, you're usually seeing a data quality problem that slipped past validation. The fix is not just better SQL. It's a stronger cleaning process tied to monitoring, validation, and fast feedback.
Defining Data Cleaning Through Core Tasks
If you want to define data cleaning in a way that holds up in production, define it by the jobs it performs.

The technical definition is precise. Data cleaning is the systematic process of identifying, correcting, and removing structural errors, duplicate records, and irrelevant observations to ensure data meets the “Complete, Consistent, Correct” quality standards required for reliable statistical inference, as described in TechnologyAdvice's explanation of data cleaning. If you're narrowing this to implementation details, record-level checks matter too, which is why a guide on what data validation is sits so close to cleaning work in real pipelines.
What the definition means in practice
Think of a dataset like a house you're renovating for actual use, not for a photo. You don't just sweep the floor. You remove what doesn't belong, repair what's broken, standardize what should match, and confirm the structure is sound before anyone moves in.
That's what good cleaning does to data. It turns raw input into something downstream systems can trust.
The core tasks that actually clean data
Some cleaning work is mechanical. Some is judgment-heavy. The hard part is knowing which is which.
Handle missing values deliberately: Empty fields aren't all the same. A missing phone number, a missing diagnosis code, and a missing transaction timestamp have very different consequences. Sometimes you remove the record. Sometimes you enrich it. Sometimes you keep the null because the absence is meaningful.
Remove duplicates carefully: Duplicate records inflate counts, distort cohorts, and break attribution logic. In multi-source environments, duplicates are often near-matches rather than exact copies, so you need matching rules based on stable identifiers rather than display names.
Correct structural errors: Typos, casing drift, stray whitespace, and inconsistent naming conventions create fake categories.
new york,New York, andNEW YORKmay look trivial, but they split aggregations and quietly corrupt reporting.Standardize formats: Dates, currencies, units, and categorical labels have to obey one format. If one source uses
YYYY-MM-DDand another sends local variations, sorting and joining become unreliable fast.Validate against business rules: Some values are technically well-formed and still impossible. Negative quantities where refunds aren't allowed. End dates before start dates. Status values that shouldn't coexist in the same record.
Here's a practical comparison:
Cleaning task | What it fixes | What goes wrong if you skip it |
|---|---|---|
Missing value handling | Gaps and nulls | Broken joins, biased analysis, silent exclusions |
Deduplication | Repeated entities or events | Inflated revenue, user counts, conversion rates |
Structural correction | Typos and label drift | Fragmented dimensions and faulty grouping |
Standardization | Mixed formats and units | Failed parsing, bad filters, unreliable comparisons |
Validation | Rule-breaking records | Plausible-looking outputs that are still wrong |
Practical rule: If a cleaning decision changes business meaning, don't automate it blindly. Put a review step around it.
What doesn't work is treating all five tasks as one generic “cleanup” pass. Good teams separate them. They profile first, apply targeted rules, and keep raw data intact so they can trace every correction later.
The Trillion-Dollar Cost of Dirty Data
Dirty data isn't a nuisance line item. It's a business loss multiplier.

The numbers are already large enough that nobody should have to oversell the case. Poor data quality imposes a staggering financial burden on U.S. businesses, costing approximately $3.1 trillion annually. Further research indicates that companies estimate losing an average of 27 percent of their revenue due to data quality issues, according to DLC's review of enterprise data cleaning challenges and impact. If you need a way to frame the operational exposure internally, a data downtime cost calculator can help translate abstract quality problems into business risk.
Why finance notices before engineering does
Engineering often sees the symptom as a technical defect. Finance sees it as margin erosion, delayed reporting, rework, and bad decisions.
A stale customer master causes duplicate outreach. Inaccurate inventory data creates false stock assumptions. Broken reference data spills into reporting, then into forecasts, then into planning. By the time someone opens a ticket, the cost has already moved through multiple teams.
Where the losses show up
These losses rarely sit in one obvious bucket. They spread.
Revenue leakage: Sales and marketing teams work from incomplete or duplicated records. Campaign targeting degrades. Account ownership gets messy. Forecasts become less reliable.
Operational drag: Analysts and engineers spend time reconciling outputs instead of shipping work. Dashboards need caveats. Manual checks pile up before every executive review.
Compliance exposure: In regulated environments, bad records create audit headaches. If a field is wrong, late, or inconsistent across systems, the issue isn't only analytical. It can become a governance problem.
AI failure: Models trained on low-quality inputs don't become smart by accident. They become confidently wrong.
A short decision lens helps:
Business area | Dirty data effect | Typical result |
|---|---|---|
Reporting | Inconsistent dimensions and late loads | Broken dashboards and stale KPIs |
Operations | Manual correction and backtracking | Slower teams and avoidable rework |
Governance | Incomplete or conflicting records | Audit friction and control gaps |
AI and ML | Poor training and inference inputs | Unreliable predictions |
The practical takeaway is simple. Data cleaning is not overhead. It's a control surface for revenue protection, operational stability, and decision quality.
A Standard Workflow for Cleaning Data
Good cleaning work follows a repeatable workflow. Ad hoc fixes are fast in the moment and expensive later.
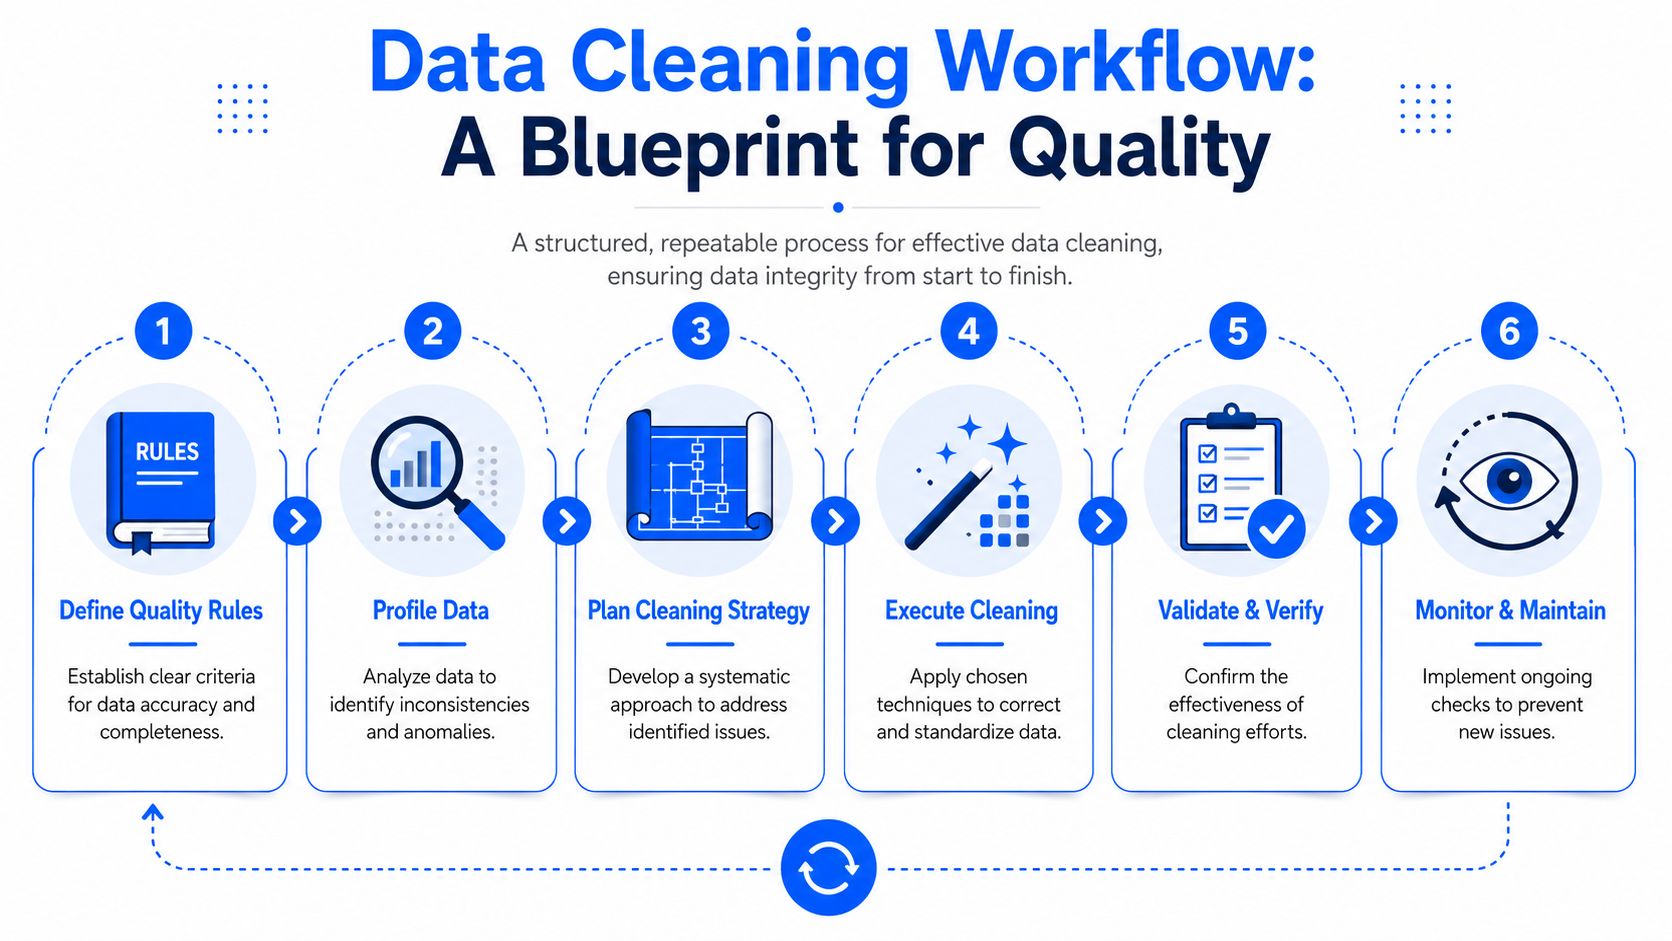
A solid plan should cover more than duplicate removal and format fixes. Expert technical specifications for data cleaning mandate a “thorough data cleaning plan” that integrates eight critical steps: removing unwanted observations, unifying structure, standardizing data, removing outliers, fixing cross-set errors, resolving syntax errors, handling missing data, and final validation, as outlined in Monte Carlo's data cleaning best practices.
Start with profiling, not fixing
The first mistake junior teams make is editing before they inspect.
Profiling tells you what kind of dataset you have. Look at null patterns, uniqueness, value distributions, schema consistency, category drift, and cross-table relationships. SQL is enough for a lot of this. Pandas, dbt tests, warehouse queries, and targeted sampling all work if they answer the same question: what is wrong, where, and how often?
A practical sequence looks like this:
Define quality rules: Decide what valid means before touching the data.
Profile the dataset: Measure duplicates, nulls, type inconsistencies, and odd values.
Choose the cleaning strategy: Different defects need different handling rules.
Profile first. Otherwise you'll fix the rows that look ugly and miss the defect that actually breaks the metric.
Clean, validate, then document
Once you know the defects, apply the smallest correction that restores reliability.
Use SQL for standardization and joins. Use Python for fuzzy matching, parsing, and row-level transformation when SQL gets awkward. Use ETL or ELT tooling when the workflow needs to run repeatedly and auditably. The tool matters less than the discipline.
The back half of the workflow is where mature teams separate themselves:
Execute the cleaning: Remove unwanted observations, unify structure, standardize, resolve syntax and type errors, and fix cross-set mismatches.
Validate the outcome: Re-run tests after every major transformation. Confirm row counts, uniqueness, referential integrity, and business rules.
Report what changed: Document what was removed, changed, imputed, merged, or flagged.
This is the workflow many teams skip:
Stage | Main question | Deliverable |
|---|---|---|
Profile | What defects exist? | Baseline quality assessment |
Clean | What correction is appropriate? | Corrected dataset or transformation logic |
Validate | Did the fix work without collateral damage? | Passed checks and spot reviews |
Report | Can another person reproduce this? | Change log and cleaning rules |
What doesn't work is “clean until the chart looks right.” That produces brittle pipelines and arguments nobody can settle later.
Common Pitfalls That Invalidate Your Data
Cleaning data can improve the dataset and still ruin the analysis.

That sounds contradictory until you've seen it happen. Teams remove “bad” outliers that were real events. They fill missing values with convenient defaults that flatten variation and inject bias. They standardize categories without checking lineage, then discover later that two labels were supposed to stay distinct.
The failure rate attached to weak inputs is not small. Data cleaning processes eliminate approximately 20–30% of errors in raw datasets, but an estimated 60% of data science projects fail primarily due to poor data quality originating from uncleaned or improperly cleaned input sources, according to this report on data quality failures and cleaning impact.
When cleaning creates new problems
Three mistakes show up constantly in production teams.
First, over-cleaning. If every unusual value gets removed, you erase legitimate behavior. Fraud spikes, one-off enterprise purchases, and rare medical events often look like noise until the business context says otherwise.
Second, bad handling of missingness. If missing values are systematic, simple imputation can manufacture certainty where none exists. A field that is absent for one segment but present for another can bias a model or report.
Third, cleaning without acquisition context. Campaign and attribution datasets are a classic example. If tracking parameters are inconsistent at capture time, the downstream cleanup gets harder and less defensible. A concise reference on UTM best practices is useful here because it shows how upstream discipline prevents downstream cleanup from turning into guesswork.
Some “bad data” is actually a valid signal with poor documentation around it.
What disciplined teams do differently
They don't treat cleaning as a cosmetic step. They preserve traceability.
They review lineage: Before changing a value, they ask where it came from and what transformation history already touched it.
They document assumptions: If they impute, merge, cap, or drop values, they record the rule and the rationale.
They keep raw copies: Reversibility matters when someone challenges a metric later.
They involve domain owners: A strange value in a hospital dataset or trading dataset may be rare but valid.
A quick anti-pattern table helps:
Pitfall | Why it hurts | Better approach |
|---|---|---|
Over-cleaning outliers | Removes valid extremes | Flag first, delete only with context |
Blanket imputation | Introduces bias | Assess why values are missing |
No documentation | Kills reproducibility | Log every rule and exception |
One-time fix mentality | Lets defects return | Build repeatable checks |
Teams get in trouble when they optimize for a neat table instead of a faithful dataset.
Beyond Cleaning From Static Fixes to Live Observability
The old mental model says data cleaning happens before analysis. In live systems, that boundary doesn't hold.

Production data keeps moving. Schemas evolve. Freshness shifts. Category distributions drift. A batch cleanup can leave the dataset valid at noon and unreliable by evening. That's why the strongest modern definition of data cleaning includes monitoring. It isn't just repair. It's ongoing detection, validation, and correction inside a changing pipeline.
The gap in most guidance is already documented. Existing guides fail to address the critical angle that data cleaning is a continuous, cyclical observability process. “Repaired data can lead to new data exceptions,” requiring iterative validation and real-time monitoring to catch silent drift and schema changes that break downstream AI models, as described in this review of continuous data quality and observability. If you want the broader framing, this overview of what data observability is connects the operational side well.
Why one-time cleanup no longer holds
A static process assumes defects are already present and waiting to be removed. Real pipelines generate new defects continuously.
A source team changes a column type. A vendor starts sending late files. A mobile app release alters event payloads. A dimension table gains new categories without warning. None of these are unusual. They're normal operating conditions in modern data systems.
That changes the practical answer when people ask you to define data cleaning. The useful answer now is this: data cleaning is the ongoing work of keeping data complete, consistent, correct, and usable as conditions change.
What modern monitoring adds
Traditional cleaning answers, “How do we fix this dataset?”
Observability adds a second question. “How do we know the next dataset is drifting before a dashboard or model breaks?”
That means watching for:
Anomalies in behavior: Sudden shifts in row counts, distributions, or metric patterns.
Timeliness issues: Loads that arrive late, partially, or not at all.
Schema changes: Added columns, removed columns, and type modifications that break assumptions.
Validation failures: Record-level rules that should never go unnoticed.
The strongest data cleaning systems don't wait for a stakeholder to find the problem in a chart.
This is the practical evolution of the discipline. Cleaning still includes deduplication, standardization, missing value handling, and validation. But in production, those tasks need a feedback loop. You clean, observe, validate again, and respond to new exceptions as they appear.
That's the shift from static hygiene to operational reliability.
If your team is tired of finding data issues only after a dashboard breaks or a model starts drifting, digna is built for that reality. It helps teams detect anomalies, validate records, monitor timeliness, and track schema changes inside customer-controlled environments, so data cleaning becomes an ongoing reliability practice instead of a recurring fire drill.


