Why Databricks Jobs Become Unpredictable - And How Teams Detect Instability Early
|
5
min read
Databricks environments are built for elasticity. Clusters scale, workloads evolve, and data volumes grow continuously. This flexibility is powerful; however, it also introduces a challenge many enterprises eventually face:
Jobs that once behaved predictably begin to fluctuate in runtime, DBU usage, and cost.
Pipelines still succeed. Dashboards are still updated. Nothing appears “broken.” Yet operational predictability erodes.
Understanding why this happens and how to detect it early is critical for teams running Databricks as a production data and AI platform.
Instability in Databricks Is About Behavior, Not Failure
In traditional systems, instability often meant system overload or hardware limits. Databricks instability is different.
Because clusters auto-scale and workloads distribute dynamically, instability shows up as:
Rising DBU consumption for the same jobs
Increasing variance in runtime duration
Unpredictable task performance
More frequent cluster resizing events
Jobs may complete successfully, yet their behavior changes over time. These changes are often invisible in dashboards focused only on success/failure.
What Causes Databricks Jobs to Become Unpredictable?
1. Data Growth Alters Execution Plans
As data volumes grow:
Shuffles increase
Joins become heavier
Partition strategies degrade
Caching effectiveness changes
Even without code changes, Spark execution plans shift. This leads to higher DBU usage and longer runtimes.
The job still “works,” but it consumes more compute than before.
2. Logic Drift in Notebooks and Pipelines
Databricks workloads evolve rapidly.
Teams add:
Extra joins
Additional aggregations
New ML feature calculations
Broader filters
Each modification adds overhead. Individually, changes look minor. Over months, they fundamentally alter workload behavior.
3. Auto-Scaling Masks Resource Problems
Auto-scaling is both a strength and a blind spot.
When workloads demand more compute:
Clusters expand automatically
Jobs finish successfully
Costs increase silently
Instead of failing, the system absorbs inefficiencies — hiding performance regressions behind elastic infrastructure.
The first signal often appears as rising DBU consumption, not an error.
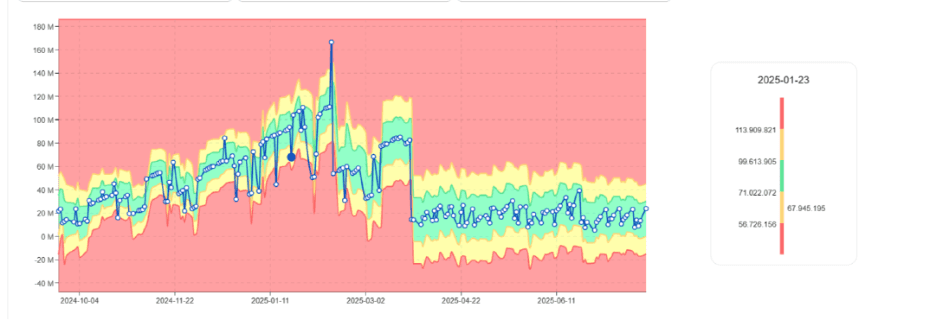
DBU usage trend gradually increasing for the same job
4. Skew and Shuffle Imbalance
Data skew causes certain tasks to process disproportionate amounts of data.
In Databricks this manifests as:
Long-running tasks
Stragglers
Increased stage duration variance
Because Spark distributes tasks dynamically, skew produces unstable runtimes and unpredictable DBU consumption.
5. Retry Behavior and Hidden Failures
Task retries are common in distributed systems.
Transient issues, memory pressure, or executor loss can trigger retries that:
Increase runtime
Inflate DBU consumption
Add volatility
Jobs succeed, but instability increases.
6. Seasonality in Workloads
Databricks jobs often reflect business cycles:
Month-end processing
Weekly reporting peaks
Model retraining schedules
Without modeling these patterns, teams either ignore anomalies or get overwhelmed by false alerts.
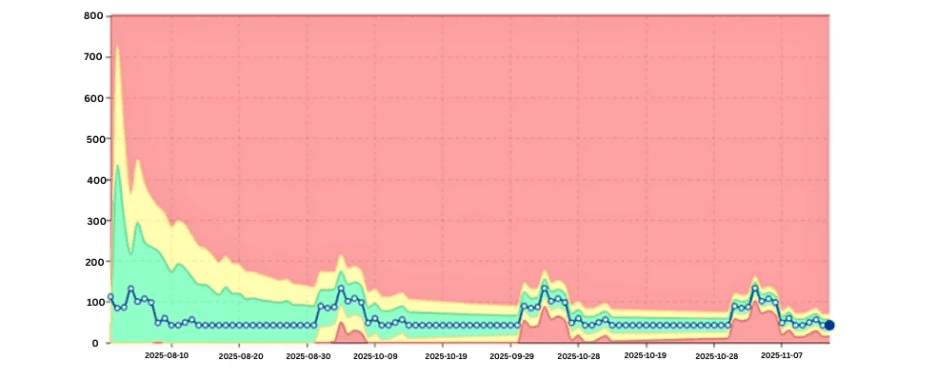
Seasonal DBU pattern with expected peaks
Why Traditional Monitoring Misses Early Signals
Most teams rely on:
Job success/failure metrics
Cost dashboards
Cluster utilization views
These tools show outcomes, not behavioral change.
They do not reveal:
Jobs becoming more expensive over time
Rising variability in runtime
Structural changes in workload execution
Instability begins long before thresholds are crossed.
The Shift to Behavioral Monitoring
Detecting instability early requires analyzing how workloads behave over time, not just whether they succeed.
Key signals include:
DBU usage trends
Runtime evolution
Variance in task duration
Cluster scaling frequency
By turning these metrics into time-series data, teams can identify drift, volatility, and structural change.
Detecting Instability Early
Learning Normal Job Behavior
Instead of fixed DBU thresholds, modern approaches learn:
Typical DBU range per job
Expected runtime patterns
Normal cluster behavior
As workloads stabilize, acceptable behavior ranges narrow.
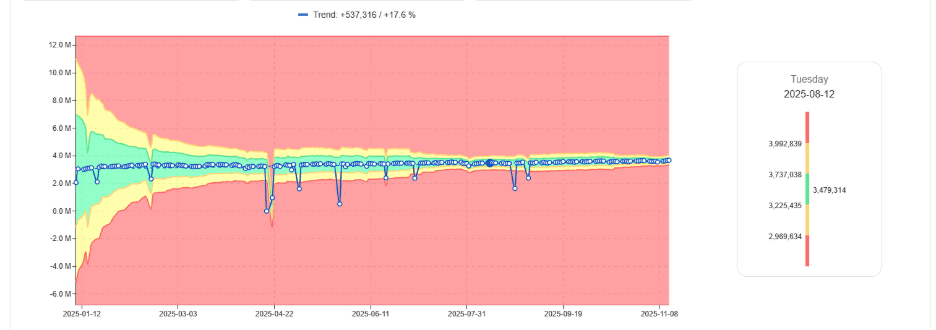
Learned normal DBU band narrowing over time
Spotting Gradual DBU Drift
One of the biggest cost drivers is slow DBU growth.
By comparing current usage to historical baselines, teams can identify which jobs are consuming progressively more compute.
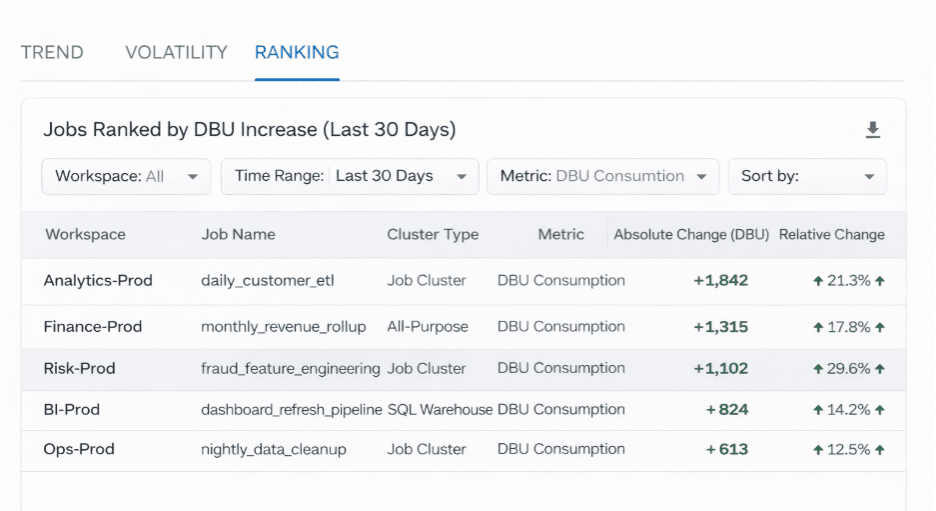
Jobs ranked by month-over-month DBU increase
Measuring Runtime Volatility
Even if average runtime stays constant, high variance signals instability.
Volatile jobs are harder to plan for and more likely to cause downstream delays.
Accounting for Seasonality
Behavioral systems distinguish expected cyclical peaks from genuine anomalies, reducing alert noise.
Where digna Fits
digna analyzes Databricks workload metrics such as DBU consumption, runtime, and volume behavior over time. Instead of static limits, it uses AI to learn normal patterns and detect implausible deviations early — whether sudden spikes or gradual drift.
This allows teams to surface issues before they appear in cost reports or SLA breaches.
More about this anomaly-driven approach can be found:
digna Data Anomalies | Watch Demo
Why Early Detection Matters
When instability is detected early, organizations can:
Optimize queries before costs escalate
Stabilize pipelines before SLAs are impacted
Reduce firefighting
Improve predictability for FinOps teams
Final Thought
Databricks jobs rarely fail outright. They become unpredictable.
That unpredictability is visible in changing DBU behavior, runtime variability, and evolving execution patterns, signals that static monitoring cannot capture.
Teams that adopt behavioral monitoring gain early visibility into instability, maintaining control as their Databricks environments scale.


