Databricks Data Quality Monitoring: A Practical Guide
|
9
min read
The failure never looks dramatic at first. A Databricks lakehouse can look clean on every dashboard, yet a gold table feeding a revenue model can miss late-arriving records for days or weeks, and the first person to notice might be finance, not data engineering. That's why databricks data quality monitoring has to be treated as a layered discipline, not a single toggle.
Teams usually start with a few checks at write time, then realize that curated tables still drift, schema changes still sneak through, and downstream consumers still trust bad data until someone complains. Databricks gives you enough native surface area to build the right layers close to the data, and that matters in environments where storage, compute, governance, and orchestration all live together. For a practical reminder of how financial teams think about this problem, tips for reliable financial data is a useful external reference because it keeps the focus on trust, auditability, and downstream impact rather than just technical checks.
Table of Contents
Why Data Quality Monitoring on Databricks Is Different
The Native Building Blocks Inside Databricks
Start with write-time enforcement
Monitor curated tables continuously
Use the layered pattern on purpose
Choosing Between In-Database Tools and External Platforms
Key Metrics to Monitor on Databricks
Freshness and timeliness
Completeness and counts
Statistical anomalies and schema drift
Business-rule validation
Alerting, Lineage, and Remediation Workflows
Adding a Dedicated Observability Layer with digna
Fit the module to the monitoring problem
Keep data inside the environment
Use it as an overlay, not a substitute
A Starter Checklist for Your Databricks Quality Program
Why Data Quality Monitoring on Databricks Is Different
A lakehouse can be healthy in the narrow sense and still be lying to the business. A table can refresh on time, pass schema checks, and still be missing late-arriving records that matter to a revenue forecast. That's the kind of failure that's hard to catch if you only validate at ingestion and never watch curated tables after they land.
Databricks is different because the platform bundles Delta storage, compute, Unity Catalog governance, and pipeline orchestration in one place. That gives data teams a chance to keep quality controls close to the data instead of scattering them across separate tools and disconnected alerting paths. It also means monitoring has a wider blast radius, because one platform can serve analytics, AI features, and operational consumption at the same time.
The practical split is between one-off checks and continuous observability. One-off checks are what stop bad records from entering bronze or silver tables. Continuous monitoring is what catches drift in gold tables, where data may still be structurally valid but no longer trustworthy.
Practical rule: if a table is consumed by humans, models, or dashboards, treat it as a monitored asset, not just a successful job output.
That's the mindset Databricks teams need if they want to avoid silent degradation. The platform can host the checks, lineage, and alerts close to the workload, but no single native feature covers every layer with equal depth. The strongest programs combine write-time enforcement, transformation-time validation, and post-load monitoring so that a bad upstream feed doesn't become a downstream business problem.
That layered view is also why data quality on Databricks can't be copied from a generic warehouse playbook. The same environment can support ingestion jobs, curated analytical tables, and ML inference outputs, so the monitoring surface is broader than a single report table. A finance dashboard, for example, may only expose the symptom, while the actual defect started in a bronze feed several hops earlier.
The Native Building Blocks Inside Databricks
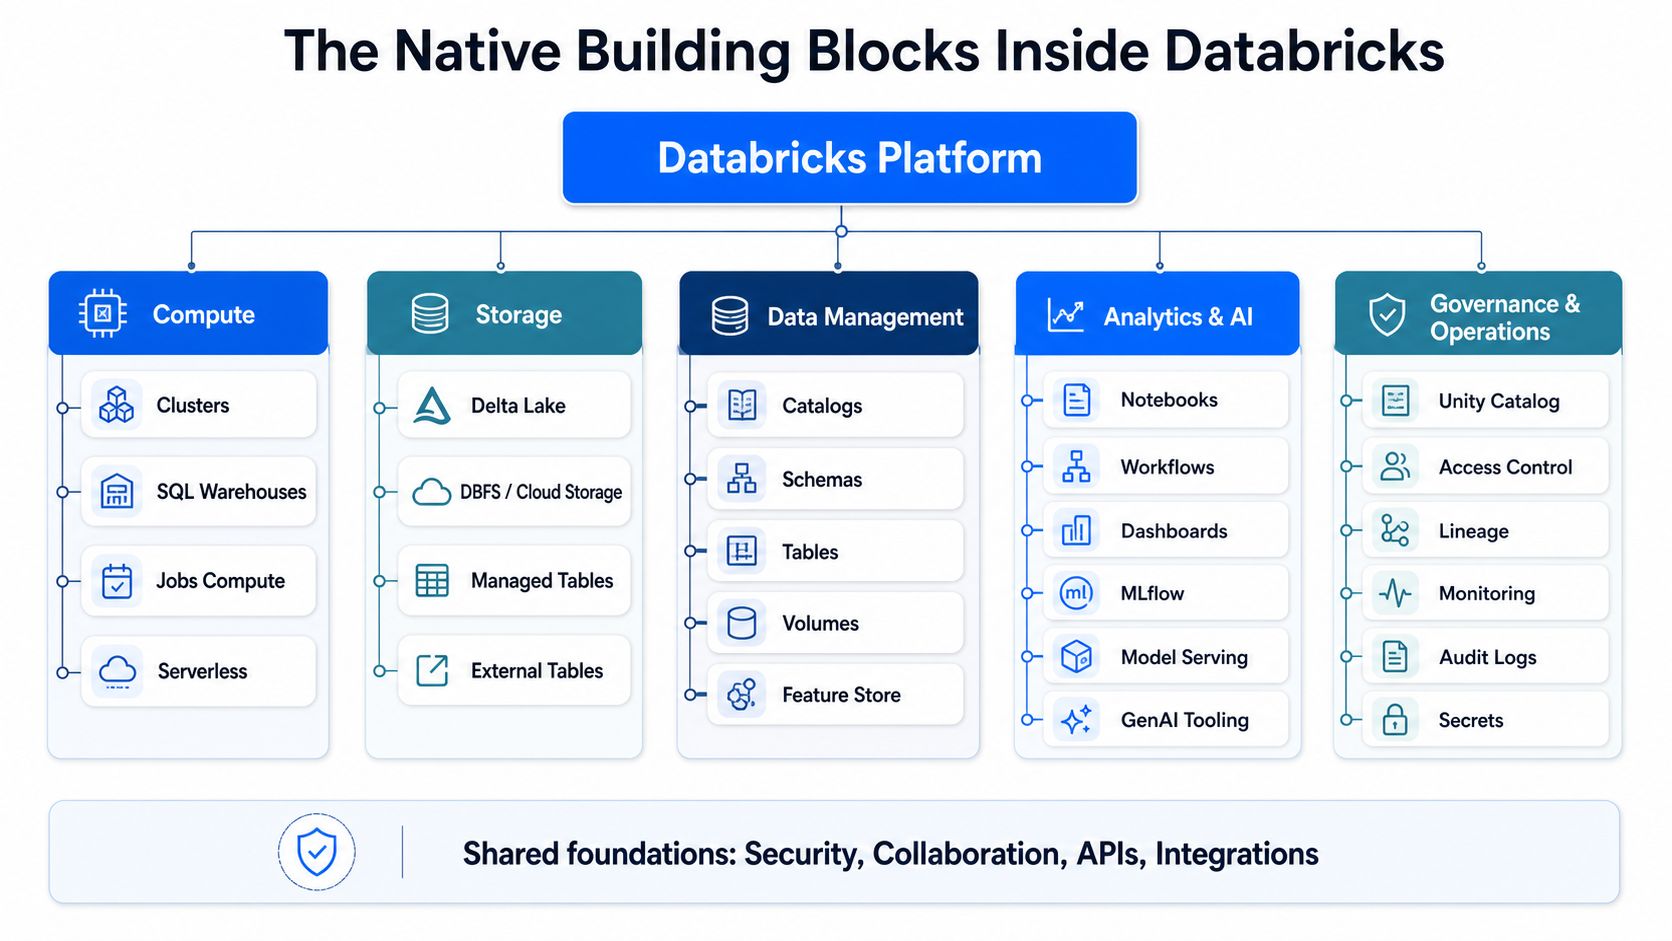
The cleanest way to think about the native stack is as three layers of control plus one monitoring surface. Delta Lake constraints and validate enforce rules at write time. Delta Live Tables expectations let you define declarative checks during pipeline execution. Unity Catalog Data Quality Monitoring watches the table estate continuously. System tables and Lakehouse Monitoring add profiling, drift, and operational context.
Start with write-time enforcement
Delta constraints and validation belong at ingestion and transformation boundaries. Their job is to stop obviously bad records before they spread through the estate. That is where deterministic logic matters most, because a violated rule should fail fast or be quarantined, not quietly accepted and explained later in a dashboard review.
DLT expectations fit the same control plane, but at pipeline execution time. They're best when the rule belongs to the transformation itself, for example when a derived field must never be null or a value must stay within a valid domain. The point is to keep the logic near the transformation that creates the data, not buried in a downstream audit job.
Monitor curated tables continuously
Unity Catalog Data Quality Monitoring is built for the opposite problem, the slow failure that doesn't trip an obvious rule. Microsoft's Databricks documentation says it automatically evaluates freshness and completeness for each table, can monitor all tables in a schema, creates a background job, and uses smart scanning to decide when tables should be scanned rather than requiring manual scheduling (Databricks Lakehouse Monitoring). That makes it useful for curated tables that need ongoing scrutiny without custom per-table scheduling.
The profiling side is more detailed than many teams realize. Databricks profiling captures summary statistics such as nulls, zeros, counts, means, min/max values, standard deviation, and up to 1,000 quantiles per column, while drift metrics compare each window against a baseline or the prior window to detect gradual or abrupt shifts (Databricks documentation on data quality monitoring). The same reference material also shows operational impact data in system tables, including the number of queries run on affected downstream tables over the last 30 days, listed as 120 in the schema example. That's useful because the platform isn't only telling you that something changed, it's telling you where the blast radius is.
Operational insight: write-time checks prevent bad records, monitoring tells you when good-looking data becomes suspicious.
Use the layered pattern on purpose
The Databricks ecosystem guidance that holds up best in practice is layered. Apply schema and rule validation at ingestion, quarantine violations, clean and transform in bronze and silver, then monitor gold tables continuously for drift, freshness, completeness, and statistical anomalies (layered Databricks guidance). That sequencing matters because each layer answers a different question, and trying to make one layer do all three usually creates either too many false positives or too many blind spots.
Choosing Between In-Database Tools and External Platforms
The decision isn't which tool is “best.” It's which layer each tool should own, and where you want the data to live while checks run. For security-sensitive estates, in-database execution is often the first filter, because moving data out for monitoring creates both governance friction and extra operational work.
Approach | Where It Runs | Best For | Trade-off |
|---|---|---|---|
Deequ | Inside Spark jobs | Constraint checks, profiling, custom rule logic | Strong for engineered checks, but you own more code and maintenance |
Delta Expectations | Inside DLT pipelines | Declarative transformation-time quality rules | Great for pipeline enforcement, less suited to estate-wide observability |
Custom Spark jobs | Inside Databricks compute | Bespoke business logic and edge cases | Maximum flexibility, highest ongoing engineering overhead |
External observability platform | Inside the customer environment, integrated with Databricks | Cross-platform monitoring, baseline learning, unified governance workflows | Adds another platform to manage, but can reduce manual threshold tuning |
Deequ is a solid fit when you want to express checks in code and keep them close to Spark processing. Delta Expectations are even more natural when quality rules belong to a declarative pipeline and should gate or annotate output before the next stage consumes it. Custom Spark jobs still matter when your business logic doesn't fit a standard rule model, especially for join-heavy integrity checks or cross-table comparisons.
The drawback of all three is maintenance. The more specific the rules, the more time you spend curating thresholds, updating logic, and chasing edge cases across the estate. That's where an external observability layer earns its place, especially when it combines deterministic checks with learned baselines instead of making teams hand-tune thresholds forever.
A practical example is a platform that monitors in environment, keeps the data in place, and adds alerting and trend analysis across multiple systems. That's why many teams evaluate options like in-database data quality execution for safer, faster external pipelines alongside native Databricks controls, because the question is really about execution model and governance fit.
The trade-off is not just technical, it's operational. Native checks are excellent for enforcement and local control. External observability is better when you need broad coverage, richer alert routing, and a unified view of behavior across warehouses, lakes, and pipelines without scattering custom scripts everywhere.
Key Metrics to Monitor on Databricks
A good Databricks quality program doesn't start by monitoring everything. It starts by choosing metric families that line up with the most common failure modes: late loads, missing rows, silent type changes, and business rules breaking downstream. If you can only instrument a few things at first, watch the signals that tell you whether the table is still behaving like itself.
Freshness and timeliness
Freshness tells you whether a table is updating when it should. Timeliness goes a step further, because a feed can be present but still late enough to break analytics, models, or operational decisions. Databricks' background scanning model helps here, because Unity Catalog Data Quality Monitoring can keep checking tables without manual scheduling (Databricks Lakehouse Monitoring).
If your nightly fact table lands after business users start pulling reports, freshness is no longer a housekeeping metric. It becomes a consumer risk. Timeliness monitoring is what tells you a table is drifting from expected arrival behavior before the stakeholders start asking why the numbers look thin.
Completeness and counts
Completeness is the metric family that catches missing records and partial loads. It's also the first place teams discover that a source changed behavior without warning, because row counts can fall even while schemas still look fine. Databricks' native monitoring evaluates completeness directly, which makes it a strong first layer for table-level health checks (Databricks Lakehouse Monitoring).
Row counts matter because they're simple, cheap to reason about, and often the earliest signal that a pipeline is wrong. The trick is not to confuse “some rows landed” with “the table is complete.” A partial load can look healthy to a job scheduler and still be unacceptable to downstream consumers.
Statistical anomalies and schema drift
Statistical monitoring is what catches changes that pass validation but don't fit the usual pattern. Mean shifts, variance changes, and quantile drift often show up before anyone notices the business impact. That's why the profiling and drift capabilities in Databricks matter, because they capture both distributional summaries and window-over-window change (Databricks documentation on data quality monitoring).
Schema drift is equally important. Added columns, removed columns, and data type changes can break consumers, especially when readers are tolerant until they aren't. If you've ever had a source-system change slide through because schema inference was too forgiving, you already know why this belongs in the first monitoring tier.
Business-rule validation
Rule validation is where the platform has to reflect actual business meaning, not just technical shape. Databricks lets users define custom metrics tied to business logic and receive alerts when quality issues are detected (Databricks data quality management). That matters for checks like “active customer records shouldn't fall unexpectedly” or “a critical flag should never be null.”
If you need a quick decision rule for priorities, start here:
Freshness: catches late or missing loads before users complain.
Completeness: catches partial ingestion and silent truncation.
Schema drift: catches structural breakage early.
Statistical drift: catches behavior changes when the data still looks valid.
Business rules: catches the domain-specific failures that technical checks miss.
For teams that want a broader metric inventory, data quality metrics for Databricks is a useful way to map these families into a monitoring plan without treating every table the same.
Alerting, Lineage, and Remediation Workflows
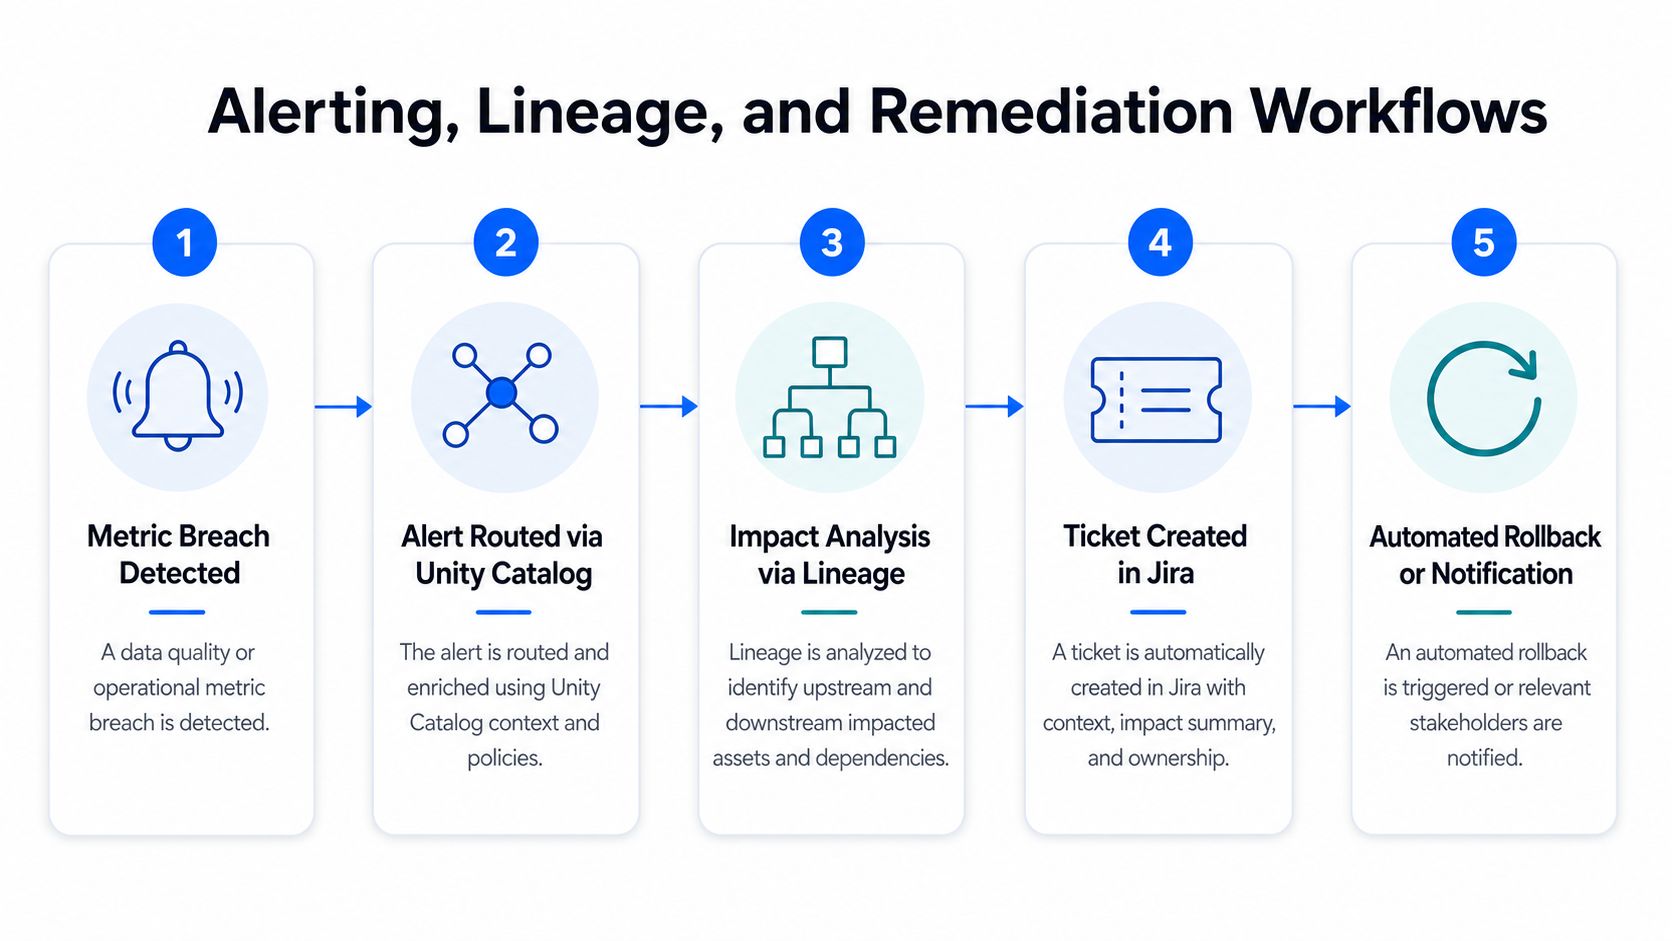
Metrics are only useful if they trigger action. In Databricks, the strongest pattern is to tie alerts to Unity Catalog lineage so the on-call engineer can see not only that something broke, but which downstream tables, dashboards, and consumers are affected. That shifts the incident from a vague “quality issue” to a tractable dependency problem.

Databricks also gives you three native ways to handle bad data downstream. Constraints and validate let you fail fast. Quarantining data isolates bad records before they spread. Flagging violations lets data pass with an explicit marker when blocking the pipeline would be worse than letting the consumer decide. Those options make the control strategy much more practical than a hard yes-or-no rule in every case (Databricks data quality management).
The routing logic should follow business context, not just technical ownership. An unexpected drop in active customer records should page the analytics owner who understands the KPI. A missing nightly load should go straight to data engineering, because the remediation path is operational, not analytical. If you handle every alert the same way, the queue fills with noise and the right person sees the issue too late.
Practical rule: route incidents by impact and ownership, not by which job failed first.
This is also where chatops and ticketing pay off. The alert should create a path to investigation, not just a notification. In practice, that means connecting lineage-aware alerts to whatever the team uses for incidents and making sure the validation outcome is visible where root-cause analysis happens, not buried in a separate report.
For teams that care about operational hygiene in alerting, CleanMyList's sender reputation tips is a good reminder that alert volume and delivery discipline matter as much as signal quality. The same principle applies inside data platforms, noisy alerts get ignored, and ignored alerts become expensive.
The operational goal is simple, reduce mean time to detection and remediation. Monitoring only at the reporting layer slows that down because you find out after the business has already consumed the bad data. Lineage-aware alerts and clear handling paths shift the response earlier in the lifecycle, where fixes are cheaper and blast radius is smaller.
Adding a Dedicated Observability Layer with digna
Native Databricks controls are strong, but they don't always cover the whole estate with the same depth. That's where a dedicated observability layer can fit, especially when you need cross-platform coverage, richer baseline learning, and a single operational view for engineers, analysts, and governance leads. In that role, digna for Databricks observability is one option to evaluate because it complements the platform instead of trying to replace it.

Fit the module to the monitoring problem
The cleanest mapping is straightforward. Data Anomalies fits baseline learning and continuous anomaly detection. Data Validation handles record-level business rules. Timeliness tracks arrival patterns and expected delivery time. Schema Tracker watches structural change. Data Analytics helps with trends, volatility, and broader observability analysis.
That modular shape matters because not every team needs every capability on day one. A platform can start with one module and expand as the estate matures, which is much easier than forcing a broad rollout before the team has even stabilized its alert thresholds. The point is to cover the failure mode you have, not the one that looks best in a product demo.
Keep data inside the environment
The deployment story is the bigger reason teams take a serious look. digna runs inside the customer's own cloud, VPC, or data center, and the checks execute in-database so the data doesn't leave the environment. That makes it a practical option when security review, governance, or data residency concerns would make an external SaaS workflow awkward.
That doesn't make it a replacement for Databricks native controls. DLT expectations still belong in transformation pipelines, and Unity Catalog monitoring still belongs on curated tables. An observability layer like digna sits on top of that foundation and gives you broader pattern detection, additional workflow support, and a single dashboarding layer without moving the underlying data.
Use it as an overlay, not a substitute
The strongest programs I've seen keep the architecture layered. Native enforcement stops obvious defects. Native monitoring watches curated tables. A dedicated observability layer adds cross-platform view, additional anomaly detection, and governance-friendly workflows for teams that need more than table-level health checks.
That split is especially useful when the estate includes more than one engine or more than one team with different definitions of “healthy.” In practice, the observability layer becomes the place where platform operators, analytics engineers, and governance leads share the same incident picture without each building a separate control plane.
A Starter Checklist for Your Databricks Quality Program
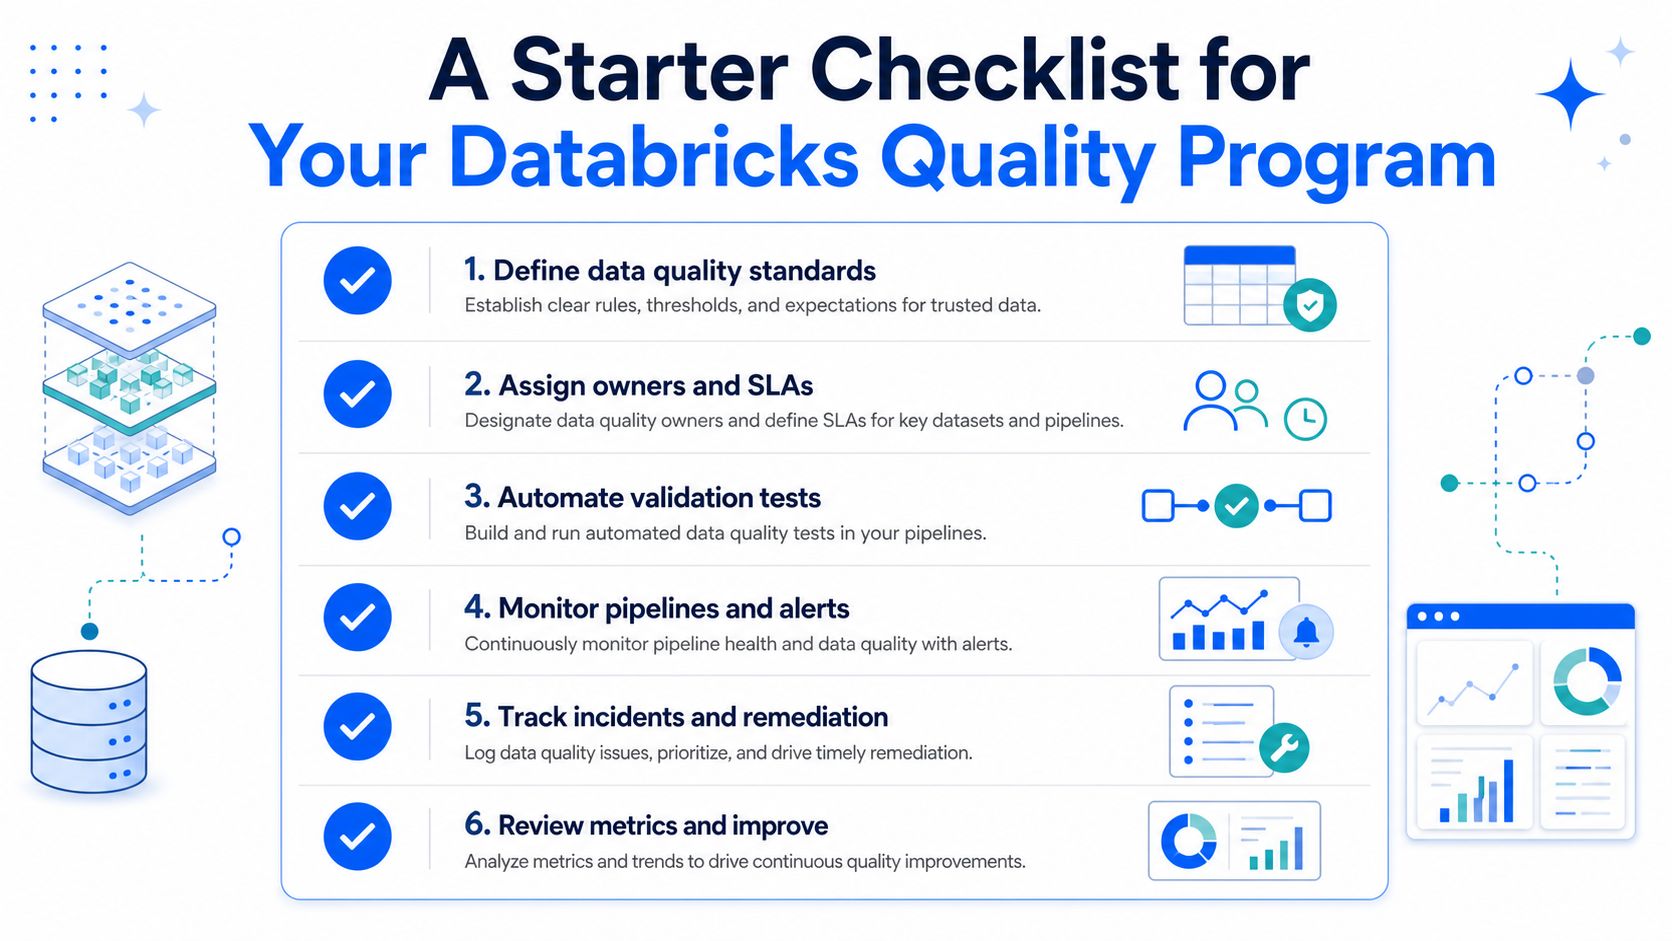
A usable Databricks program starts with a narrow checklist and grows from there. The first mistake is trying to monitor every table the same way. The better move is to layer controls by stage and assign ownership where the data changes.
Instrument native layers first: turn on Unity Catalog monitoring for freshness and completeness, define DLT expectations where transformations should enforce rules, and add Delta constraints for write-time protection.
Define the minimum metric set per layer: freshness and completeness for curated tables, schema drift for critical feeds, and business-rule checks for the tables that drive finance, operations, or models.
Wire alerts into lineage-aware workflows: make sure incidents point to affected upstream and downstream assets so responders don't have to hunt for blast radius.
Add an observability layer where native coverage ends: use an in-environment platform when you need cross-platform visibility, richer baseline learning, or a shared dashboard for multiple stakeholders.
Assign clear ownership: data engineering owns pipeline failures, analytics owns KPI interpretation, and governance owns policy and escalation paths.
The pattern that holds up is not a one-time setup. It's a working system of write-time checks, pipeline-time expectations, and continuous monitoring, all aligned to the way your data is consumed. If you're planning the next phase of your Databricks quality program, start by choosing the tables that matter most, then build the layered controls around them.
If you're trying to make Databricks quality monitoring hold up in production, digna is built to sit inside your environment, watch for anomalies, validate records, track timeliness, and surface schema changes without moving data out of place. Visit digna to see how an in-environment observability layer can fit alongside your Databricks controls and help your team move from reactive checks to continuous data trust.
See how digna does this in practice: Databricks data quality.
Frequently asked questions
What native tools does Databricks offer for data quality monitoring?
Databricks provides three control layers plus a monitoring surface. Delta Lake constraints and validate enforce rules at write time, Delta Live Tables expectations run declarative checks during pipelines, and Unity Catalog Data Quality Monitoring watches tables continuously. System tables and Lakehouse Monitoring add profiling, drift detection and operational context.
What metrics does Databricks profiling capture?
Profiling records nulls, zeros, counts, means, min and max values, standard deviation and up to 1,000 quantiles per column. Drift metrics compare each window against a baseline or the previous window. System tables also show downstream impact, such as 120 queries on affected tables over 30 days in the documentation example.
Which data quality metrics should I monitor first on Databricks?
Start with five metric families tied to common failures. Freshness catches late or missing loads, completeness catches partial ingestion and silent truncation, schema drift catches structural breakage, statistical drift catches behavior changes in valid-looking data, and business rules catch domain failures such as a critical flag turning null.
How should bad data be handled in a Databricks pipeline?
Databricks offers three native options. Constraints and validate let you fail fast, quarantining isolates bad records before they spread, and flagging lets data pass with an explicit marker when blocking the pipeline would do more harm. Tie the resulting alerts to Unity Catalog lineage so on-call sees affected downstream tables and dashboards.
When does an external observability platform make sense alongside Databricks?
It helps when native checks become a maintenance burden across a large estate. Deequ, DLT expectations and custom Spark jobs all need hand-tuned thresholds and code upkeep, while an external layer running inside the customer environment adds learned baselines, cross-platform monitoring and richer alert routing. It works as an overlay, not a substitute.



