Databricks Data Quality: A Practical Guide for 2026
|
8
min read

You probably know the moment. A dashboard that looked fine at 8 p.m. is wrong by breakfast, and the first question isn't “what broke,” it's “where did the break happen.” A row drop in the source table, a schema shift in a late upstream file, or a pipeline that missed its window can all produce the same symptom, a bad number in front of the business.
That's why Databricks data quality is easier to understand as a layered system than as a single feature. The storage layer gives you strong write behavior and history. Table-level monitoring watches for drift, stale tables, and missing data. Record-level enforcement handles the business rules that tables alone can't infer.
Table of Contents
What Databricks Data Quality Really Means
The storage layer answers “did the write happen correctly”
The monitoring layer answers “does this table look healthy”
The validation layer answers “should this row be allowed”
How Delta Lake Provides the Storage Foundation
Write cleanly first, then judge meaning later
Use history as a forensic tool
Native Monitoring with Lakehouse Monitoring and Unity Catalog
What the automation actually watches
How the freshness and completeness model works
Record-Level Validation and Quarantine Patterns
Quarantine first, then decide what to do with the bad row
Expectations are a different kind of guardrail
Open Source and Commercial Tools That Integrate with Databricks
Match the tool to the job, not the brand
Architectural Patterns for In-Database Quality Checks
External processing is easier to start, but it moves the data
In-database execution keeps the checks where the data lives
Deploying Digna as an Observability Layer on Databricks
Map the product to the layer, not the logo
Keep the deployment shape simple
Best Practices and a Short Checklist You Can Apply This Week
The anti-patterns to avoid
A Monday-morning checklist
What Databricks Data Quality Really Means
A data engineer usually finds out about the problem the hard way. Finance asks why yesterday's revenue is off, BI says the dashboard changed overnight, and the pipeline owner starts checking logs before anyone has a theory. At that point, “data quality” is just the umbrella term for a bunch of different failures that all look like a broken report.
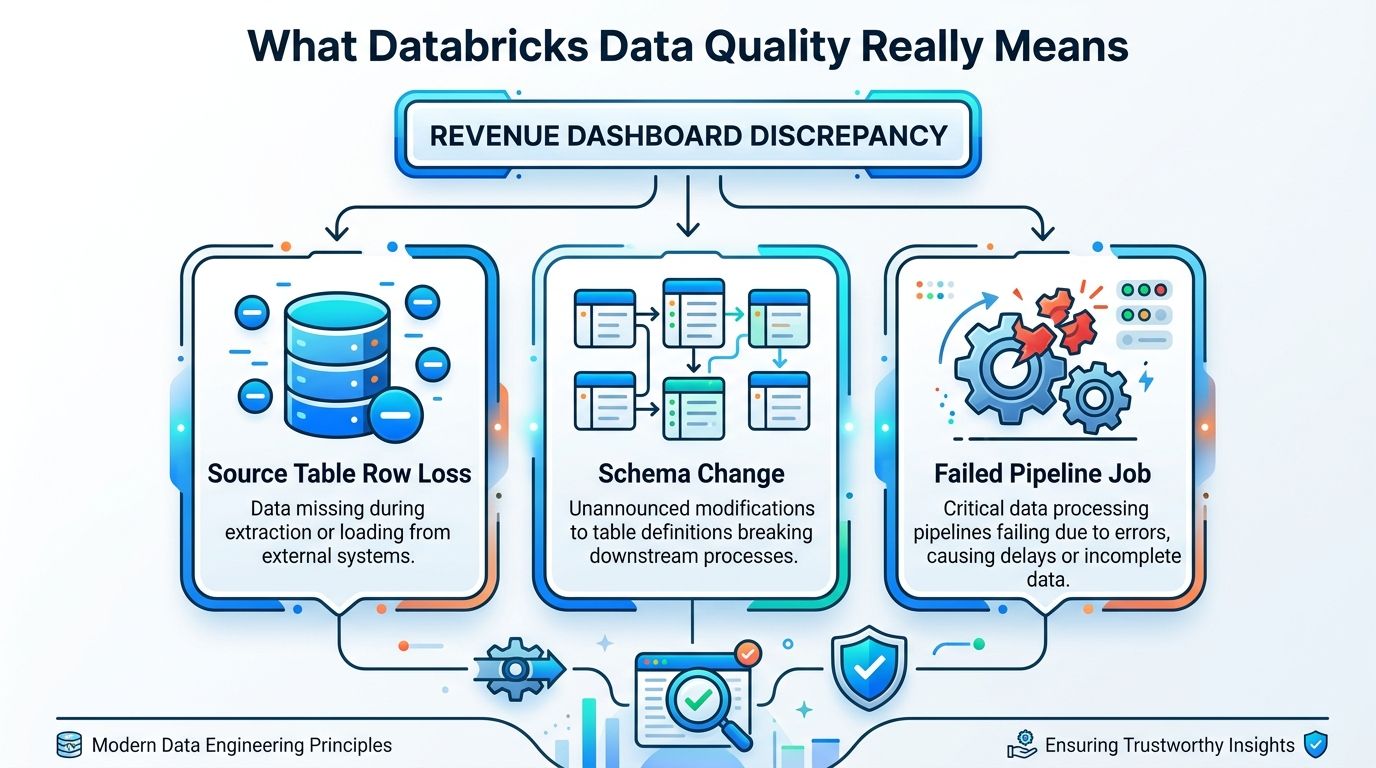
The useful mental model is to split the problem into three layers. First, the storage layer protects how data lands and changes. Second, the monitoring layer watches tables for symptoms like staleness, incomplete writes, and schema drift. Third, the validation layer checks the actual rows and business rules before bad records can travel downstream.
The storage layer answers “did the write happen correctly”
Databricks' storage foundation matters because it reduces the chance that a table ends up half-written or structurally inconsistent. That's a different problem from asking whether the data is semantically right. A revenue row can be perfectly stored and still be wrong for the business.
The monitoring layer answers “does this table look healthy”
Lakehouse Monitoring and Unity Catalog data quality monitoring address this. Databricks uses learned patterns, freshness signals, and completeness checks to flag tables that look off, without requiring a hand-written threshold for every dataset. Microsoft's Azure Databricks docs also say the results are available at the catalog, schema, and table levels, and that owners can use a logging table to look across an entire metastore for anomalies in the Azure Databricks data quality monitoring documentation.
The validation layer answers “should this row be allowed”
That layer is where business rules live. A table can be fresh and complete and still contain an invalid claim code, an out-of-range price, or a regulatory flag that should never have passed. Databricks supports record-level handling patterns, but that's still a separate concern from table health.
Practical rule: if you can describe the issue as “the table looks unusual,” use monitoring. If you need to decide whether a specific row is valid, use validation.
How Delta Lake Provides the Storage Foundation
Start with the part of Databricks that's easy to miss because it's working correctly in the background. Delta Lake gives you the write behavior and history that make quality enforcement possible at the storage layer, so you're not debugging mystery files after the fact. The point isn't that storage solves everything. The point is that it prevents a lot of low-level corruption from becoming your daily problem.

Write cleanly first, then judge meaning later
In a medallion pipeline, Bronze is where messy ingestion lands, Silver is where you clean and standardize, and Gold is where curated facts support analytics. Delta's job is to make each write reliable enough that the next layer can trust the table state. That's why storage guarantees are cheap insurance, while semantic judgment belongs higher up the stack.
Schema enforcement on write is a good example. If a pipeline tries to load data that doesn't match the table definition, the storage layer can reject it instead of modifying the table into something that downstream jobs misread. If you intentionally allow schema evolution, you do that on purpose, not by accident.
A clean storage layer doesn't mean clean business logic. It means the wrong data is less likely to become a persistent fact.
Use history as a forensic tool
Time travel is the other piece that matters in practice. When the dashboard changed, you need to know when the bad record entered the table, what version existed before it, and whether the issue started in Bronze, Silver, or Gold. Delta history helps you narrow that down without guessing.
Constraints and expectations then sit on top of that foundation. They don't replace monitoring, but they do create a floor for correctness. If you reject incompatible records early, quarantine bad rows instead of mixing them with valid ones, and keep the table evolution intentional, you give every later quality check a much cleaner signal.
The result is simple. Storage guarantees stop preventable damage. Monitoring spots drift and stale data. Validation handles the business logic that still needs explicit rules.
Native Monitoring with Lakehouse Monitoring and Unity Catalog
Databricks' native monitoring is strongest when you want the platform to notice unusual behavior without asking your team to hand-write checks for every table. Lakehouse Monitoring was introduced as a GA capability for profiling, diagnosing, and enforcing data quality, and Databricks says it computes metrics for any Delta table in Unity Catalog while automatically building dashboards that plot trends and anomalies over time. The system also creates two metric tables per monitored table, one for profile metrics and one for drift metrics, which gives you a persistent record of what changed and when, as described in the Databricks Lakehouse Monitoring GA announcement.
What the automation actually watches
The built-in signals are table-centric. Databricks tracks freshness and completeness using historical behavior, and the Unity Catalog monitoring docs describe a schema-level anomaly detection approach that scans all tables in a schema, prioritizes important ones, and skips low-impact tables when appropriate. Default monitoring runs hourly, and it skips scans when a table isn't expected to have changed yet, which reduces noisy checks and wasted compute, as documented in the Unity Catalog data quality monitoring guide.
How the freshness and completeness model works
Freshness is based on commit history and the predicted time of the next commit. A table is considered stale when a commit arrives unusually late. Completeness is based on historical row counts in a 24-hour window, and a table is considered incomplete when the last 24 hours of writes fall below the lower bound of the learned range, according to the Databricks documentation for Azure Databricks monitoring. That's useful because it avoids rigid thresholds that break every time a pipeline's normal rhythm shifts.
The platform also surfaces related signals such as percent nulls and distribution drift. That matters because a table can still look “on time” while its shape is changing in a way that breaks downstream assumptions.
Useful shortcut: native monitoring is strongest when the question is “did this dataset behave like itself?”
For readers who want a comparison point, the operational shape of this layer is close to a managed radar screen, while a dedicated observability layer such as digna's Databricks monitoring approach is often used when teams want deeper in-database inspection, broader rule coverage, or a single view across multiple signals.
Record-Level Validation and Quarantine Patterns
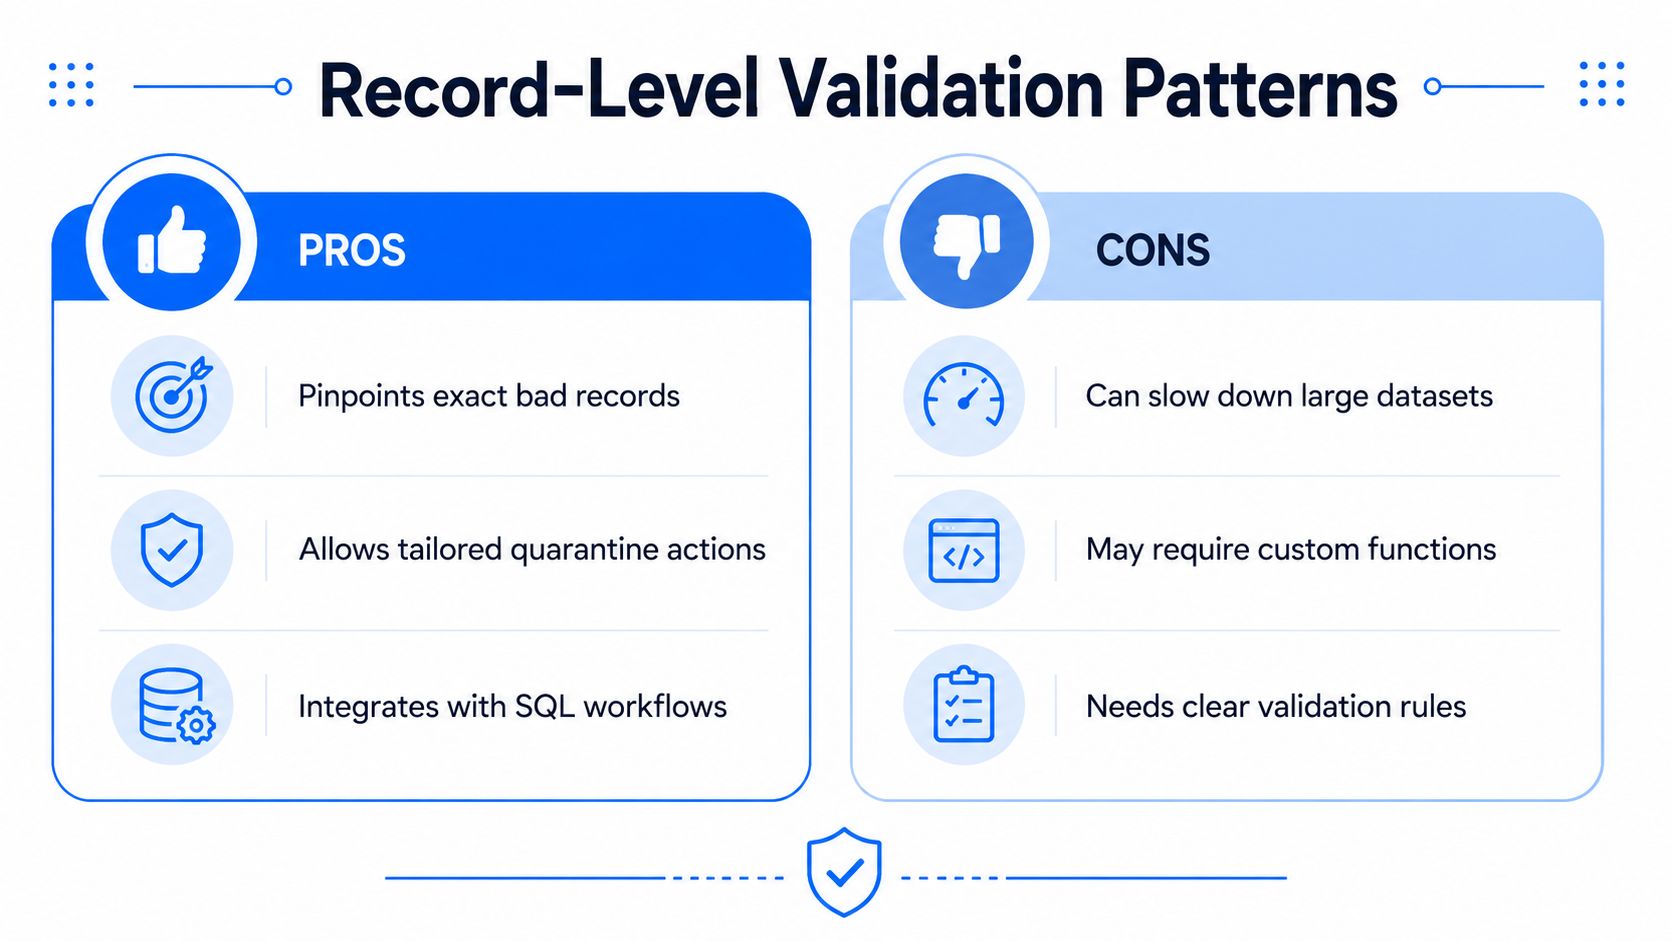
Monitoring tells you that a table is off. Validation tells you which rows deserve the blame. That distinction matters because freshness and completeness can't tell you whether a claim code is valid, whether a price sits inside an approved band, or whether a record should be routed to a manual review queue.
Quarantine first, then decide what to do with the bad row
Databricks supports SQL-style transformations that use filters and WHERE clauses to quarantine bad records so they don't propagate downstream. It also supports CASE WHEN ... OTHERWISE logic for predictable business-rule exceptions, as shown in the Databricks validation guidance. In practice, that means a Bronze table can hold raw data, a quarantine table can hold exceptions, and Silver can stay clean enough for downstream jobs and reports.
That pattern is especially useful when the failure is deterministic. If a field is missing, a code is invalid, or a value violates a known rule, you don't need a probabilistic detector to tell you something is wrong. You need a branch that routes the row correctly.
Expectations are a different kind of guardrail
Databricks also supports expectations on materialized views and streaming tables, including dropping null records so quality issues are surfaced before they reach consumers, according to Databricks' Lakehouse Monitoring announcement. That's helpful for narrow, well-defined checks. It's less useful when the rule set is large, volatile, or audit-heavy.
The design question teams eventually hit is straightforward. Should Databricks hold the actual business-rule logic, or should it be the place where you observe and triage quality while a dedicated layer manages the rules themselves? For most regulated or fast-changing environments, the answer isn't one or the other. It's usually both, with monitoring and rule governance kept separate enough that alerting doesn't become a tangle.
Keep the quarantine table close to the pipeline. If a record needs human review, don't bury it in logs.
Open Source and Commercial Tools That Integrate with Databricks
The ecosystem around Databricks is broader than native monitoring. Open source tools like Great Expectations, Soda Core, Deequ, and dbt tests are often used for lightweight checks close to the pipeline, especially when a team wants explicit rule definitions and clear pass or fail output. Commercial observability platforms usually sit one layer higher, connecting through JDBC, Unity Catalog APIs, or direct Delta reads so they can monitor tables across the metastore.
Category | Primary Job | Execution Location |
|---|---|---|
Open source pipeline tests | Validate known rules during ingestion or transformation | Inside jobs, notebooks, or CI workflows |
Table-level observability tools | Watch schema-wide health, trends, and anomalies | In the warehouse, via Unity Catalog, or through Delta reads |
Commercial in-database platforms | Keep data resident while computing metrics and baselines | Inside the customer's Databricks environment |
Match the tool to the job, not the brand
If the goal is “stop bad rows from landing,” pipeline tests are enough. If the goal is “show me the health of the whole metastore,” schema-level observability fits better. If the goal is “don't move regulated data out of the warehouse,” then in-database execution becomes the deciding factor.
That last point is where the seam shows up in Databricks itself. Recent Databricks guidance says support for more checks like percent nulls, uniqueness, and validity is coming next in the native anomaly-detection path, which is a clear sign that the built-in feature set is still expanding. For teams that need granular validation today, that gap is where external tooling still earns its keep.
Don't think you need a single tool to do everything. You need one layer for pipeline tests, another for table observability, and a third for business-rule enforcement when the rules can't be reduced to a generic threshold.
Architectural Patterns for In-Database Quality Checks
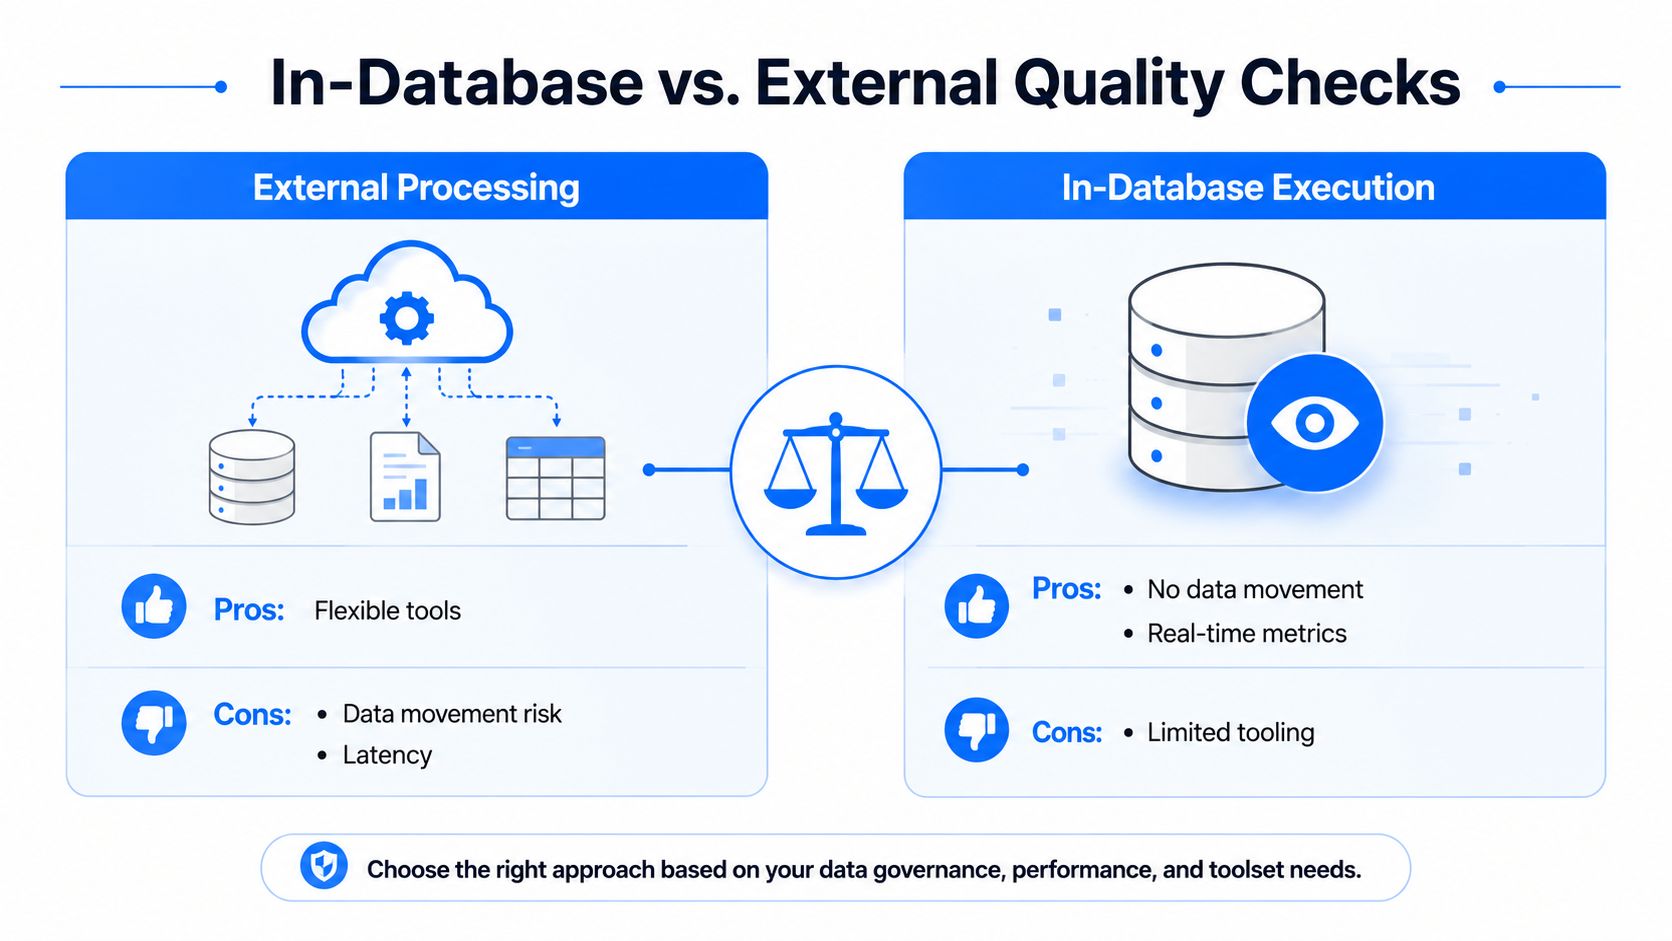
The architecture decision is really about data movement. One approach pulls samples or full scans out of Databricks, evaluates them elsewhere, and then pushes results back. The other executes metrics, drift analysis, and validation inside the workspace so the data stays resident in the customer boundary.
External processing is easier to start, but it moves the data
External tools are often simpler to deploy because they use familiar APIs and can run in a separate control plane. The trade-off is obvious. Once you copy production data out for inspection, you've added movement, latency, and more surface area for governance reviews.
In-database execution keeps the checks where the data lives
In-database execution is better when the warehouse is large, the data is sensitive, or the team needs near-real-time visibility without exporting records. That matters in finance, healthcare, and public-sector environments, where production data often can't leave the customer boundary in the first place. It also scales better when you're scanning many Delta tables because the compute is already operating in the same environment as the source.
Here's the clean way to decide.
Use external processing when you need quick setup, broad ecosystem support, or a lightweight test runner.
Use in-database execution when data residency matters, scan volumes are large, or observability has to stay close to the source.
Use both when you want pipeline tests at ingest time and table observability across the full estate.
The architecture choice is less about fashion than about control. External tools are flexible. In-database checks are safer for sensitive data and usually more efficient at scale.
Deploying Digna as an Observability Layer on Databricks
A practical deployment usually starts by separating concerns. Databricks keeps the lakehouse and the pipeline execution. An observability layer such as digna's Databricks solution runs inside the customer's environment, computes metrics on configured Delta tables, and surfaces results in a unified UI without asking data to leave the boundary.
Map the product to the layer, not the logo
The cleanest mental model is to line up the product's components with the layers above. Data Anomalies and Data Analytics fit the table-level monitoring layer. Schema Tracker fits structural drift detection. Timeliness covers freshness and late-arrival monitoring. Data Validation is the record-level rule layer, which is where native monitoring still leaves room for more explicit business logic.
That mapping matters because it avoids overlap for the sake of overlap. Databricks already gives you native freshness and completeness monitoring at the schema level. A separate observability layer makes sense when you want broader business-rule checks, in-database metric computation, and a place to inspect trends, schema changes, and delivery timing together.
Keep the deployment shape simple
A common pattern is to register the most important Delta tables, let the platform learn baselines in place, and then route anomalies, schema changes, and rule violations into one operational view. That's especially useful when engineering, analytics, and governance all need the same evidence but don't want three separate tools.
The value here isn't “more alerts.” It's a clearer split between detection and judgment. Databricks can keep doing what it already does well, while a dedicated observability layer handles the checks that need more explicit validation, tighter inspection, or a better interface for triage.
The best implementation is the one where platform teams can tell, in one glance, whether the issue is late data, structural drift, or a bad record.
Best Practices and a Short Checklist You Can Apply This Week
The right order is straightforward. Use Delta constraints as the floor, Lakehouse Monitoring as the default table-level radar, and a dedicated validation layer for business rules that need explicit handling. If you blur those lines, alerting gets noisy and root-cause work gets slower.
The anti-patterns to avoid
The first mistake is trying to express business semantics as anomaly thresholds. A threshold can tell you a table is unusual. It can't tell you whether a policy number is legitimate or a reimbursement code is compliant. The second mistake is skipping quarantine and letting suspicious records contaminate downstream layers. The third is assuming Unity Catalog monitoring replaces row-level rule governance. It doesn't.
A Monday-morning checklist
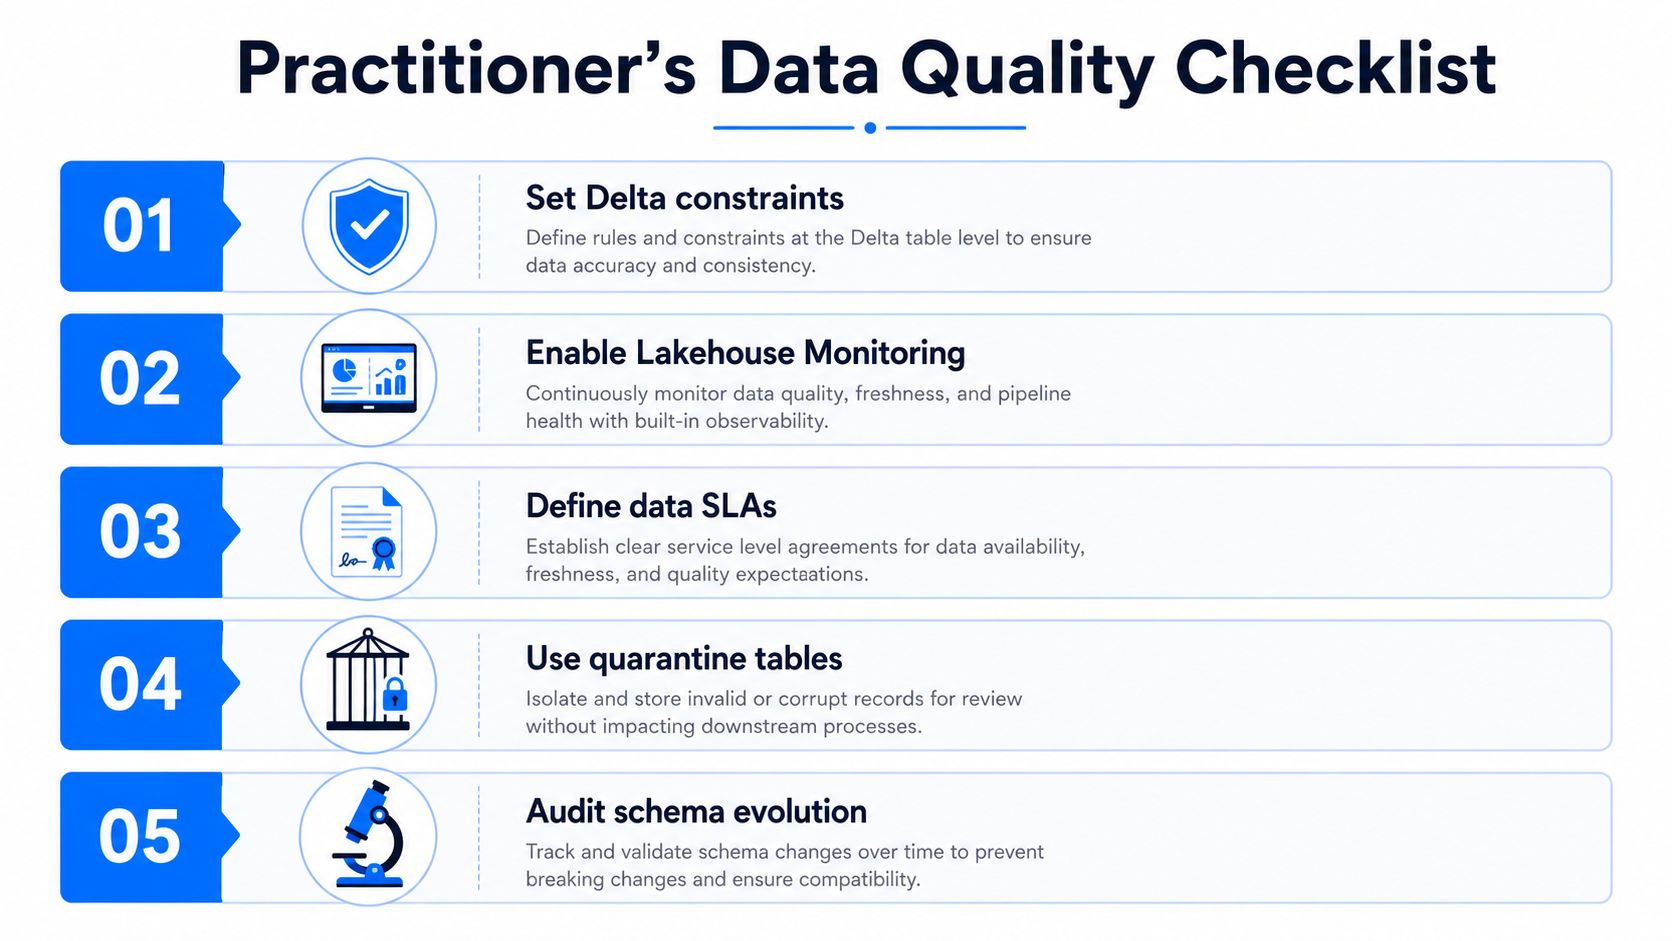
Set Delta constraints. Make sure the storage layer blocks obvious incompatibilities before they land.
Enable Lakehouse Monitoring. Let schema-level monitoring watch freshness, completeness, and drift.
Define data SLAs. Decide what late, incomplete, or stale means for your critical tables.
Use quarantine tables. Route invalid rows somewhere visible instead of hiding them in logs.
Audit schema evolution. Check whether changes were intentional before they hit Silver or Gold.
Those five items are enough to expose most weak spots in a Databricks estate. They also force a useful conversation with the business. If a table is healthy but the report is still wrong, the problem is probably in the validation logic, not the monitoring layer.
digna gives teams an in-database observability layer for Databricks that watches anomalies, timeliness, schema changes, and record-level validation without moving production data out of the customer environment. If you're trying to separate table health from business-rule enforcement, visit digna and see how that layered approach fits your own lakehouse.
See how digna does this in practice: monitoring data quality in the Databricks lakehouse.


