Enterprise Data Quality Tools: 2026 Selection Guide
|
0
minute de lecture

Your team probably has the same pattern right now. The warehouse looks healthy, dashboards are green, and the board deck goes out on time. Then a forecast misses badly because one upstream table stopped updating, a schema change slipped through, or a business rule failed, remaining unnoticed until finance asked why the numbers no longer reconcile.
That is the job of data quality tools. They don't exist to decorate a modern data stack with another dashboard. They exist to catch the quiet failures that break trust after the data has already reached executives, analysts, customers, or AI systems. The market is expanding fast because the problem is no longer optional. The global data quality tools market was valued at USD 2.78 billion in 2025 and is projected to reach USD 7.39 billion by 2031, growing at a CAGR of 17.7% according to Mordor Intelligence's data quality tools market analysis.
Most buying guides still miss the decision that matters. They compare features, logos, and screenshots, but they don't force a clear choice on architecture or on whether quality and observability should live in separate tools. Those are the decisions that shape accuracy, operating cost, security posture, and how much noise your team will tolerate before they start ignoring alerts. If you're dealing with the consequences of bad data quality, that distinction matters more than another checklist of generic capabilities.
Table of Contents
When Good Data Goes Bad
A bad quarter often starts with a small technical event. A source system changes a field type. A late batch lands after reporting logic has already run. A deduplication rule stops matching records because the incoming format changed. None of these failures looks dramatic on day one. The damage appears later, when a board forecast, revenue report, or compliance extract turns out to be wrong.
That's why the old definition of data quality, meaning accuracy, completeness, consistency, and validity, isn't enough on its own. In practice, enterprises need systems that can detect silent failures before business users become the monitoring layer. The difference between “we have tests” and “we trust our data” is whether someone catches issues before dashboards and models absorb them.
The board deck failure pattern
The most common failure isn't a catastrophic outage. It's a plausible number with the wrong meaning. Freshness looked fine yesterday. Volume looked normal. The pipeline technically completed. But one set of records duplicated, one business rule drifted, or one source stopped populating a key field consistently.
That's exactly where many teams get trapped. They buy tools that report visible breakage but miss low-noise data drift. The result is a system that tells you when a table vanished, but not when a table is still there and subtly incorrect.
Good data systems don't just answer “did the job run?” They answer “can the business trust what arrived?”
A useful way to think about data quality tools is as the immune system for the data platform. A healthy immune system doesn't wait for organ failure. It detects unusual signals early, routes the problem to the right owner, and keeps local damage from becoming systemic.
Why feature lists aren't enough
Plenty of tools can profile a dataset, run assertions, or send alerts. That still doesn't settle the harder questions:
Where does computation happen? Inside the database, outside it, or only against metadata.
What gets validated? Pipeline behavior, record-level business rules, or both.
Who gets notified? Platform engineers, domain stewards, analysts, or nobody useful.
How much blind spot exists? Especially when the tool avoids inspecting records directly.
Those decisions determine whether a tool will help in a real incident or just produce another tab in the stack.
What Are Data Quality Tools Really For
A lot of teams describe data quality tools by listing functions: profiling, validation, cleansing, matching, monitoring. That's accurate, but it doesn't tell you why they matter. In practice, these tools exist to make your data supply chain inspectable.
Think of a manufacturing line. You don't just want a final inspection after the product ships. You want checks on raw materials, checks during assembly, checks on timing, and checks on whether finished goods still meet the original specification. Data quality tools play the same role across ingestion, transformation, storage, analytics, and downstream AI use.
They inspect more than errors
Some tools act like structural inspectors. They watch schemas, types, and row patterns. Others act like process inspectors. They monitor timeliness, freshness, and operational drift. The stronger platforms also act like forensic investigators, helping teams trace a bad dashboard back to a late upstream load or a broken transformation.
That's why the purpose isn't merely “find bad rows.” The purpose is build trust at the speed the business now expects.
A practical mental model looks like this:
Foundation checks: Schema tracking, column types, null patterns, and structural drift.
Material checks: Validity rules, range checks, referential integrity, duplicates, and business logic.
Delivery checks: Freshness, expected arrival times, and delayed or missing updates.
Behavior checks: Anomaly detection on trends, distributions, and usage patterns.
If you work with customer, revenue, or marketing systems, identity problems often sit at the center of quality failures. That's why many teams also need workflows that optimize marketing data with identity before analytics ever starts consuming those records.
Trust is the actual output
The best outcome of data quality tooling is not a lower defect count on paper. It's operational confidence. Analysts stop revalidating every metric by hand. Finance trusts source-fed reconciliations. Machine learning teams spend less time debugging training inputs. Governance leaders gain evidence that controls are working instead of assuming they are.
Practical rule: If business users still ask “which number is right?” after your checks pass, your tooling is measuring activity, not trust.
There's another point teams underestimate. Data quality tooling changes decision speed. When people trust the underlying records and the timeliness of the pipeline, they move faster because they don't need a parallel manual review loop.
What they are not
They are not a substitute for ownership. They are not a magic layer that fixes weak source systems. They are not useful if every alert routes into a shared inbox nobody owns.
A strong platform supports a disciplined operating model:
The platform detects the issue.
The alert includes enough context to diagnose it.
It reaches the person who can fix it.
The fix feeds back into better controls.
Without that loop, you don't have data quality. You have instrumentation.
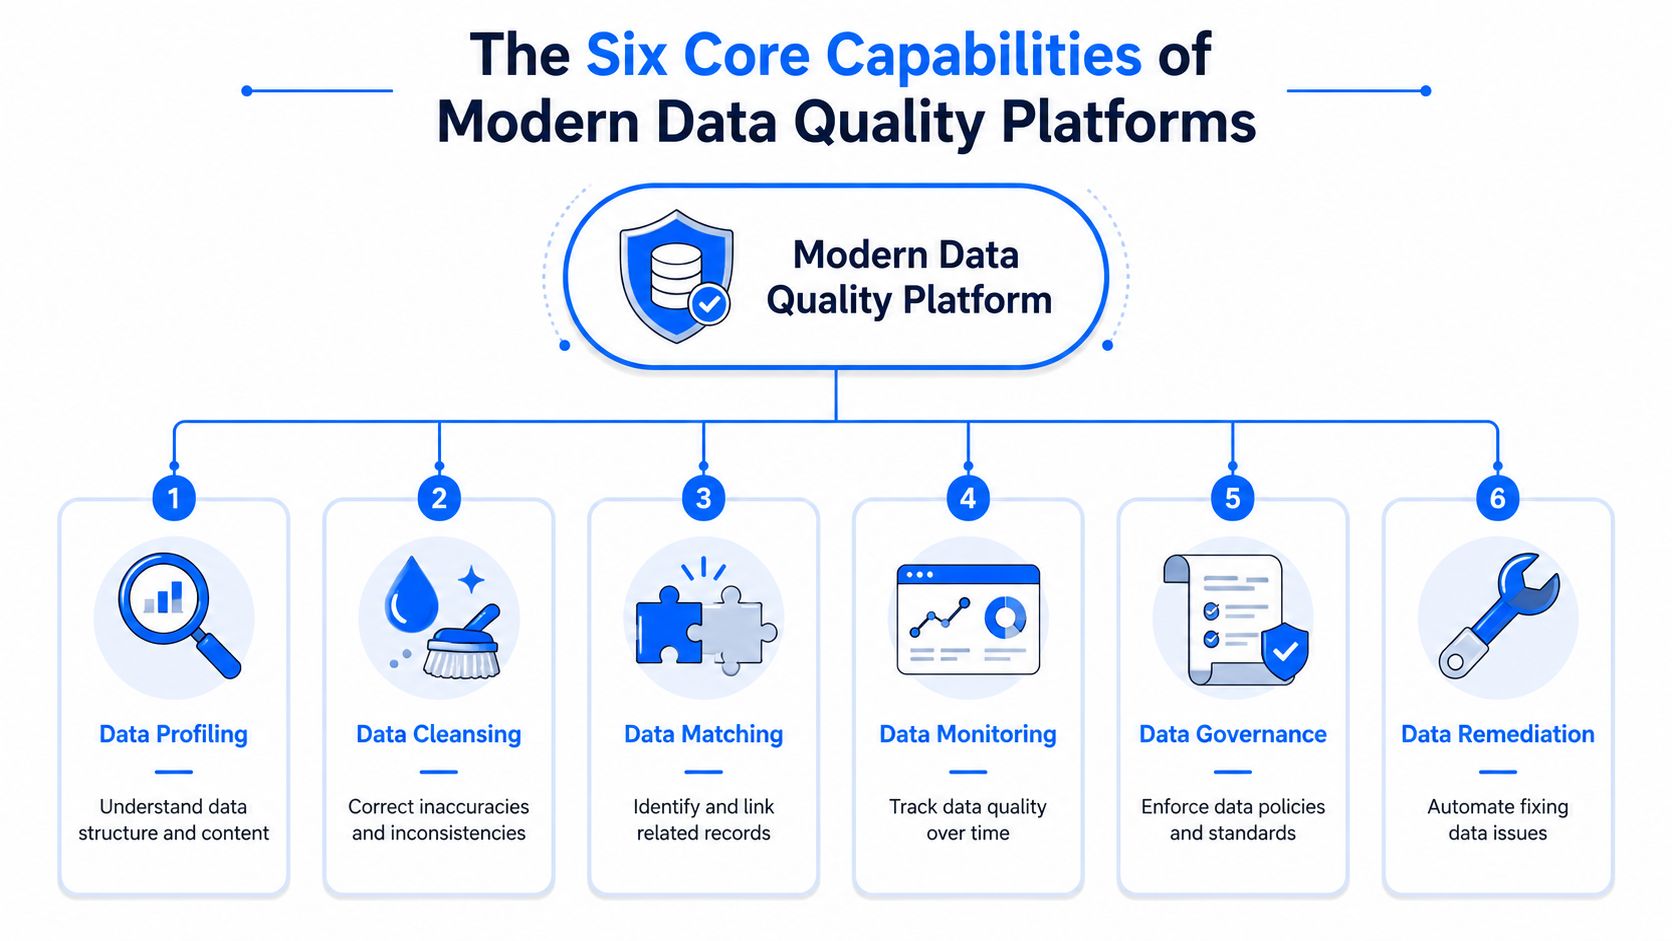
The Six Core Capabilities of Modern Platforms
Modern platforms need broader coverage than legacy data quality suites. They must protect dashboards, AI inputs, and regulated workflows at the same time. That means combining technical detection with operational routing and business-rule enforcement.
From checks to coverage
The six capabilities that matter most in practice aren't isolated features. They form a safety net.
Capability | What it protects | Why teams care |
|---|---|---|
AI-powered anomaly detection | Unknown unknowns in metrics and behavior | Finds unusual changes that static rules miss |
Record-level validation | Business logic and audit requirements | Catches row-level defects that still pass pipeline health checks |
Timeliness monitoring | Late and missing data deliveries | Prevents stale reports and downstream confusion |
Schema change tracking | Structural compatibility | Stops transformations and reports from drifting silently |
In-database execution | Security, cost control, and precision | Keeps analysis close to the data and avoids unnecessary movement |
Unified observability | Operational and business context together | Connects pipeline events to data trust outcomes |
AI matters here because static thresholds age badly. Seasonality changes. Business cycles shift. New product launches distort prior baselines. According to Fortune Business Insights on the data quality tools market, regulatory pressure from GDPR and CCPA is a major adoption driver, and 78% of data governance leaders now consider AI-driven anomaly detection essential for audit readiness and compliance.
Why these capabilities matter together
A platform with only one or two of these capabilities tends to fail in predictable ways.
A tool that only watches freshness may tell you a table arrived on time while missing the fact that duplicate records exploded inside it. A tool that only validates business rules may catch invalid values but miss a late pipeline that left yesterday's snapshot in place. A schema tracker without anomaly detection won't notice when values drift while the structure stays technically unchanged.
That's why I look for layered protection rather than isolated modules. Good systems answer different classes of questions at once:
Did the data arrive when it should have?
Did the structure change?
Do the records still obey business rules?
Are distributions and trends still behaving normally?
Can the team inspect patterns over time?
Can the right owner act quickly?
For teams trying to make this concrete, these data quality metrics are useful because they force quality discussions out of abstract governance language and into measurable operating signals.
Static rules catch known failure modes. Modern platforms also need to detect the problems nobody wrote a rule for.
There's also a practical implementation point worth stating directly. If anomaly detection generates noise, engineers stop trusting the alerts. Adaptive systems matter because they learn normal patterns over time. The verified market and vendor data both point in that direction, from AI-driven anomaly detection becoming central for compliance to adaptive engines outperforming generic forecasting approaches in anomaly identification.
The Critical Architectural Decision In-Database vs External
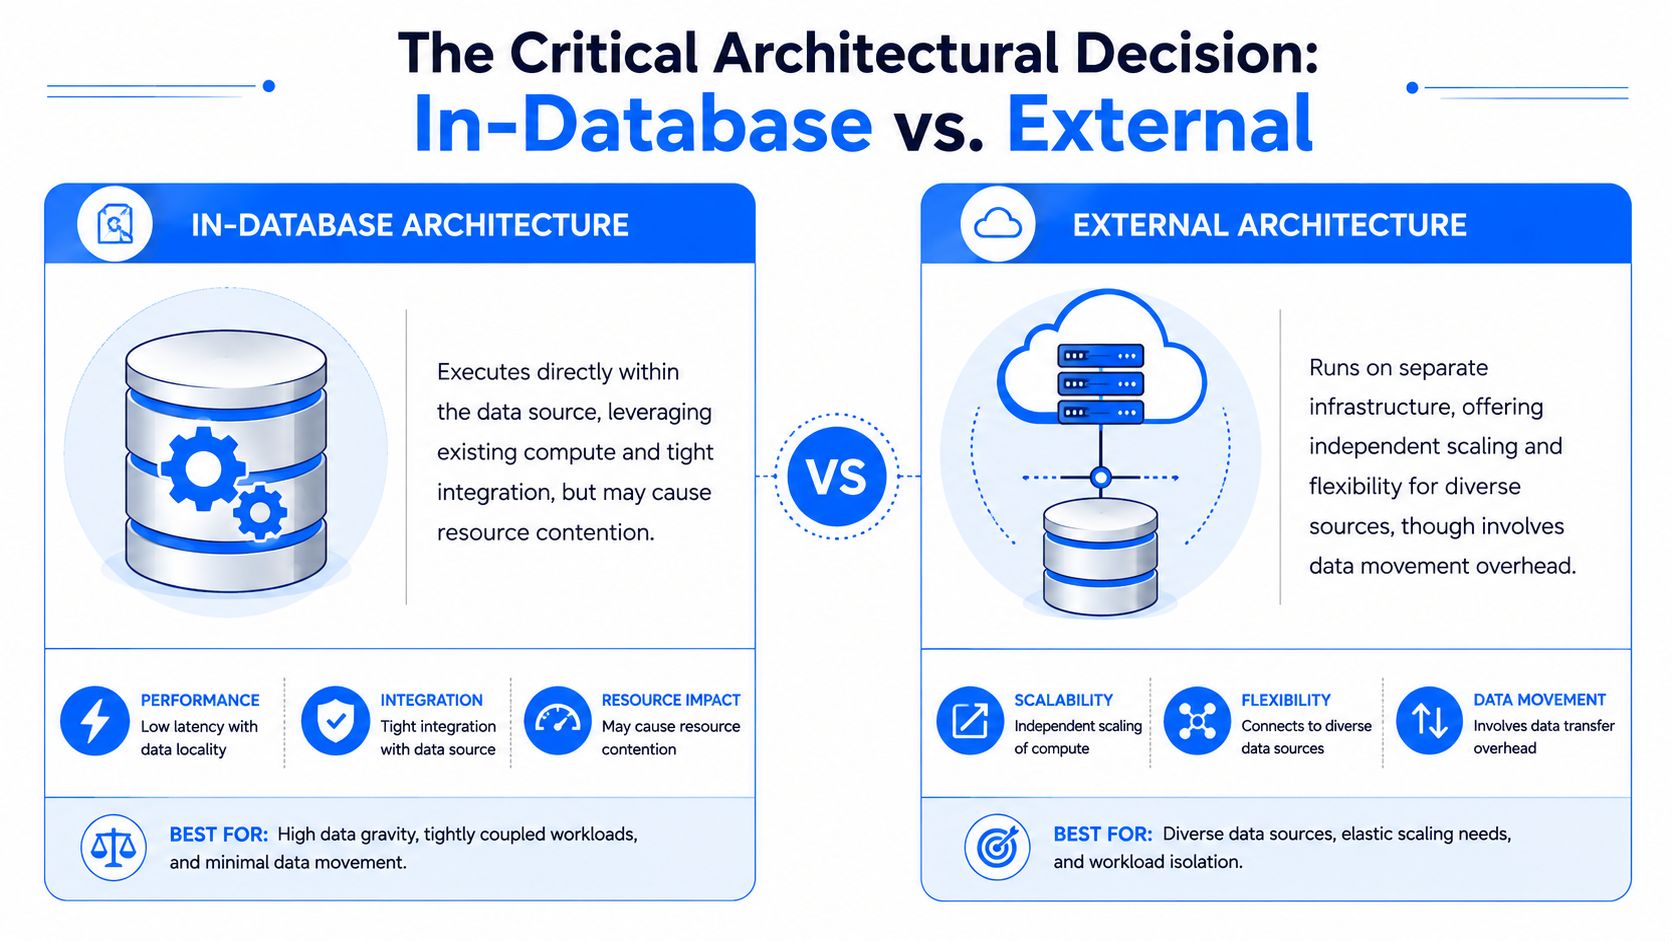
Most buyers spend too much time on UI screenshots and not enough time on architecture. That's backwards. The architecture determines where data gets processed, what level of precision is possible, which security controls apply, and how much record-level visibility the platform can realistically deliver.
Two ways to inspect the same system
There are two broad approaches.
In-database execution runs checks, metric computation, and baseline learning where the data already lives. The warehouse or database performs the work, and the platform orchestrates and interprets the results.
External approaches run quality logic outside the data platform. In some cases they move data into another system for analysis. In others, they mainly inspect metadata, lineage, query logs, freshness signals, or aggregate statistics rather than computing directly against the records.
The easiest analogy is building inspection. In-database tools inspect the actual rooms, wiring, and plumbing inside the building. Metadata-only tools often inspect the blueprints, utility bills, and elevator logs. The second approach can be useful, but it doesn't tell you whether mold is spreading behind a wall.
Where metadata-only breaks down
This is the architectural blind spot many teams discover too late. Metadata-only approaches may miss subtle record-level drift in complex pipelines, which is a key weakness for finance and healthcare sectors where record-level accuracy is paramount, as discussed in Monte Carlo's analysis of when data quality tools are needed.
That matters because many business failures are not metadata failures. The table still exists. The job still ran. Volume still looks plausible. But the records inside are wrong in ways only row-level inspection can catch.
Here's the practical trade-off:
Architecture | Strengths | Weaknesses |
|---|---|---|
In-database | Keeps data in the customer environment, supports deeper record inspection, aligns well with private cloud and on-prem controls | Must be designed carefully to avoid unnecessary warehouse load |
External metadata-first | Often faster to deploy for broad operational monitoring, can reduce direct querying of records | Can miss low-level drift and business-rule failures inside otherwise healthy-looking tables |
That doesn't mean external monitoring is useless. It means teams should stop pretending it answers every quality question.
What to ask vendors directly
When evaluating architecture, ask blunt questions:
Where is metric computation performed?
Do you inspect records directly or mostly infer issues from metadata signals?
Can the platform run in private cloud or on-prem without vendor access to production data?
What happens when I need row-level business rule validation on regulated data?
How do you separate useful anomaly detection from alert noise?
A tool like digna is relevant in this category because it executes analyses inside the customer database, supports anomaly detection, validation, timeliness monitoring, and schema tracking, and is designed for customer-controlled environments such as private cloud or on-prem deployments.
If your team is weighing security posture and compute trade-offs, this deeper explanation of in-database data quality execution versus external pipelines is the right line of inquiry.
The architecture choice isn't a deployment detail. It changes what the tool can actually know.
I generally favor in-database execution for enterprises handling regulated, high-value, or operationally sensitive datasets. It preserves the security boundary, reduces unnecessary movement, and gives the platform direct access to the records that matter. External and metadata-led approaches still have a role, especially for broad observability coverage, but they should be chosen with clear eyes about the blind spots they create.
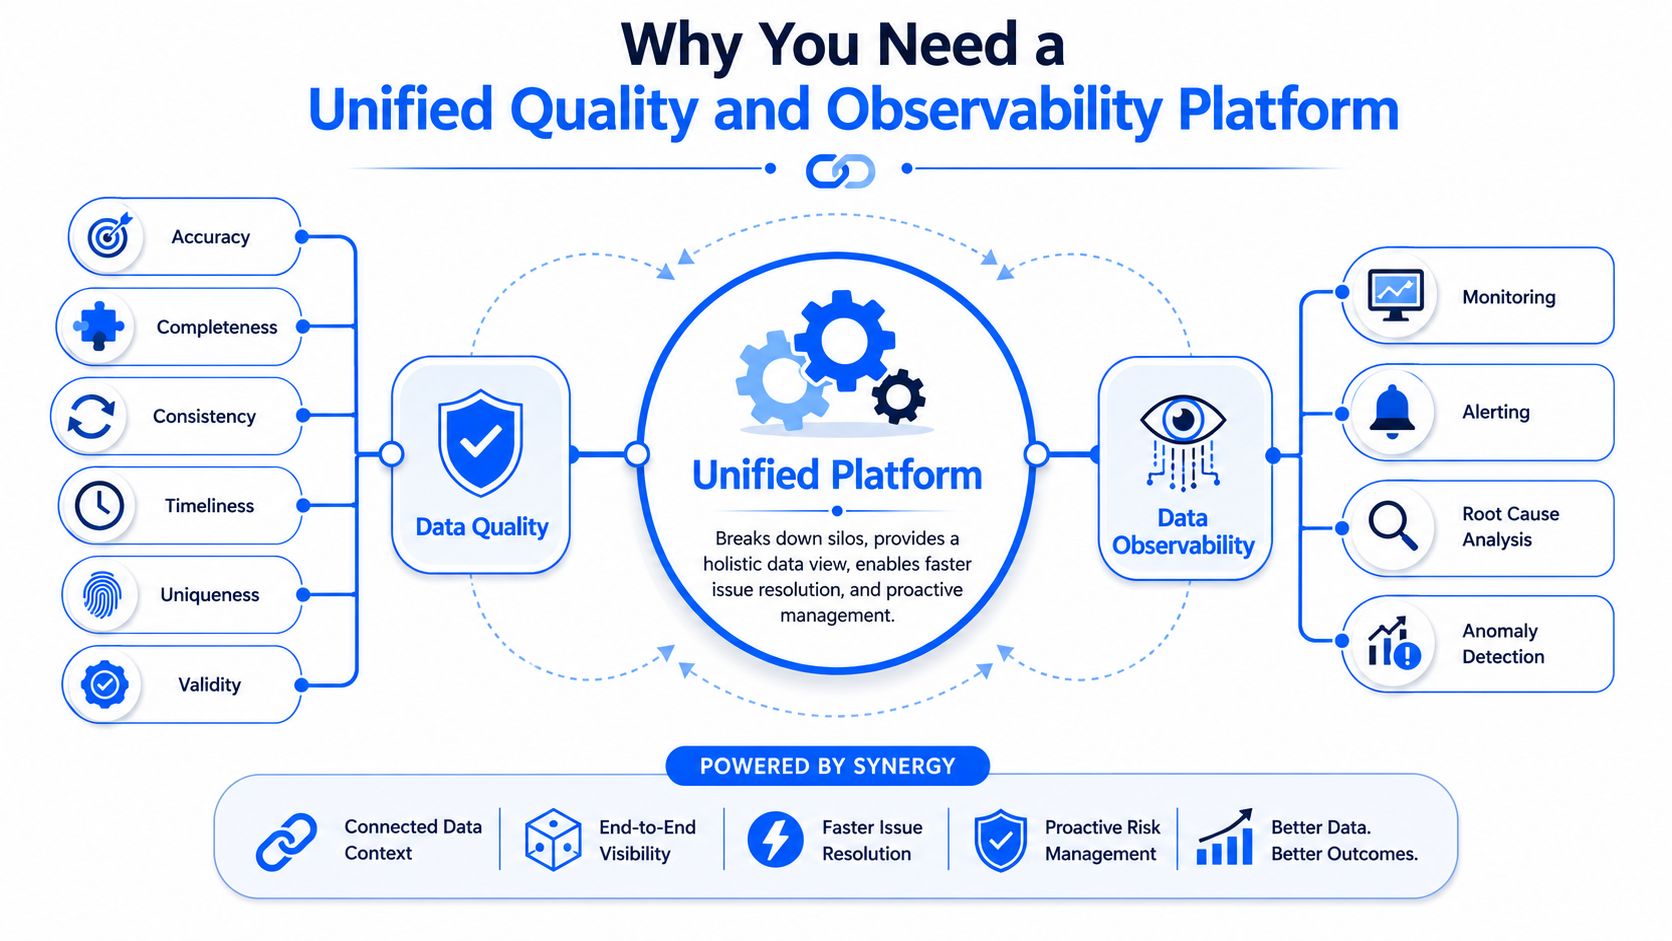
Why You Need a Unified Quality and Observability Platform
The market often treats data quality and data observability as separate categories. In operations, that split creates friction. One tool tells you a dataset arrived late. Another tells you a field failed a business rule. A third holds lineage or ownership context. Your team becomes the integration layer.
Operational health is not record correctness
Observability answers questions like:
Is the pipeline running on time?
Did row volume change unexpectedly?
Did the schema shift?
What upstream asset is connected to this dashboard?
Quality answers different questions:
Are the values valid?
Are key records duplicated?
Did a business rule break?
Can this dataset support audit or reporting requirements?
Teams need both. IBM's guidance and recent analysis point to the same operational reality. 68% of data teams now use two or more overlapping tools for observability and quality, creating integration fatigue and cost inefficiency, according to IBM's tutorial on the pillars of data quality.
That number fits what many platform teams already feel. Every incident starts with tool hopping. You check observability first, then validation results, then lineage, then ticketing, then warehouse logs, and finally ask a domain owner whether the data is even supposed to look like this today.
What unification changes in practice
A unified platform changes incident handling because it compresses context.
Instead of separate systems, the team gets one operating view:
The pipeline arrived late.
The affected table fed three business-critical reports.
Validation pass rates dropped on a key field.
A schema change occurred in the same upstream path.
The alert is routed to the owner with enough evidence to act.
That is not just convenience. It's a different operating model.
Separate tools can monitor separate symptoms. A unified platform helps you understand one incident.
There's also a governance angle. Compliance teams don't care whether a failure was “observability” or “quality.” They care whether controls existed, whether the issue was detected, and whether someone resolved it with traceable accountability.
A unified approach is especially valuable where vendor data access is restricted or where business-rule enforcement must sit alongside operational monitoring in one environment. That's why the debate shouldn't be framed as “observability or quality.” It should be framed as whether your platform can connect timeliness, schema behavior, anomaly signals, and record-level validation without forcing teams to correlate them manually.
If you're still sorting the boundary between the two categories, this comparison of data observability vs data quality is useful because it focuses on operating differences rather than vendor branding.
A Practical Framework for Evaluating Data Quality Tools
Most evaluations fail because they score features, not outcomes. A team gives points for dashboards, connectors, and rule libraries, then discovers during production that the platform floods Slack with noise or can't handle the actual data shape that matters.
The better approach is to evaluate tools against the operating conditions your team lives in.
According to Atlan's guidance on top data quality tools, a high-performance platform must score critically on six evaluation criteria: detection intelligence, resolution speed, efficient stack integration, adaptive learning capability, enterprise scalability, and actionable routing.
Six questions that expose real platform value
Use those six criteria as direct questions in the proof of concept.
Detection intelligence
Can the tool find issues before users report them?
This is the first test. A platform that only confirms obvious failures doesn't reduce risk much. It should detect unusual behavior, low-level drift, and changes that don't fit prior patterns. If you need to explain this idea to business stakeholders, it's similar to how commercial teams use systems to understand sales intelligence for revenue growth. Raw activity matters less than whether the platform identifies the meaningful signal early enough to act.
Resolution speed
How quickly can someone move from alert to root cause?
A good alert includes context. Which table changed, which rule failed, what downstream asset is at risk, and who owns the issue. If the alert only says “anomaly detected,” the team still has to build the incident story by hand.
Seamless stack integration
Does it fit your stack without heroic effort?
Native compatibility with tools like Snowflake, Databricks, and dbt matters because brittle integrations create blind spots. If the platform can't live naturally inside your ecosystem, your operational coverage will always lag behind architecture changes.
How to run a proof of concept that means something
Don't run a demo against a toy dataset. Use one domain with real operational consequences. Revenue, finance, customer identity, compliance reporting, or a customer-facing AI input table are good candidates.
Score the platform on live conditions:
Adaptive learning capability: Does alert quality improve as the platform learns normal patterns, or does tuning remain manual forever?
Enterprise scalability: Can it inspect large, noisy, business-critical datasets without degrading usefulness?
Actionable routing: Does the issue reach the right owner, with enough detail to fix it?
A simple evaluation matrix helps:
Criterion | Weak signal | Strong signal |
|---|---|---|
Detection intelligence | Finds only obvious failures | Detects subtle anomalies before user complaints |
Resolution speed | Alert lacks context | Alert points to cause, impact, and owner |
Integration | Requires custom work for core stack | Connects naturally to warehouse and pipeline tools |
Adaptive learning | Static thresholds dominate | Baselines and alert quality improve over time |
Scalability | Falls apart on volume or complexity | Remains usable on enterprise-scale datasets |
Routing | Shared inbox, generic noise | Routed to the responsible team with evidence |
A proof of concept should create at least one real incident simulation. If the tool only looks good in a happy-path demo, you haven't tested it.
Vendors often look similar in slideware. They separate quickly when you ask them to detect subtle drift, validate real business logic, and support action inside your actual operating environment.
Your Enterprise Adoption Roadmap and Checklist
A successful rollout usually starts smaller than teams expect, but with stricter discipline. Don't begin with every domain. Begin with one domain where bad data already has visible business consequences.
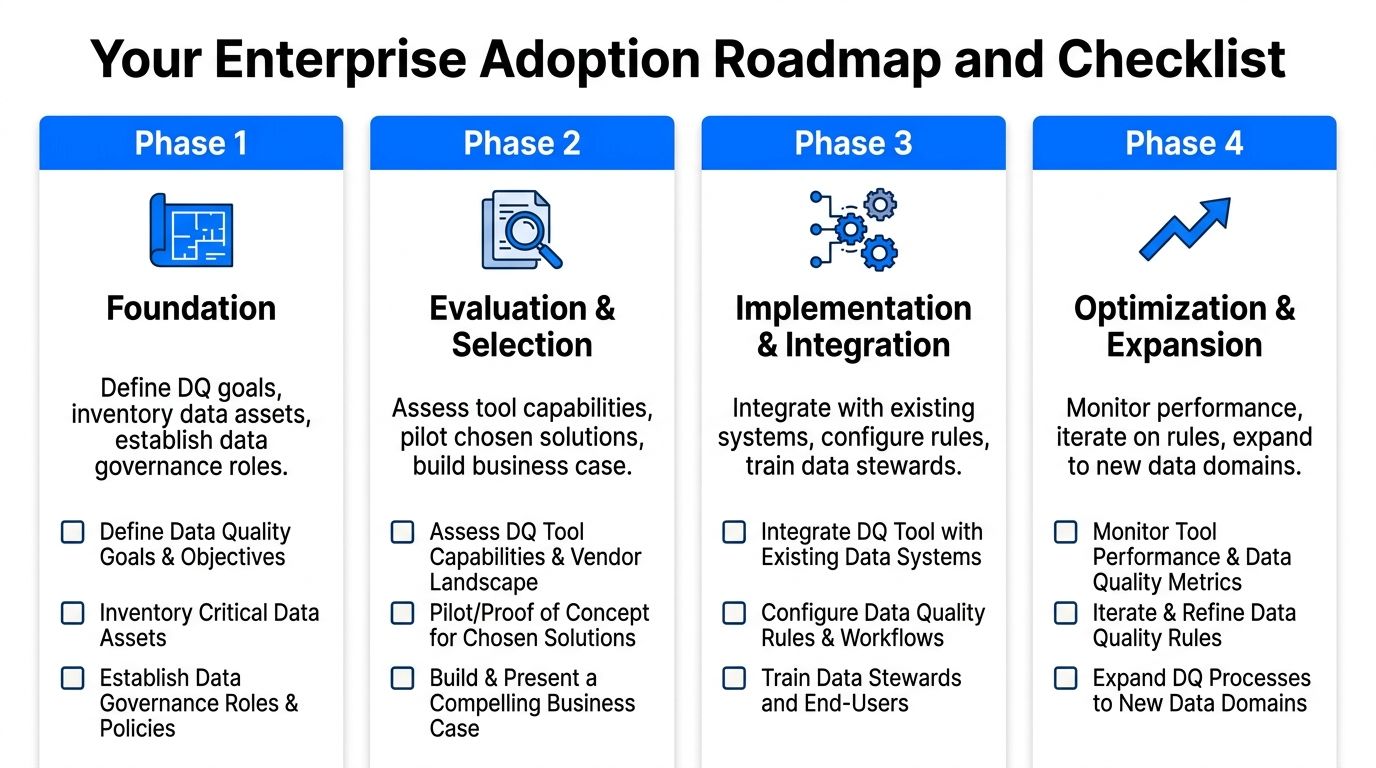
Phase by phase rollout
Phase 1: Pilot project
Pick a high-impact dataset with manageable scope. Revenue reporting, customer identity resolution, or a critical operational dashboard usually works well. Define what failure looks like before the pilot starts, including late arrivals, schema drift, invalid records, and unresolved alerts.
Phase 2: Tool selection
Run a structured proof of concept using the six evaluation criteria. Force vendors to show how they detect, route, and explain a real issue. If security or governance matters, validate deployment constraints early rather than treating them as a post-selection detail.
Phase 3: Scaled rollout
Expand coverage across critical domains once the pilot proves useful. Tie alerts into engineering and stewardship workflows. Standardize ownership so incidents don't stall in shared channels.
Phase 4: Governance and enablement
Create durable operating rules. Define who owns which datasets, which business rules matter most, how exceptions get handled, and how teams review recurring incident patterns. Enable analysts and domain teams to inspect quality state without waiting for platform engineers to interpret every signal.
Vendor checklist for final selection
Bring this checklist into vendor meetings and procurement reviews:
Architecture fit: Does the tool run where your security and compliance model requires it to run?
Data access model: Does the vendor need access to production data, or can the platform operate fully within your environment?
Record-level coverage: Can it validate business rules inside the data, not just metadata around it?
Operational coverage: Can it monitor timeliness, schema changes, and anomaly behavior in one workflow?
Integration fit: Does it connect cleanly to your warehouse, lake, and pipeline ecosystem?
Ownership model: Can alerts be routed to the person who can fix the issue?
Noise control: Does the tool adapt over time, or will your team babysit thresholds manually?
Auditability: Can you show what failed, when it failed, and how the issue was resolved?
A good adoption plan turns data quality from a periodic cleanup exercise into a normal operating discipline. That's when the platform starts paying off.
If your team wants one system that combines anomaly detection, record-level validation, timeliness monitoring, and schema tracking without moving data outside your environment, digna is worth evaluating alongside the other platforms on your shortlist. Its in-database approach is especially relevant for enterprises that need private cloud or on-prem deployment, strong control over production data access, and one interface for both data quality and observability.


