Completeness as a Data Quality Dimension: A 2026 Guide
|
8
minute de lecture

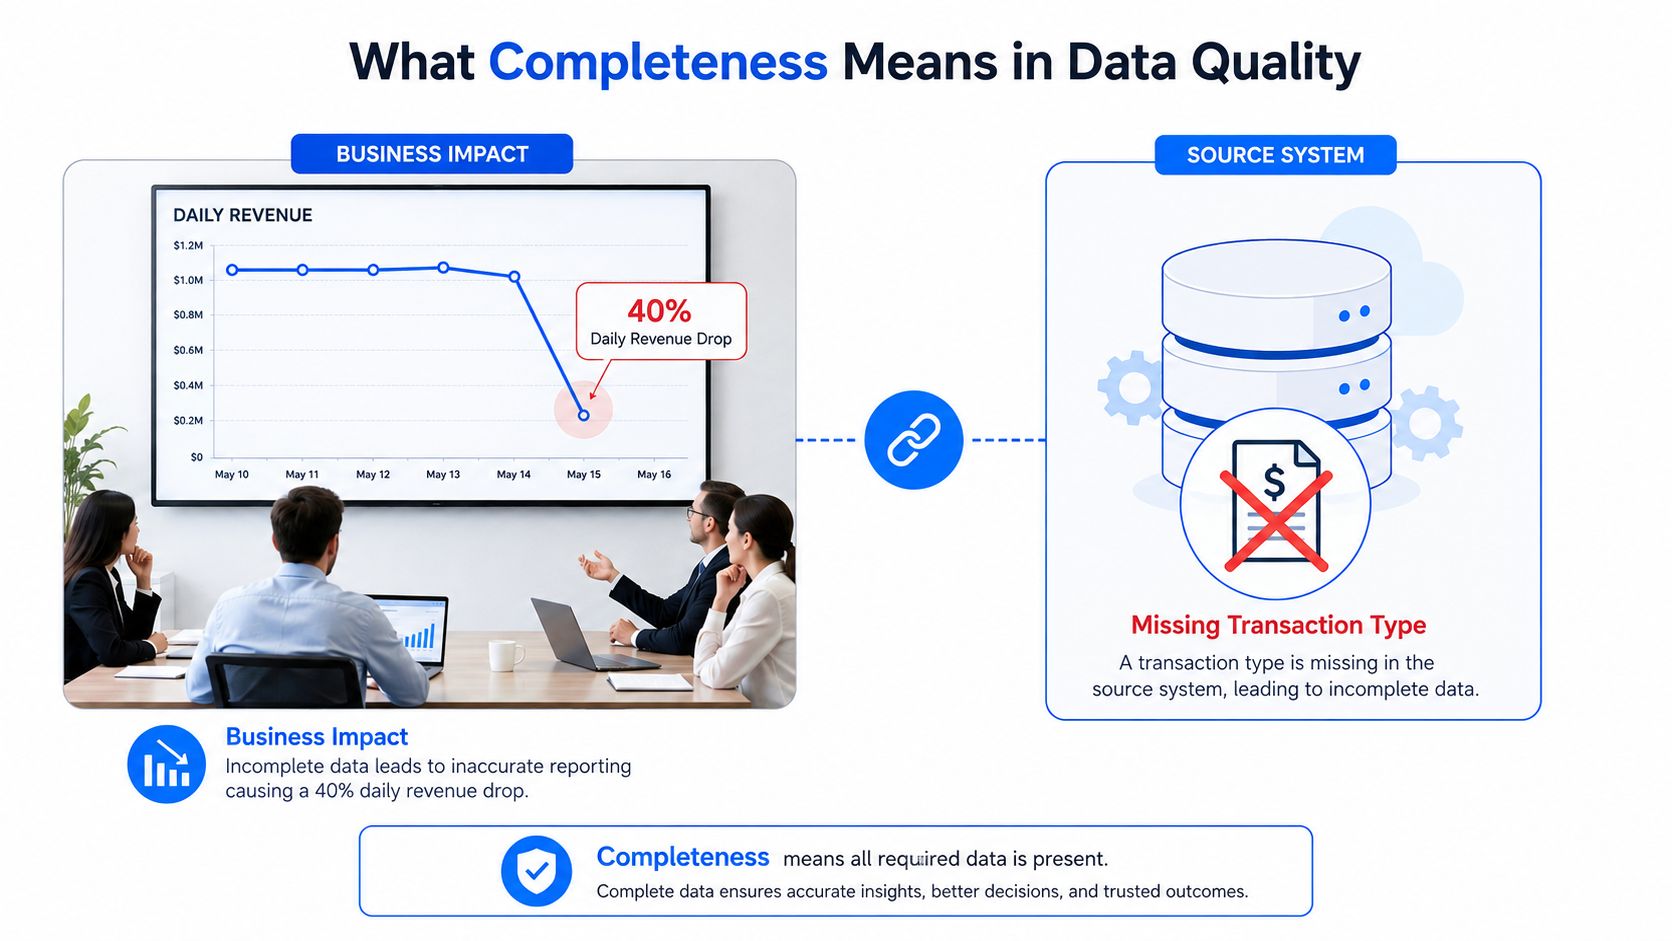
Your daily revenue dashboard looks normal until one morning the total drops sharply. The source system is online, the pipeline reports success, and most columns are populated. The problem is that one transaction type never arrived, or a customer identifier disappeared during an export. This is the kind of failure that data quality completeness is designed to expose.
Completeness in data quality means whether all data required for an intended purpose is present. That includes required values inside records, records that should exist but are missing, and expected data volumes across files or time periods. A dataset can contain no obvious blanks and still be incomplete if an entire group of customers, transactions, or events has been excluded.
The practical standard is fitness for purpose. A dataset may be complete enough for one analysis and incomplete for another, because each use case requires different fields, records, coverage, and delivery patterns. The UK government's explanation of data quality dimensions makes this distinction directly, defining completeness in relation to the data required for a particular use rather than population of every possible field.
Table of Contents
What Completeness Means in Data Quality
Suppose a finance team's dashboard shows an unexpected revenue decline. An analyst checks the transaction table and finds that most rows have customer IDs, dates, amounts, and payment statuses. The table looks healthy at first glance. A later comparison reveals that mobile transactions were absent from the latest load, so the report was missing valid records rather than merely containing blank cells.
That distinction defines completeness as a data quality dimension. It asks whether the dataset contains everything needed to support its stated purpose. The question isn't “Are all columns full?” It's “Does this data include the required values, records, and coverage needed for the decision someone intends to make?”
Why non-null values aren't enough
A customer table can have a low null rate while still omitting every customer created through a particular channel. A transaction table can contain well-formed rows while missing an entire event type. A daily file can have complete records but represent only part of the expected business activity.
Completeness therefore operates at more than the cell level:
Field completeness asks whether required attributes are populated.
Record completeness asks whether each required entity or event appears.
File completeness asks whether the expected file, partition, or load arrived.
Population completeness asks whether the dataset represents the relevant real-world population, including groups, dates, and transaction types.
The history of the concept reflects this broader view. Research has treated completeness as a named data quality attribute since at least 1983, when Bailey and Pearson included it among core attributes of output information quality. Later work summarized completeness as whether all relevant data is recorded, while modern guidance frames it around the needs of a particular use. A useful overview of data coverage concepts from Wine Labs can help teams think beyond populated columns and examine whether the intended population is represented.
Practical rule: Define what must be present before you calculate whether the data is complete.
A clear working definition is: Completeness is the presence of all required data for a defined business purpose, including required values, records, files, and population coverage. Teams establishing a broader framework can also review how data quality dimensions are defined and measured.
The Three Layers of Completeness
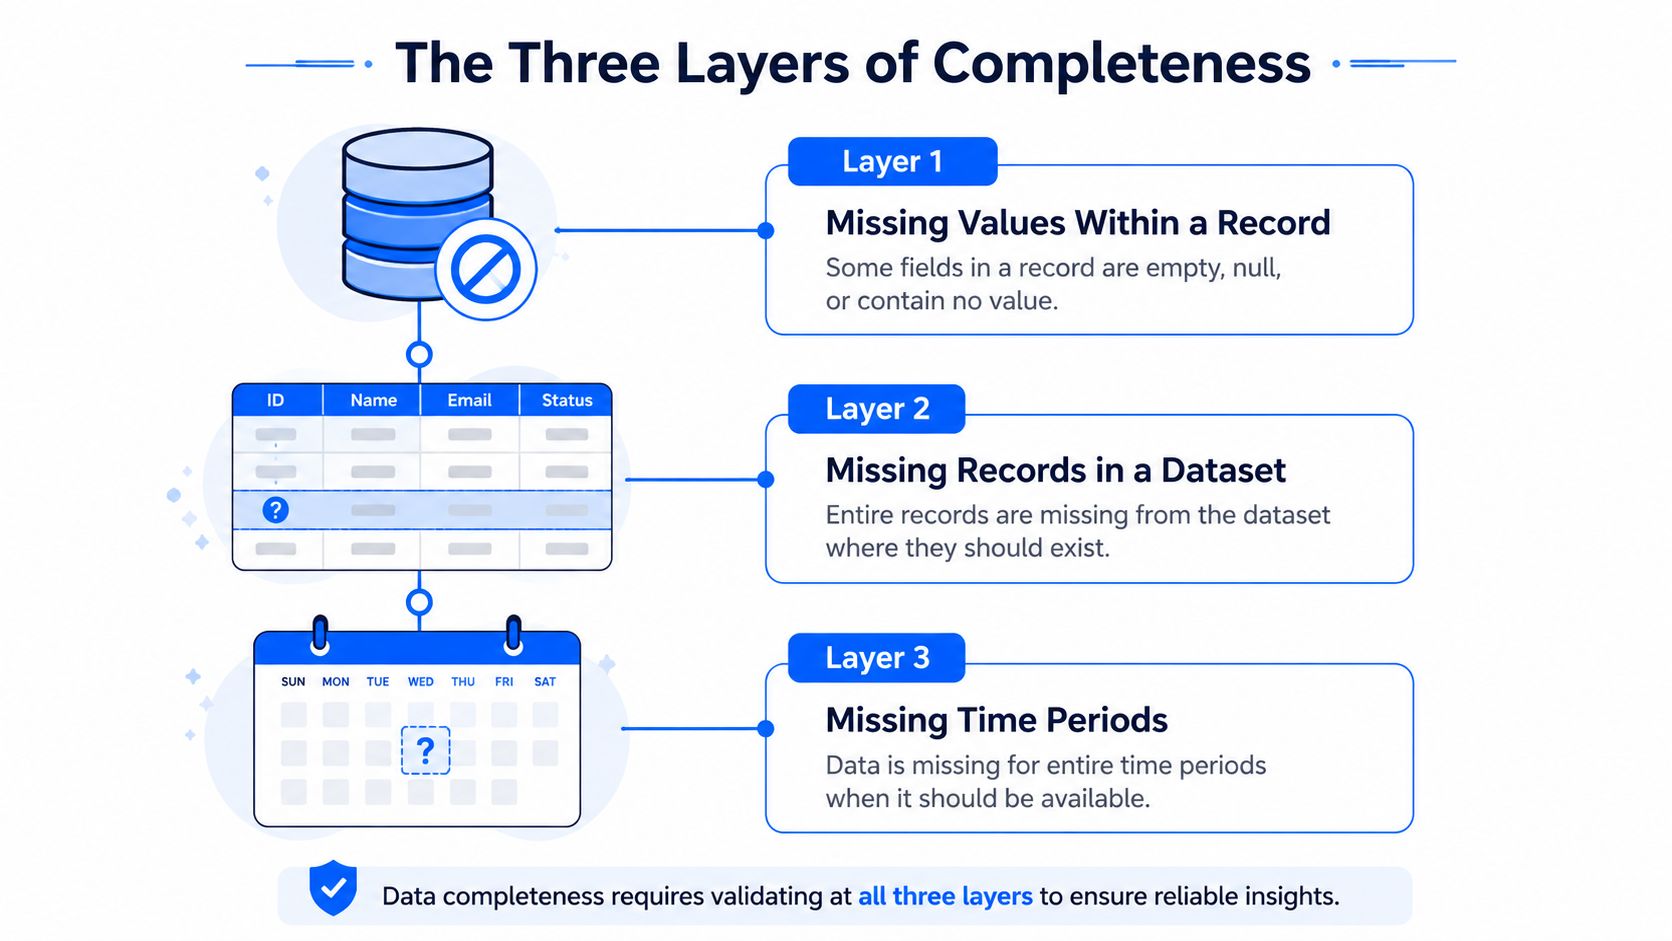
Teams often treat completeness as a null-checking exercise. That catches only one layer of the problem. A reliable data completeness program separates gaps inside records from missing records and missing coverage across time or expected volumes.
Think of a library. A book may be missing pages, a required book may be absent from the shelf, or the library may have stopped cataloging new arrivals for several days. Each situation represents incompleteness, but each requires a different test.
Layer one is missing values
The first layer concerns attributes within a record. A customer row may exist, but its customer ID, postal code, consent status, or creation timestamp may be null, blank, or replaced with a default value.
Required-field checks work well here. The team identifies fields needed for a task, counts records where those fields are absent, and monitors the result over time. A missing postal code might limit regional analysis, while a missing primary identifier can prevent joins entirely.
Not every blank is automatically a defect. Optional profile information may be legitimately unavailable, while an identifier required for identity resolution usually isn't optional. The business definition must come before the threshold.
Layer two is missing records
The second layer concerns entire rows. An expected customer, order, payment, or event never reaches the target table. Row-level validation won't find it because there is no row to inspect.
Teams can detect this through reconciliation with an authoritative source, expected key ranges, event inventories, control totals, or comparisons between upstream and downstream systems. For example, if an order-management system records an order ID but the warehouse table doesn't, the warehouse is incomplete even if every row that did arrive passes its field checks.
Layer three is missing volume or coverage
The third layer concerns the shape of the dataset across time, files, partitions, or business populations. A daily event table may contain valid rows, yet the load can be materially smaller than the expected volume. A partition may be absent, a source file may be empty, or a new event type may stop flowing after a schema change.
This layer connects completeness with timeliness. A late file is incomplete for a dashboard that must reflect the latest reporting period, even if the file eventually arrives. It also connects with schema drift. If a source removes a column or changes an event structure, downstream processes may lose the facts needed for a use case.
Completeness vs Accuracy and How They Diverge
Completeness and accuracy answer different questions.
Completeness: Is the required data present?
Accuracy: Does the data correctly represent the world entity, event, or value?
A record can be present but wrong. It can also be correct wherever it exists but missing from the dataset.
Consider a customer table used to join customers to orders. Every populated email address follows the expected format, and the existing customer details match the source system. However, some customer IDs are null. The values that exist may be accurate, but the table is incomplete for identity-based joins because required identifiers are absent.
Now reverse the problem. Every customer row contains a customer ID, so the table appears complete. But some IDs point to the wrong people because an upstream mapping process assigned them incorrectly. The dataset is complete in terms of presence, yet inaccurate in terms of meaning.
Dimension | Core question | Typical failure | Useful check |
|---|---|---|---|
Completeness | Is all required data present? | Missing customer IDs or absent transactions | Required-field, reconciliation, and volume checks |
Accuracy | Does the data reflect reality? | An ID linked to the wrong customer | Comparison with an authoritative source |
Both | Is the required data present and correct? | A missing or misassigned account | Separate completeness and accuracy controls |
Teams confuse the dimensions because a visible blank is easy to identify, while a wrong value can look perfectly plausible. A populated field isn't evidence that it is accurate, and an accurate subset isn't evidence that the full population is present.
The operational response should keep the controls separate. Completeness checks look for nulls, missing keys, absent events, missing files, and unexpected volumes. Accuracy checks compare values with trusted references, validate identity relationships, or test whether business facts match reality. A broader explanation of data observability compared with data quality helps place these controls within a wider operating model.
Metrics, Ratios and Required-Field Checks
Measurement starts with an explicit expectation. Before calculating a completeness score, define the required fields, required records, relevant population, delivery schedule, and acceptable variation for the use case.
The simplest field-level metric is a completeness ratio:
Completeness ratio = present required values ÷ expected required values
If a table contains records for which a required customer ID should be present, count the populated IDs and divide that count by the number of records expected to contain them. The result can be expressed as a ratio or percentage. The same logic applies to expected records, files, partitions, or events.
A complementary measure is the null rate:
Null rate = missing values ÷ expected values
A null rate that might be tolerable for an optional marketing attribute can be unacceptable for a primary key. Thresholds must reflect business consequences, not a universal target. A missing email may reduce campaign reach, while a missing account identifier can prevent reconciliation, lineage, and downstream joins.
Choosing fixed and adaptive thresholds
Use a fixed threshold when the rule is inherent to the data contract. A primary key may be required for every accepted record, and a missing value should trigger a failure regardless of historical behavior.
Use an adaptive threshold when the expected value varies by schedule, season, day, source behavior, or business activity. Historical baselines can identify an unusual drop in daily records without forcing engineers to maintain a separate number for every period.
A practical monitoring design combines both approaches:
Required-field checks identify missing values in critical columns.
Record reconciliation identifies expected entities or events that never arrived.
Volume checks compare observed counts with expected ranges.
Distribution checks identify changes that may indicate a partial population or dropped category.
Trend monitoring shows whether a completeness issue is stable, improving, or worsening.
The table below maps common controls to implementation capabilities.
Dimension | Metric | Example check | digna capability |
|---|---|---|---|
Field completeness | Null rate by required field | Customer ID is present for every required customer record | Data Validation |
Record completeness | Missing-key count | Order IDs in the source are absent from the warehouse | Data Validation |
File completeness | Arrival or load status | The scheduled transaction partition is missing | Data Anomalies |
Volume completeness | Observed versus expected record count | Daily event volume is unexpectedly low | Data Anomalies |
Distribution completeness | Category or event coverage | A transaction type disappears from the latest load | Data Anomalies |
Trend completeness | Completeness ratio over time | Required-field coverage declines across successive loads | Data Analytics |
Teams can extend this model with data quality metrics and measurement practices. The important point is to measure the level at which failure occurs. A single overall score can conceal a missing population, so report field, record, file, and volume metrics separately.
Real Examples of Incomplete Enterprise Data
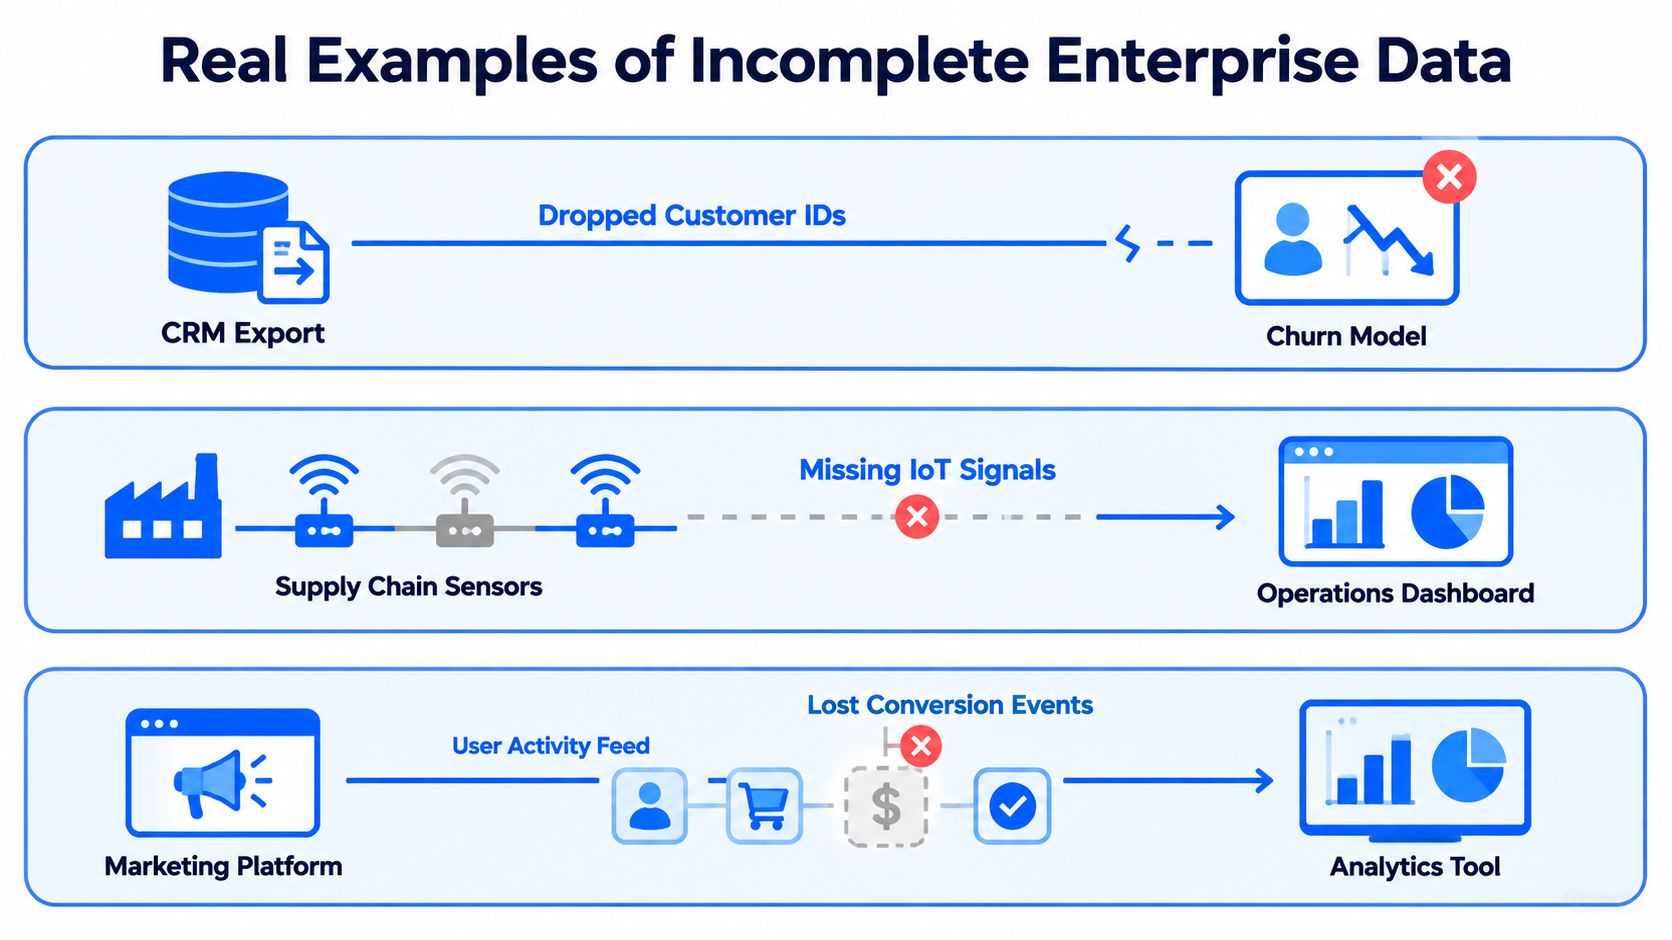
Completeness failures usually appear first as a business symptom. A model loses predictive power, a revenue total looks low, or an operations dashboard reports an implausible decline. The technical cause often sits earlier in the pipeline.
A CRM export loses customer identifiers
A CRM export contains new mobile sign-ups, but the customer ID field is blank for that group. The rows are present, and names and email addresses may look valid, yet the identity-resolution process can't reliably connect those customers to orders, support history, or prior activity.
The business notices a break in churn analysis or an unexplained increase in unidentified customers. A required-field rule on customer ID would catch the defect at record level. A population comparison by acquisition channel would reveal that the problem affects a specific group rather than the entire export.
A payment feed leaves transactions unfinished
A payment processor continues to send transaction rows, but some payments remain marked as pending indefinitely. The table appears populated, while the month-end revenue process cannot treat those transactions as settled or include them in the expected financial outcome.
The completeness gap is not just a null value. The required transaction lifecycle is incomplete for the reporting purpose. Controls should compare expected transaction states and reconciliation totals, while timeliness monitoring should identify records that fail to progress within the defined operational window.
A partitioned event load writes far fewer rows
A daily batch normally produces a large event table. One day, a partitioned load fails and only a small subset of rows reaches the warehouse. The surviving rows pass schema and required-field checks, so a row-level test alone reports success.
The first visible symptom may be a low activity dashboard or a missing segment in an analytics model. A schedule-aware volume check would compare the observed count with historical behavior and flag the load for investigation. Distribution monitoring could then show which source, date, or event type disappeared.
These examples share a lesson: incomplete data doesn't always look broken inside the rows that arrived. Monitoring must test what should have arrived, not only what is currently stored.
How digna Supports Data Completeness
A completeness program needs both deterministic rules and behavioral monitoring. The right choice depends on whether the expectation is explicit, such as “customer ID is required,” or learned from recurring data behavior, such as an unusual change in daily volume.
digna Data Validation
digna Data Validation applies record-level checks against business rules. A team can define required-field controls for customer IDs, transaction dates, account keys, or other attributes needed for a specific workflow. The module can also support targeted checks for empty values and business conditions that determine whether a record is usable.
This is the clearest control for the first layer of completeness, missing values within records. It can also support record-level completeness logic, where a row must contain a defined combination of values before it is accepted for downstream use.
digna Data Anomalies
digna Data Anomalies monitors unexpected changes in record counts, null rates, and distributions. Its baseline-learning approach is suited to data that varies naturally, where a single fixed limit would create unnecessary alerts.
This helps address missing records and missing volume. An unexpected reduction in daily rows, disappearance of a transaction category, or sudden rise in nulls can be investigated as a possible partial load, source interruption, or pipeline change. The module also helps surface patterns that weren't covered by manually written rules.
digna Data Analytics
digna Data Analytics provides historical analysis of completeness metrics. A current null rate has limited meaning without context. Historical views help teams distinguish a stable characteristic from a recent deterioration and identify whether a recurring load issue is becoming more frequent.
The modules can be mapped to the three layers:
Missing values: Data Validation checks required fields and record conditions.
Missing records: Validation and anomaly monitoring compare expected and observed coverage.
Missing volume or periods: Data Anomalies monitors counts, distributions, and load behavior, while Data Analytics shows the trend.
digna performs metric computation and analysis in the customer's database environment, so the data remains in place. Deployment can take place inside a private cloud, VPC, or data center, which supports teams that need completeness monitoring without moving production data to an external service.
The practical design is modular. A team can start with explicit required-field rules, add anomaly detection for unexpected changes, and use historical analytics to govern thresholds and remediation. Schema tracking and timeliness controls can complement this setup when removed columns or late-arriving loads create completeness failures indirectly.
Monitoring Cadence, Governance and Common Questions
Completeness monitoring works best when each control runs at the point where its failure matters. Required-field checks should run on every relevant load. Volume checks should run according to the dataset's delivery schedule. Anomaly detection should evaluate behavior continuously or whenever new data arrives.
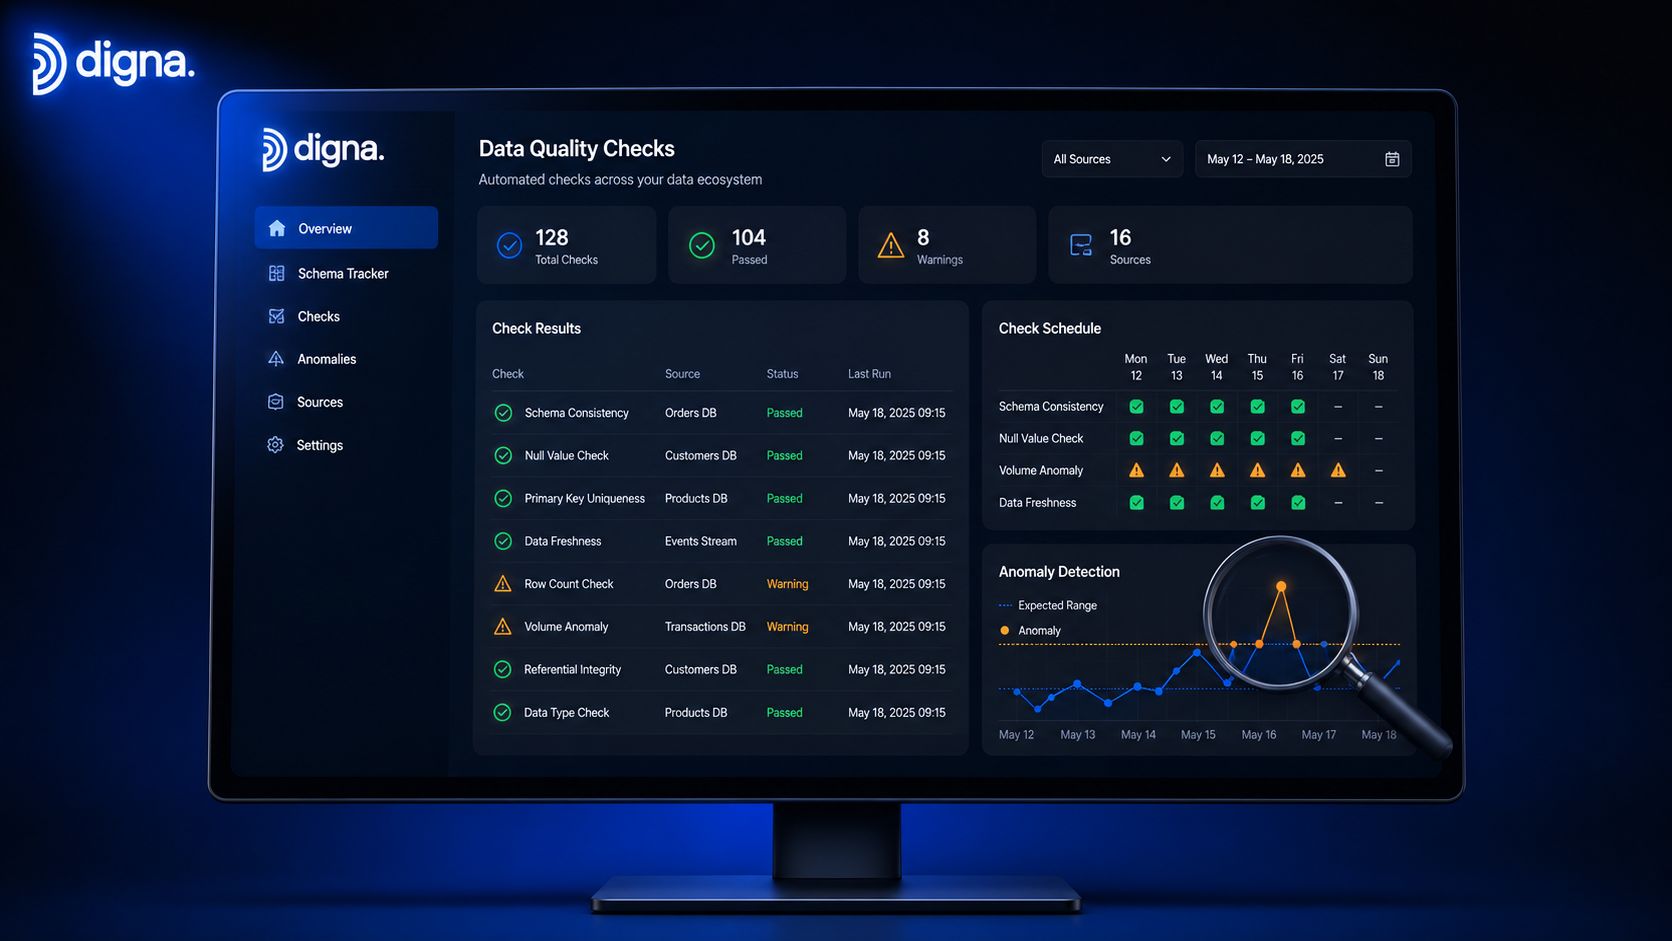
Assign ownership before alerts start. Data engineers can investigate failed loads, data stewards can define which fields and populations are required, and business owners can decide whether a gap blocks a report or requires a warning. Use severity and routing rules so teams aren't alerted for every harmless variation.
Frequently asked questions
What is completeness in data quality?
Completeness is whether all data required for an intended purpose is present. It includes required values, expected records, relevant files, time periods, and population coverage.
How is data completeness measured?
Measure present required values against expected required values, calculate null rates by field, reconcile source and target records, and compare observed volumes with expected ranges. Use separate metrics for fields, records, files, and populations.
What are useful completeness metrics?
Useful metrics include required-field null rate, completeness ratio, missing-key count, source-to-target reconciliation, file-arrival status, record-volume variance, and category or event coverage.
What is a good completeness threshold?
There isn't one universal threshold. Set the limit according to the field's role, the intended use, and the consequence of missing data. A primary identifier generally requires stricter treatment than an optional descriptive attribute.
How do you monitor completeness continuously without alert fatigue?
Combine fixed rules for essential requirements with adaptive baselines for changing volumes. Group related alerts, assign owners, document expected exceptions, and review historical trends before tightening thresholds.
How does completeness differ from accuracy?
Completeness asks whether the required data exists. Accuracy asks whether the data reflects reality. A dataset can be complete but wrong, or accurate wherever populated but missing important records.
A short visual walkthrough can help teams connect these practices to day-to-day monitoring:
Start by listing the data your most important report, model, or operational process requires. Then add field checks, record reconciliation, volume monitoring, and historical review at the appropriate cadence, rather than relying on a single completeness score.
digna provides Data Validation, Data Anomalies, and Data Analytics to help teams enforce required-field rules, detect unexpected changes in counts and null rates, and monitor completeness trends over time inside their own environment. Visit digna to explore a modular approach to data quality and observability.